OpenShift Monitoring
OpenShift - Overview
OpenShift is a powerful and flexible open source container application orchestrated and managed by Kubernetes. They’re complex to set up, monitor and maintain. To outmaneuver the operational challenges faced when dealing with OpenShift containers, round-the-clock OpenShift monitoring is necessary. Applications Manager's OpenShift monitoring capabilities helps you to simplify application maintenance and ensures that OpenShift performance is up to par.
Creating a new OpenShift monitor
Using the REST API to add a new OpenShift monitor:Click here
Prerequisites for monitoring OpenShift monitor with Prometheus integration : Refer here
Supported Versions: OpenShift v4.20 and below
Follow the steps given below to create a new OpenShift monitor:
- Click on New Monitor link. Select OpenShift under Virtualization category.
- Specify the Display Name of the OpenShift Server.
- Enter the Hostname of the server on which OpenShift is running.
- If you choose the Use Below Credentials option, then enter basic authentication details used to connect with System using SSH.
- Check Public Key Authentication option if you use SSH2.
- Prompt - Specify the command prompt value, which is the last character in your command prompt. Default value is $ and possible values are >, #, etc.
- SSH Port - Enter the SSH Port. By default, it is 22.
- Enable the Collect major metrics using REST APIoption to collect the major metrics of Openshift environment through REST API. After enabling this option, enter the following information:
- Websocket Port: Port of the OpenShift application. By default, port number is 8443.
- Service Account Token: Service account token of the OpenShift cluster administrator user.
Note: For the Service Account Token, the user should ensure that "Cluster Reader Permission" is assigned. Click here to learn how to obtain the service account token
- Enter the OpenShift authentication details (OpenShift User Name and OpenShift Password) used to connect with cluster.
- If you choose the Select from credential list option, then select the respective credential from preconfigured credential list.
- Enable the Monitor Specific Project(s)option if you wish to monitor only specific project(s) in the OpenShift environment. After enabling, specify the following details:
- Filter Condition: Select the filtering condition to include or exclude monitoring of specific project(s) in the OpenShift environment.
- Project Name(s): Specify the name of the project(s) to be included/excluded while monitoring. You can enter multiple project names as comma-separated values.
- Specify the Timeout in seconds.
- Specify the Polling Interval in minutes.
- Choose the Monitor Group with which you want to associate the OpenShift to, from the combo box (optional). You can choose multiple groups to associate your monitor.
- Click Add Monitor(s). This discovers the OpenShift from the network and starts monitoring it.
Note: In the OpenShift architecture, it is sufficient to add the primary master node alone to the Applications Manager. Applications Manager will automatically discover all the other master and worker nodes within the cluster and monitor them closely. There is no need to individually add each node as an OpenShift monitor as this will lead to a performance issue.
Monitored Parameters
Go to the Monitors Category View by clicking the Monitors tab. Click on OpenShift under the Virtualization table. Displayed is the OpenShift bulk configuration view distributed into three tabs:
- Availability tab, gives the Availability history for the past 24 hours or 30 days.
- Performance tab gives the Health Status and events for the past 24 hours or 30 days.
- List view enables you to perform bulk admin configurations.
On clicking a monitor from the list, you'll be taken to the OpenShift monitor dashboard. It has 9 tabs-
Overview
| Parameter | Description | Supported in SSH mode | Supported in Prometheus |
|---|---|---|---|
| CLUSTER USAGE DETAILS | |||
| Average Cluster CPU Usage | Average CPU used by the cluster in %. |  |  |
| Average Cluster Memory Usage | Average memory used by the cluster in %. | | |
| CLUSTER DETAILS - PODS | |||
| Pod Utilization | Number of pods used in %. | | |
| Used Pod Count | Number of pods used. | | |
| Maximum Pod Count | Total number of pods available. | | |
| Top 5 Nodes by Used Pod Count | Graph of top 5 nodes by used pod count. | | |
| NODE DETAILS | |||
| Master Node Count | Number of Master nodes present. | | |
| Worker Node Count | Number of Worker nodes present. | | |
| Component Details | |||
| Component Name | Name of the component. | | |
| Status | Health of the component. | | |
| Component Message | Message shown when the component status is unhealthy. | | |
| Summary Details | |||
| Project Count | Total number of projects in the system. | | |
| Node Count | Total number of nodes in the system. | | |
| Pod Count | Total number of pods in the system. | | |
| Running Pod Count | Total number of running pods in the system. | | |
| Containers Count | Total number of containers in the system. | | |
| Service Count | Total number of services in the system. | | |
| Deployment Count | Total number of deployments in the system. | | |
| Replication Count | Total number of replications in the system. | | |
| ReplicaSet Count | Total number of replica sets in the system. | | |
| Jobs Count | Total number of jobs in the system. | | |
Project
| Parameter | Description | Supported in SSH mode | Supported in Prometheus |
|---|---|---|---|
| Project Details | |||
| Project Name | Name of the OpenShift project. | | |
| Project Status | Current status of the project. | | |
| CPU Usage (%) | CPU utilization of workloads within the project. | | |
| Memory Usage (%) | Memory utilization of workloads within the project. | | |
| Namespace Pods Usage Details | |||
| Project Name | Name of the OpenShift project. | | |
| Pods Count | Total number of pods in the namespace. | | |
| Running Pods Count | Number of running pods in the namespace. | | |
| Succeeded Pods Count | Number of successfully completed pods. | | |
| Pending Pods Count | Number of pods waiting to be scheduled or started. | | |
| Failed Pods Count | Number of pods that have failed. | | |
| Unknown Pods Count | Number of pods with unknown status. | | |
| Namespace Memory & CPU Details | |||
| Project Name | Name of the OpenShift project. | | |
| CPU Limit | Maximum CPU allocated to the namespace. | | |
| CPU Request | CPU requested by workloads in the namespace. | | |
| Memory Limit (Gi) | Maximum memory allocated to the namespace. | | |
| Memory Request (Gi) | Memory requested by workloads in the namespace. | | |
| Network Received (Gi) | Total inbound network traffic for the namespace. | | |
| Network Transmitted (Gi) | Total outbound network traffic for the namespace. | | |
Node
| Parameter | Description | Supported in SSH mode | Supported in Prometheus |
|---|---|---|---|
| Top 5 Nodes by CPU Details | |||
| CPU Limit | Maximum limit of CPU | | |
| CPU Request | Total number of CPU requests | | |
| Top 5 Nodes by Memory Details | |||
| Memory Limit | Maximum limit of Node memory in GiB. | | |
| Memory Requests | Total number of memory requests. | | |
| Node Memory & CPU Details | |||
| Name | Name of the Node | | |
| Allocatable CPU Processor Count | Number of CPU processors that can be allocated in the node. | | |
| CPU Limit(%) | CPU limit of the node in %. | | |
| CPU Request(%) | Amount of CPU requested in %. | | |
| Allocatable Memory(GiB) | Amount of memory allocatable in GiB. | | |
| Memory Limit(%) | Memory limit of the node in %. | | |
| Memory Request(%) | Amount of memory requested in %. | | |
| Disk Usage | Disk space used on the node. | | |
| Node Pod Details | |||
| Name | Name of the node. | | |
| Pod Usage Details | Amount of pods used- Green represent free pods and red represents used pods. | | |
| Used Pod Count | Number of pods used. | | |
| Allocatable Pod Count | Number of pods allocatable. | | |
| Pod Utilization(%) | Number of pods used in %. | | |
| Image Count | Number of container images. | | |
| Node Details | |||
| Name | Name of the node. | | |
| Hostname | Name of the machine it is hosted on. | | |
| Internal IP | IP address of the machine. | | |
| OS | OS of the machine. | | |
| Type | Type of the machine. | | |
| Allocatable Ephemeral Storage(GiB) | Amount of allocatable ephemeral storage in GiB. | | |
| Action | You can perform the following action-
| | |
Pods
| Parameter | Description | Supported in SSH mode | Supported in Prometheus |
|---|---|---|---|
| Pod Details | |||
| Pod Name | Name of the pod. | | |
| Project Name | Name of the project in which the pod is created. | | |
| Pod Node Name | Name of the node in which the pod resides. | | |
| Number of Containers | The total number of containers running in a pod. | | |
| Pod Type | Type of the pod. | | |
| Pod IP | IP address of the pod. | | |
| Pod Status | Status of the pod. | | |
| Pod Start Time | Time at which the pod was started. | | |
| Pod Created Time | Time at which the pod was created. | | |
| Pod Persistent Volumes Claim | The number of Persistent Volume Claims associated with a pod. | | |
| Top 5 Pods by CPU Usage Details | Graph of top 5 pods by CPU usage. | | |
| Top 5 Pods by CPU Throttled Details | Graph of top 5 pods by CPU throttled. | | |
| Pod Memory Details | |||
| Pods Memory Request | Total number of memory requests. | | |
| Pod Memory & CPU Details | |||
| Pod Name | Name of the pod. | | |
| Number of Containers | Number of containers in the pod. | | |
| Pod CPU Limit(%) | CPU limit of the pod in %. | | |
| Pod CPU Request (%) | Amount of CPU requested in %. | | |
| Pod Memory Limit(%) | Memory limit of the pod in %. | | |
| Pod Memory Request(%) | Amount of memory requested in %. | | |
| Pod Persistent Volumes Claim | Name of persistent volume claim of the pod. | | |
| CPU Limit | CPU limit configured for the pod. | | |
| CPU Request | CPU requested by the pod. | | |
| CPU Usage | Actual CPU consumed by the pod. | | |
| CPU Throttled | CPU throttling experienced by the pod due to limit enforcement. | | |
| Memory Limit | Memory limit configured for the pod. | | |
| Memory Request | Memory requested by the pod. | | |
| Memory Used | Actual memory consumed by the pod. | | |
| Disk Used | Disk space used by the pod. | | |
| Network Rx | Data received by the pod. | | |
| Network Tx | Data transmitted by the pod. | | |
Containers
| Parameter | Description | Supported in SSH mode | Supported in Prometheus |
|---|---|---|---|
| Top 5 Containers by Restart count | Graph of top 5 nodes by Restart count | | |
| Container Details | |||
| Container Name | Name of the container. | | |
| Container Image | Image of the container. | | |
| Pod Name | Name of the pod which has the container. | | |
| Container Status | Status of the container. | | |
| Container Restart Count | Number of times the container was restarted. | | |
| Container Start Time | Time at which the container was started. | | |
| Top 5 Containers by CPU Usage | Graph of top 5 nodes by CPU Usage. | | |
| Top 5 Containers by CPU Throttled | Graph of top 5 nodes by CPU throttled. | | |
| Container CPU Details | |||
| CPU Limit | CPU limit of the node allocated to the container (in %). | | |
| CPU Request | CPU requested by the container. | | |
| CPU Usage | Actual CPU consumed by the container. | | |
| CPU Throttled | CPU throttling experienced by the container. | | |
| Disk Used | Disk space used by the container. | | |
| Top 5 Containers by Memory Details | Graph of top 5 nodes by memory limit and requests. | | |
| Top 5 Containers by Memory Usage | Graph of top 5 nodes by memory usage. | | |
| Container Memory Details | |||
| Container Name | Name of the container. | | |
| Container Memory Limit(Gi) | Memory limit configured for the container. | | |
| Container Memory Request(Gi) | Memory requested by the container. | | |
| Container Memory Usage(%) | Actual memory consumed by the container. | | |
| Container Network Received(Gi) | Data received by the container. | | |
| Container Network Transmitted(Gi) | Data transmitted by the container. | | |
| Top 5 Containers by Network Received | Graph of top 5 nodes by data received. | | |
| Top 5 Containers by Network Transmitted | Graph of top 5 nodes by data transmitted. | | |
Services
| Parameter | Description | Supported in SSH mode | Supported in Prometheus |
|---|---|---|---|
| Services Details | |||
| Name | Name of the service. | | |
| Project Name | Name of the project in which the service is created. | | |
| Application | Name of the application it is used in. | | |
| Service Type | Type of the service. | | |
| Cluster IP | IP address of the cluster. | | |
| Service Ports | Number of service ports. | | |
| Created Time | Time at which the service was created. | | |
| Deployment Details | |||
| Name | Name of the deployment. | | |
| Project Name | Name of the project in which the deployment is created. | | |
| Replica Set | Name of the replica set. | | |
| Desired Replica | Desired Replica specifies the number of pods that needs to be replicated. | | |
| Running Replica | Running Replica displays the number of replicas that are currently running. | | |
| Available Replica | Available replica specifies the number of application replicas that are available to your users. | | |
| Deployment Availability | States whether the deployment is available or not. | | |
| Actions | You can perform 2 actions-
| | |
Replica
| Parameter | Description | Supported in SSH mode | Supported in Prometheus |
|---|---|---|---|
| Replication Controller Details | |||
| Name | Name of the Replication Controller. | | |
| Project Name | Name of the project in which the replication controller is created. | | |
| Desired Replica | Desired Replica specifies the number of pods that needs to be replicated. | | |
| Running Replica | Running Replica displays the number of replicas that are currently running. | | |
| Available Replica | Available replica specifes the number of application replicas that are available to your users. | | |
| Actions | You can perform 2 actions-
| | |
| Replication Set Details | |||
| Name | Name of the Replication Set. | | |
| Project Name | Name of the project in which the replication set is created. | | |
| Desired Replica | Desired Replica specifies the number of pods that needs to be replicated. | | |
| Running Replica | Running Replica displays the number of replicas that are currently running. | | |
| Available Replica | Available replica specifes the number of application replicas that are available to your users. | | |
| Actions | You can perform 2 actions-
| | |
Jobs
| Parameter | Description | Supported in SSH mode | Supported in Prometheus |
|---|---|---|---|
| Name | Name of the job. | | |
| Project Name | Name of the project in which the job is created. | | |
| Parallelism Replica | Parallelism Replica specifies the number of pod replicas running in parallel that should execute a job. | | |
| Desired Replica | Desired replica specifies the number of concurrently running pods that should execute a job. | | |
| Successful Replica | Displays the number of successful pod count | | |
| Actions | You can perform 2 actions-
| | |
| Job Start Time | Time at which the job was started. | | |
| Job Completion(Min) | Time taken to complete the job. | | |
Persistent Volume Claims
| Parameter | Description | Supported in SSH mode | Supported in Prometheus |
|---|---|---|---|
| PVC Name | Name of the PVC. | | |
| Project Name | Name of the project in which the persistent volume claim is created. | | |
| PVC Access Mode | Mode through which PVC can be accessed. | | |
| PVC Storage Class | Mode of storage - Automatic or Manual. | | |
| PVC Status | Status of the PVC. | | |
| PV Name | Name of the persistent volume. | | |
| PVC Request(GiB) | Amount of PVC requested in GiB. | | |
| PV Capacity(GiB) | Total capacity of PV in GiB. | | |
| PVC Created Time | Time at which the PVC was created. | | |
| PVC Usage | Storage space currently used by the Persistent Volume Claim. | | |
| PVC Free Space | Available free storage in the Persistent Volume Claim. | | |
| PVC Usage % | Percentage of storage utilized in the Persistent Volume Claim. | | |
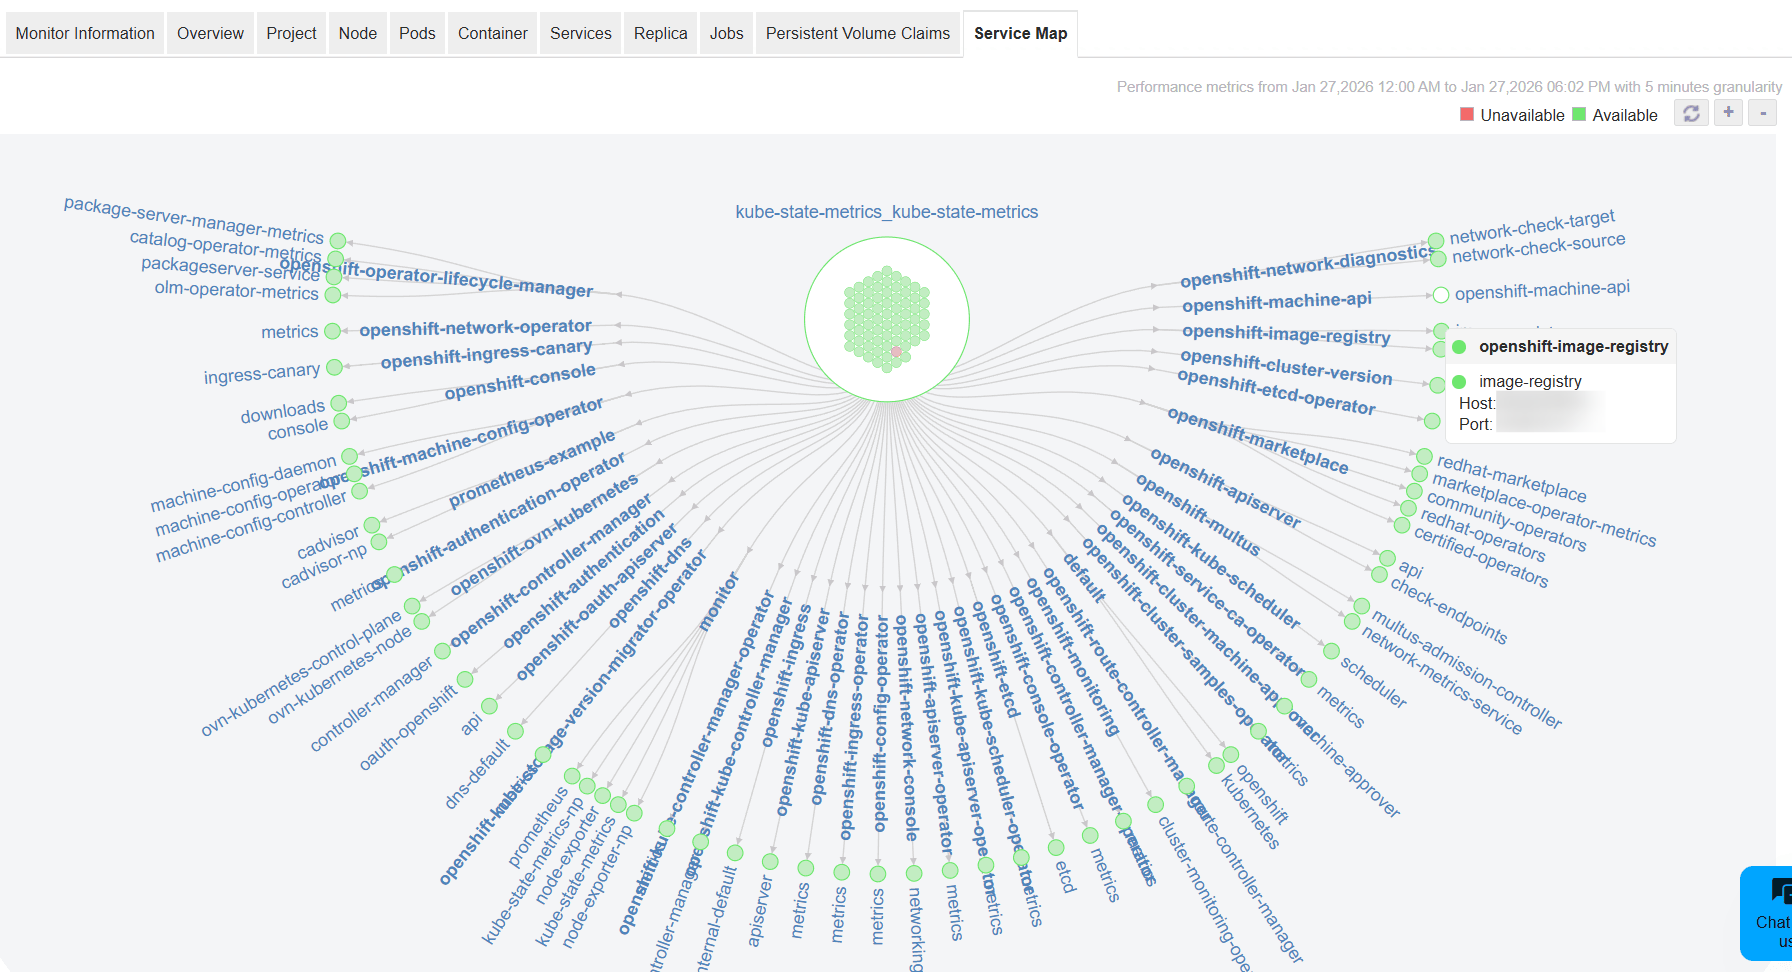
Service Map
- Displays a graphical topology view of the OpenShift cluster, showing services and their relationships across namespaces.
- The cluster is represented as a central node, with services branching out to depict their logical connectivity.
- Green indicates that a service is available, while red indicates that it is unavailable.
- Selecting a service displays additional details such as the host IP address and port information.