Summary Report
The Summary Report page provides an overview of all the activce cost accounts in CloudSpend.
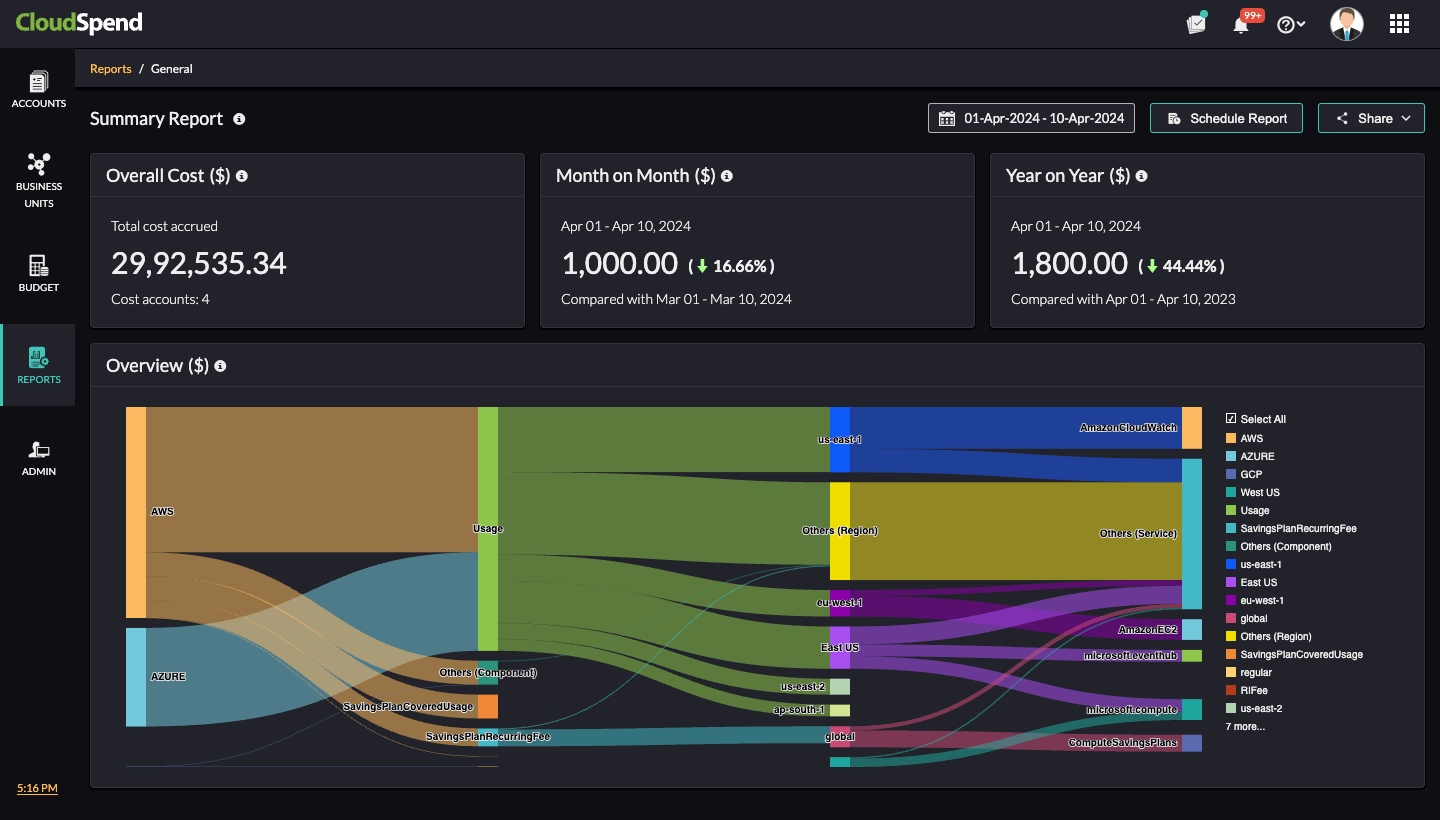
Interpreting the Summary Report
You can view the following details in the Summary Report page:
Overall Cost
The Overall Cost section dispays the total cloud cost incurred by all cost accounts within a specified date range.
Month on Month
The Month on Month view displays the selected month's cloud cost. It also compares cloud spending for the selected month's date range with the previous month's corresponding date range, showing the difference as a percentage. A red up arrow means your spending increased, while a green down arrow indicates a decrease.

Let's say your cloud bill for March 1-10 was $1,200 and your cloud bill for April 1-10 was $1,000. The percentage difference displayed in the Month on Month section is calculated as:
Month on Month (%)=((Selected month's cloud cost - Previous month's cloud cost)/Previous month's cloud cost)*100
In the above example,
Month on Month (%) = ((1000-1200)/1200)*100 = -16.6
Thus, it denotes that your cloud cost decreased by 16.6% from March to April.
Year on Year
The Year on Year view displays the selected month's cloud cost for a particular year. It also compares cloud spending for the selected year's monthly data and the corresponding data point from the previous year. This shows the difference as a percentage. A red up arrow means your spending increased, while a green down arrow indicates a decrease.

Let's say your cloud bill for April 1-10, 2023 was $1,800 and your cloud bill for April 1-10, 2024 was $1,000. The percentage difference displayed in the Year on Year section is calculated as:
Year on Year (%) = ((Cloud cost for the selected month of the year - Cloud cost for the corresponding month of the previous year)/Cloud cost for the corresponding month of the previous year)*100
In the above example,
Year on Year (%) = ((1000-1800)/1800)*100 = -44.4
Therefore, your Year on Year cloud cost percentage difference in April 1-10, 2024 when compared to April 1-10, 2023 is 44.4%. That is, you have saved 44.4% of your cloud bill.
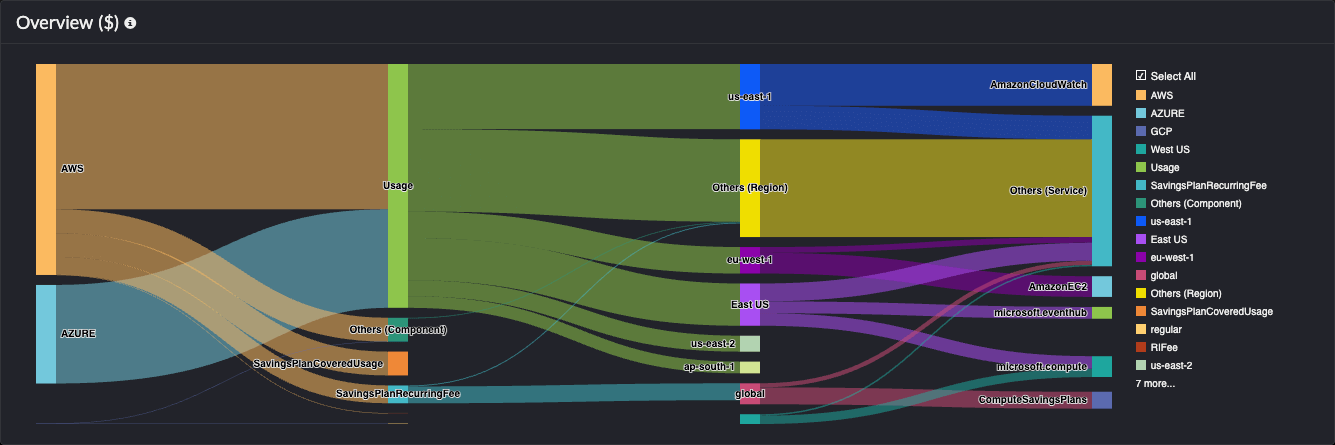
Overview
The Overview section displays a detailed breakdown of cloud costs in a chart form for entities such as region, services, and other components.
Overall Cloud Cost
The Overall Cloud Cost section provides a detailed cloud cost information for each cloud type either in tabular or pie chart format. You can view specific details such as Cost, Spending (%), Month on Month (%), and Year on Year (%) for each cloud type.

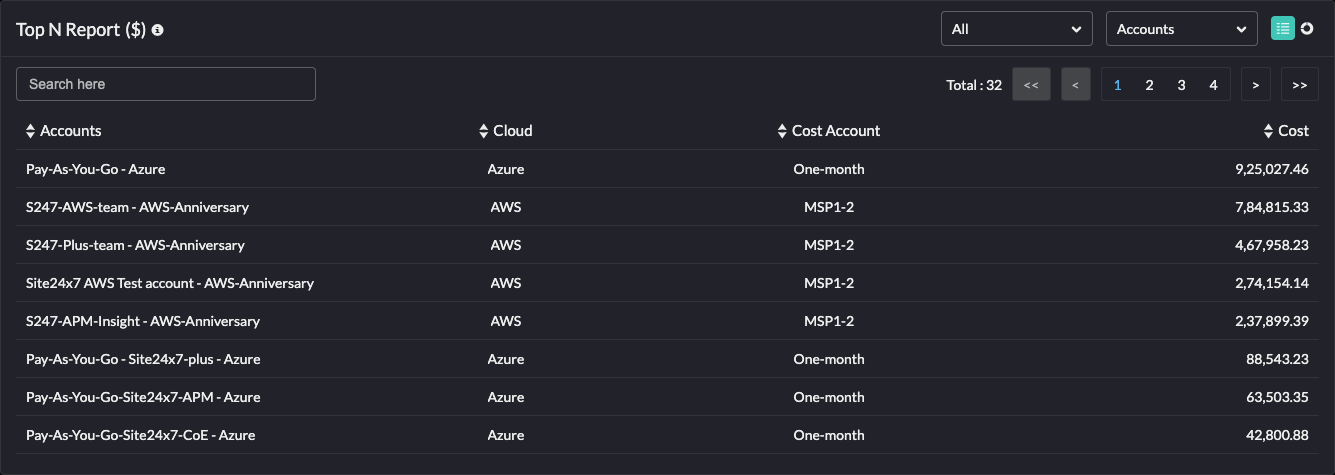
Top N Report
The Top N Report section provides the details of the highest cost accruing resources. You can filter the Top N Report based on cloud type (AWS, Azure, GCP), Accounts, Region, Service, Resource Group, and Tags.
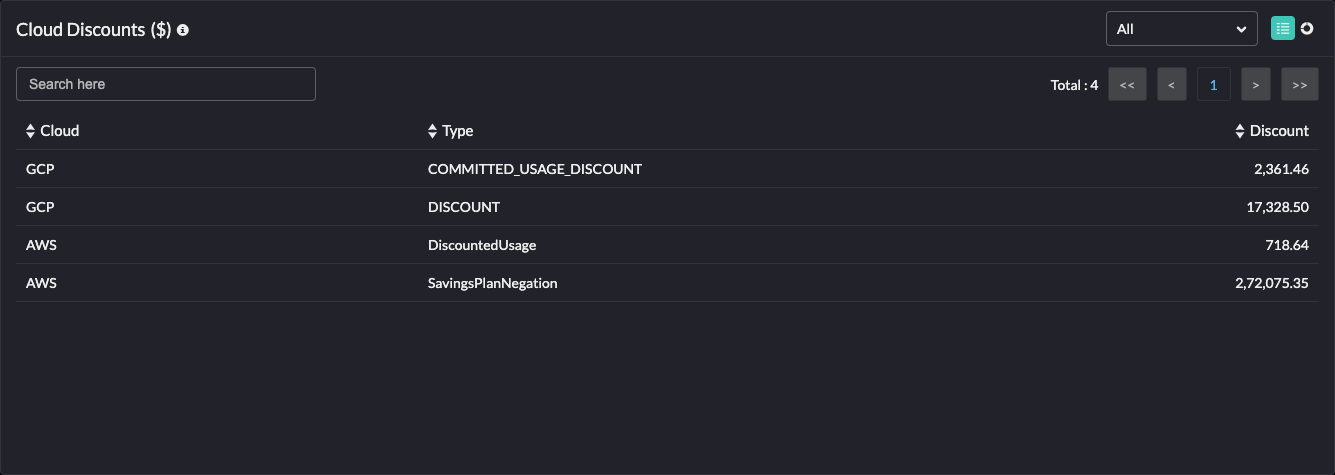
Cloud Discounts
The Cloud Discounts section shows the various discounts applied for each cloud type. It includes cloud discounts such as Credits, Refund, Bundled Discount, Savings Plan Negation, Discounted Usage, and Committed Use Discounts.
Viewing Summary Report
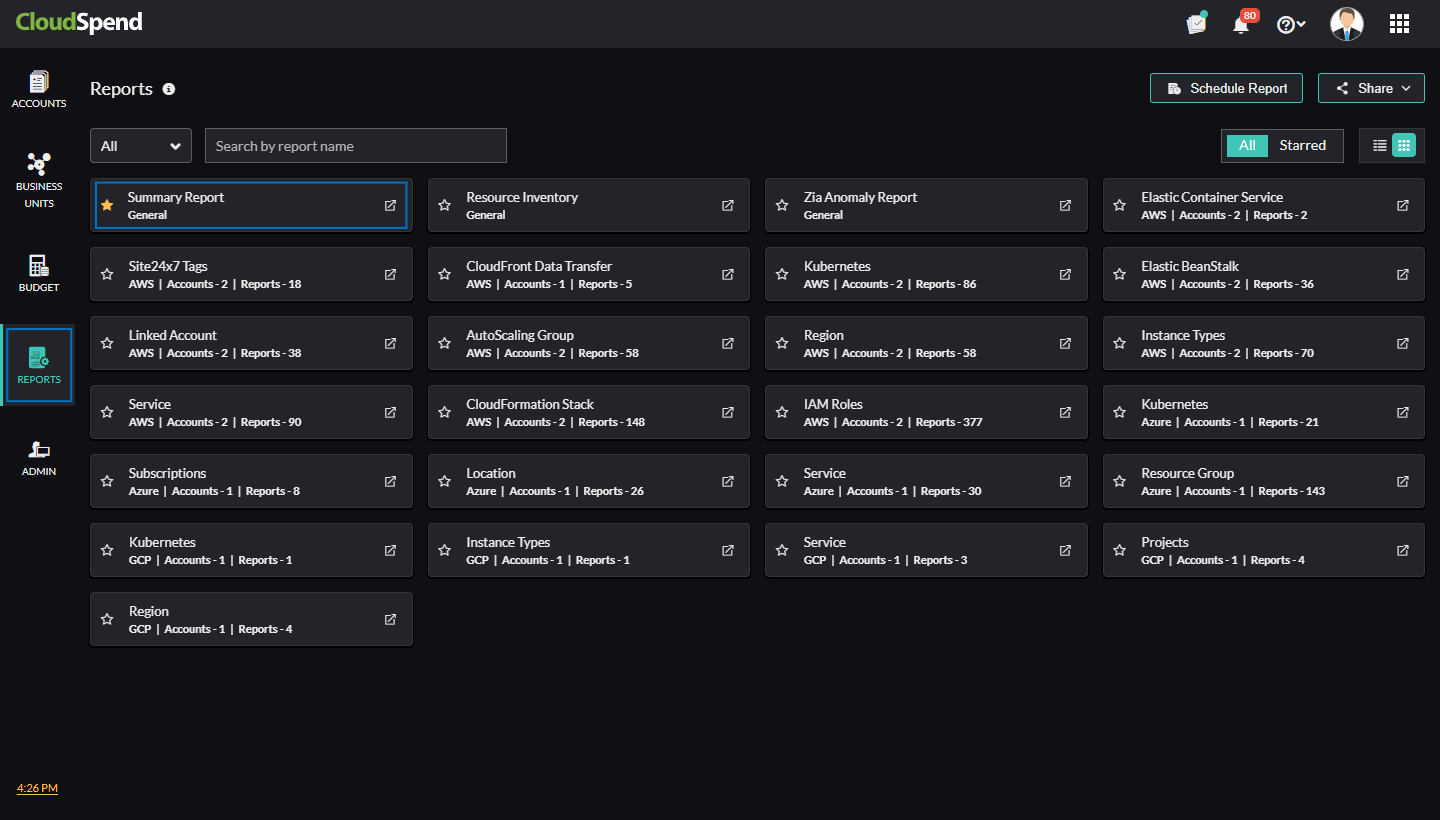
- Go to CloudSpend > Reports.
Click Summary Report.
Related Topics