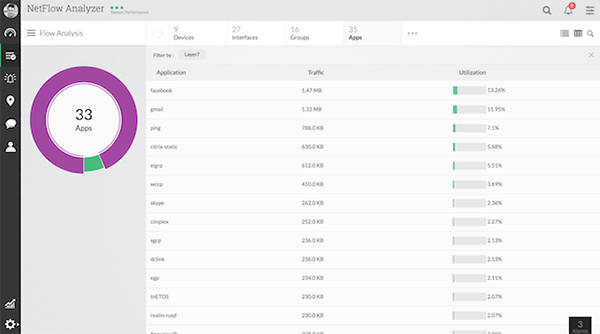
Vea información detallada sobre su ancho de banda para obtener datos sobre el tráfico de la red en tiempo real. Identifique qué aplicaciones tienen el mayor consumo de ancho de banda, las principales conversaciones de la red y el uso del tráfico en un periodo de tiempo particular.
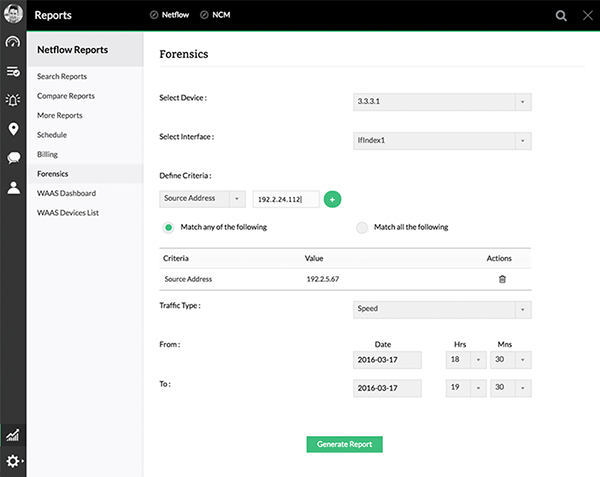
La característica de análisis forense permite visualizar parámetros específicos, tales como el tráfico, aplicaciones, dirección de origen, dirección de destino y DSCP en cualquier momento dado. Examine detalladamente el tráfico de cualquier elemento particular basándose en datos sin procesar obtenidos de informes forenses para detectar y resolver problemas de red con mayor rapidez.
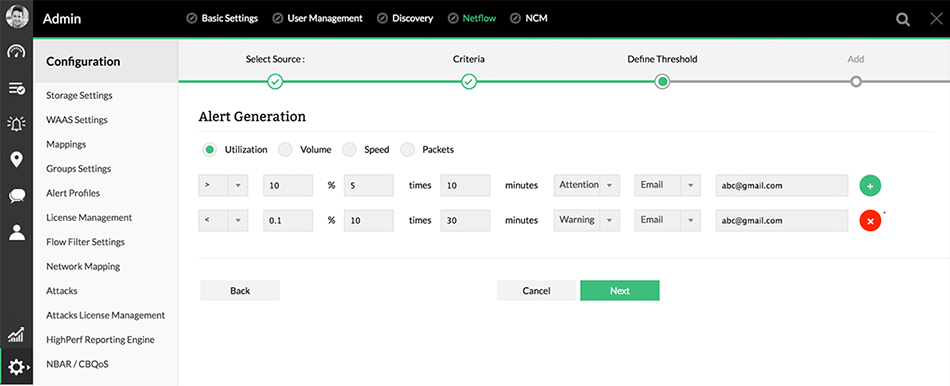
Reciba notificaciones cuando el uso del tráfico exceda sus ajustes predefinidos de umbral. Cree y gestione sus umbrales de forma eficiente con la ayuda de perfiles de alertas para grupos de IP, interfaces y grupos de interfaces. Defina alertas según el tráfico de ENTRADA, tráfico de SALIDA o ambos. Reciba alertas cuando un enlace deje de funcionar o si no hay flujos por más de 15 minutos. Puede configurar los valores del umbral según el uso, duración y frecuencia:
Uso: Ajuste límites para el uso del ancho de banda basándose en grupos de IP u otros grupos de dispositivos.
Duración: Genere alertas cuando se cometan violaciones del umbral durante periodos específicos de tiempo.
Frecuencia: Ajuste la cantidad de veces que se permite exceder el umbral de uso de tráfico antes de que se genere una alerta.
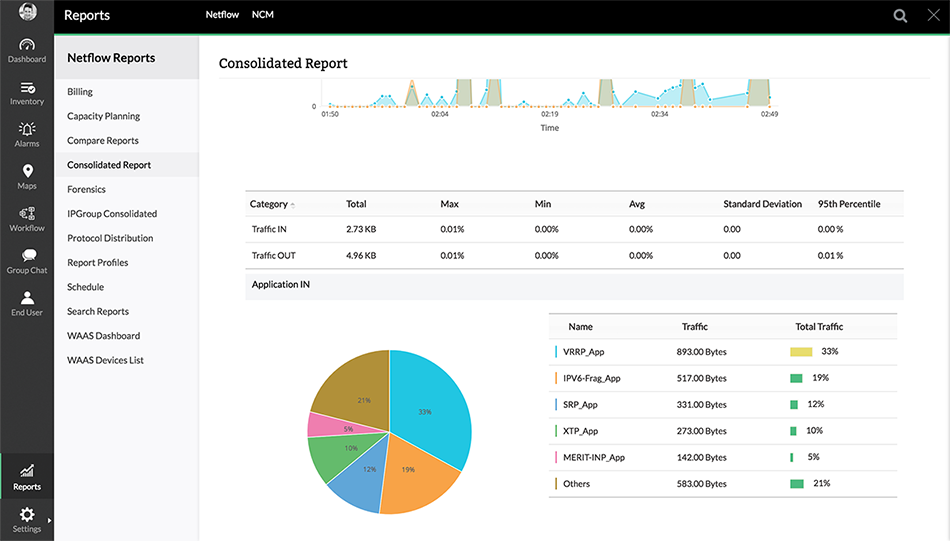
Analice el uso del ancho de banda según aplicaciones, usuarios y conversaciones mediante un amplio conjunto de informes de análisis de ancho de banda. Los detalles minuciosos sobre el uso del ancho de banda le dan más información con respecto a los tipos de aplicaciones que usan el ancho de banda, por lo que puede detectar congestiones en la red y examinar detalladamente su causa raíz.
Los informes del análisis del ancho de banda de la red de OpManager Plus le ayudan a: