Customize Dashboard Views
Last updated on:
In this page
- Overview
- Log sources
- Filtering data by time range
- Adding a new tab
- Adding a new widget to a tab
- Editing, deleting, and reordering tabs
- Reordering and resizing widgets
- Editing and deleting widgets
- Viewing the dashboard in full screen mode
- Viewing a widget in full screen mode
- Refreshing the dashboard and widgets
- Changing refresh interval
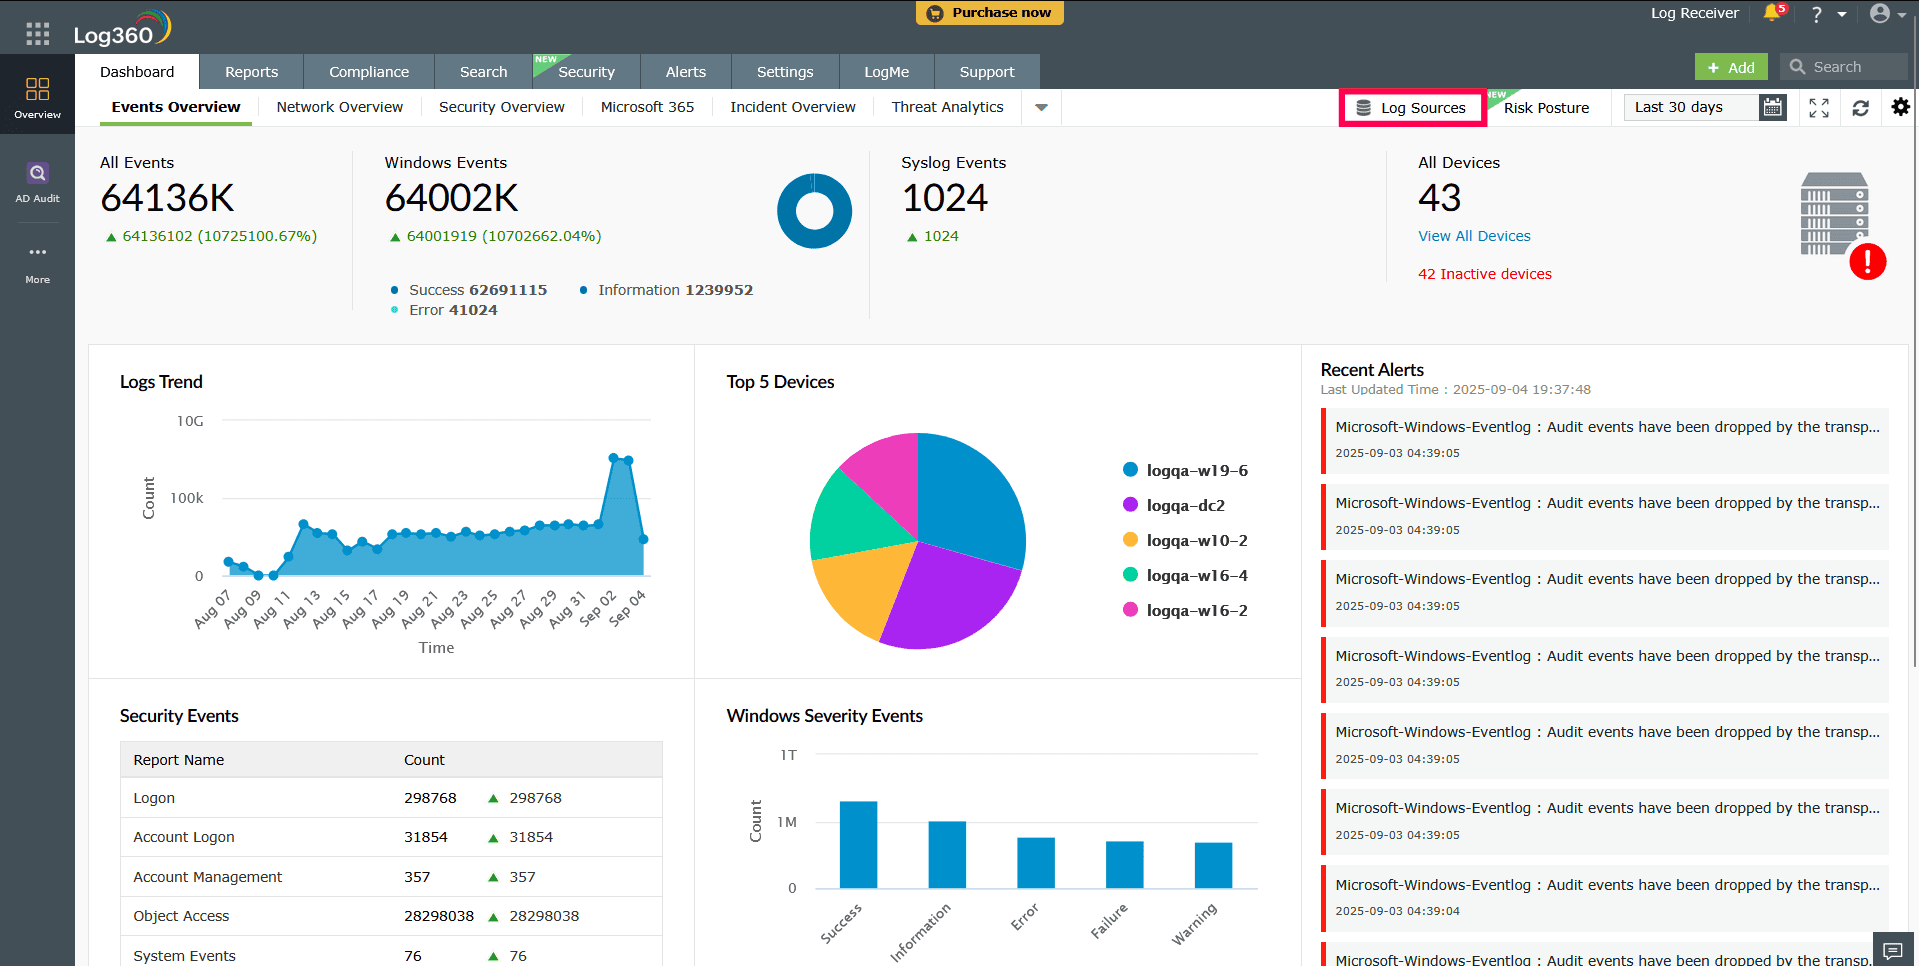
- Configuring Embed links for dashboard and widgets
- Managing Embed Links
Overview
Customizing the ManageEngine Log360 dashboard allows you to tailor the view to focus on the data most relevant to your log sources. You can add, remove, or rearrange tabs and widgets, and adjust layout settings to create a personalized dashboard that enhances monitoring efficiency and visibility. The dashboard displays data gathered from various log sources. This page outlines the available customization options and explains how to configure the dashboard to suit your specific monitoring requirements.
Log Sources
In the Log Sources section, you can view the list of devices, applications, and monitored files from which the data is being collected.
- Click Log Sources in the top-right corner of the dashboard.
- In the Log Sources page, four sub-tabs will appear:
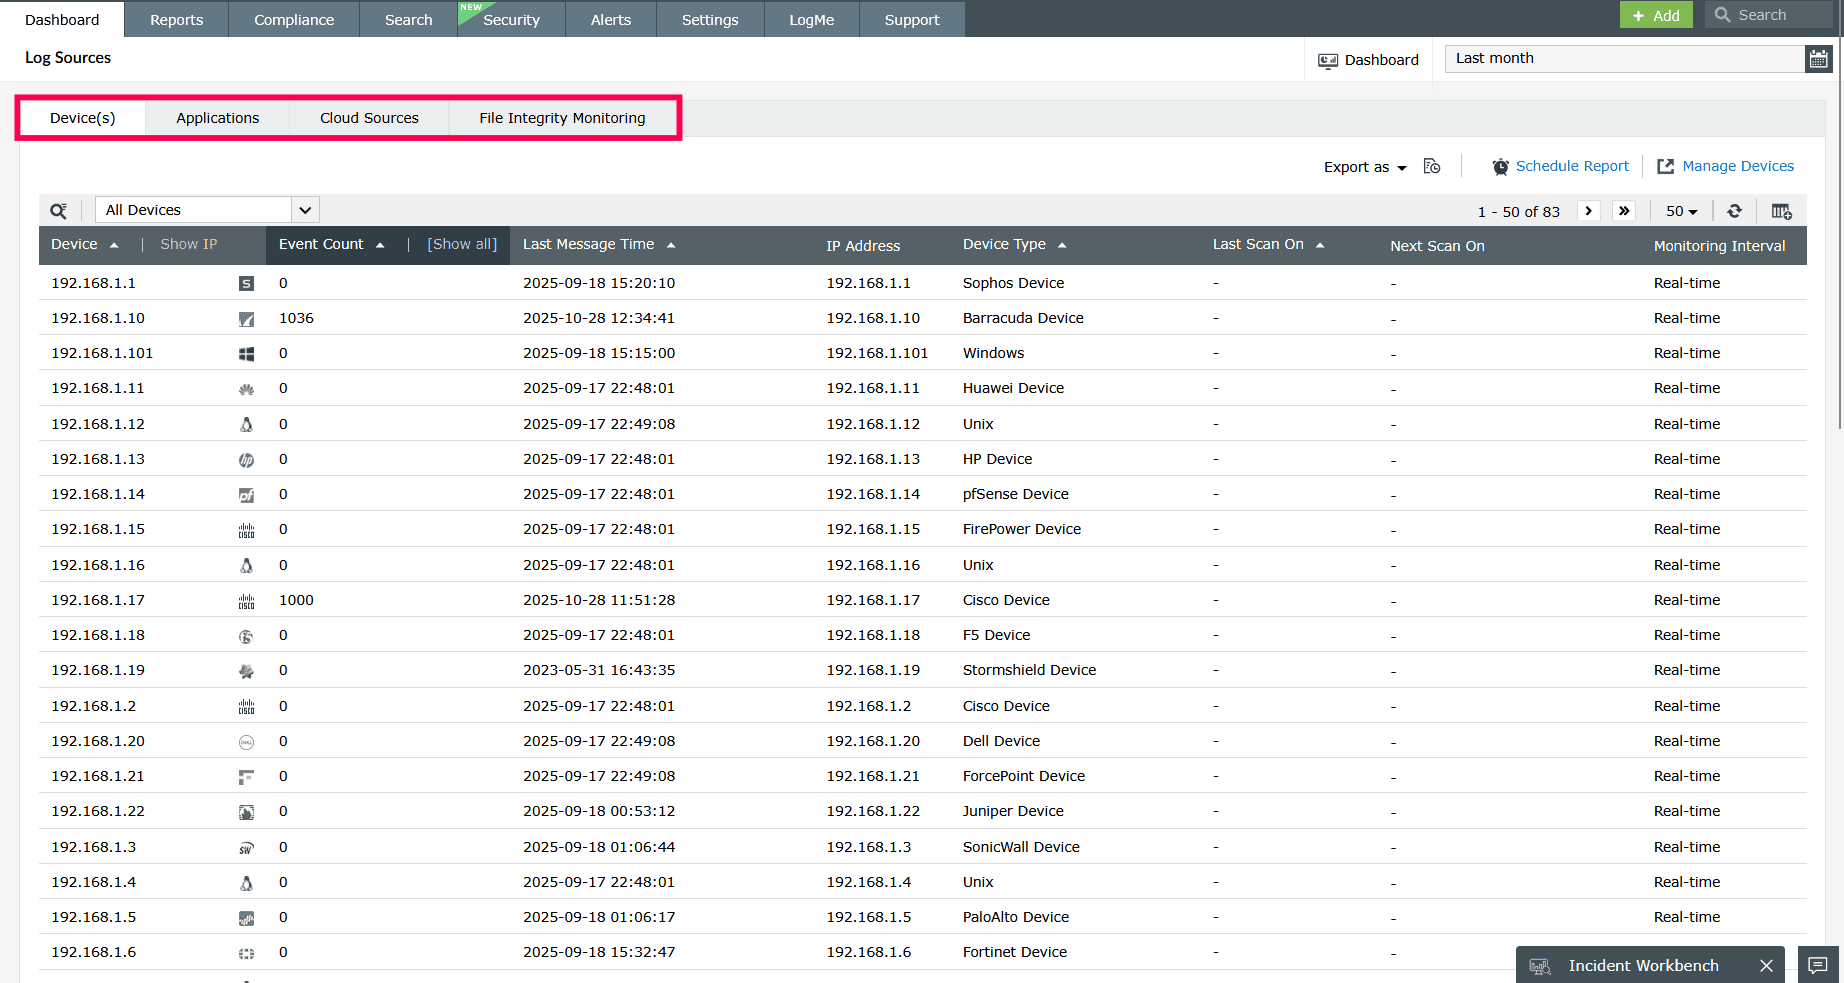
Figure 2: Sub-tabs of Log Sources
Devices
Follow these steps to view and manage the devices configured for log collection:
- In the Device(s) tab. Use the filter drop-down at the top to choose one of the following options:
- All Devices: Displays all configured devices.
- Active Devices: Shows devices that are currently sending logs.
- Enabled Devices: Displays devices that are currently enabled for log collection.
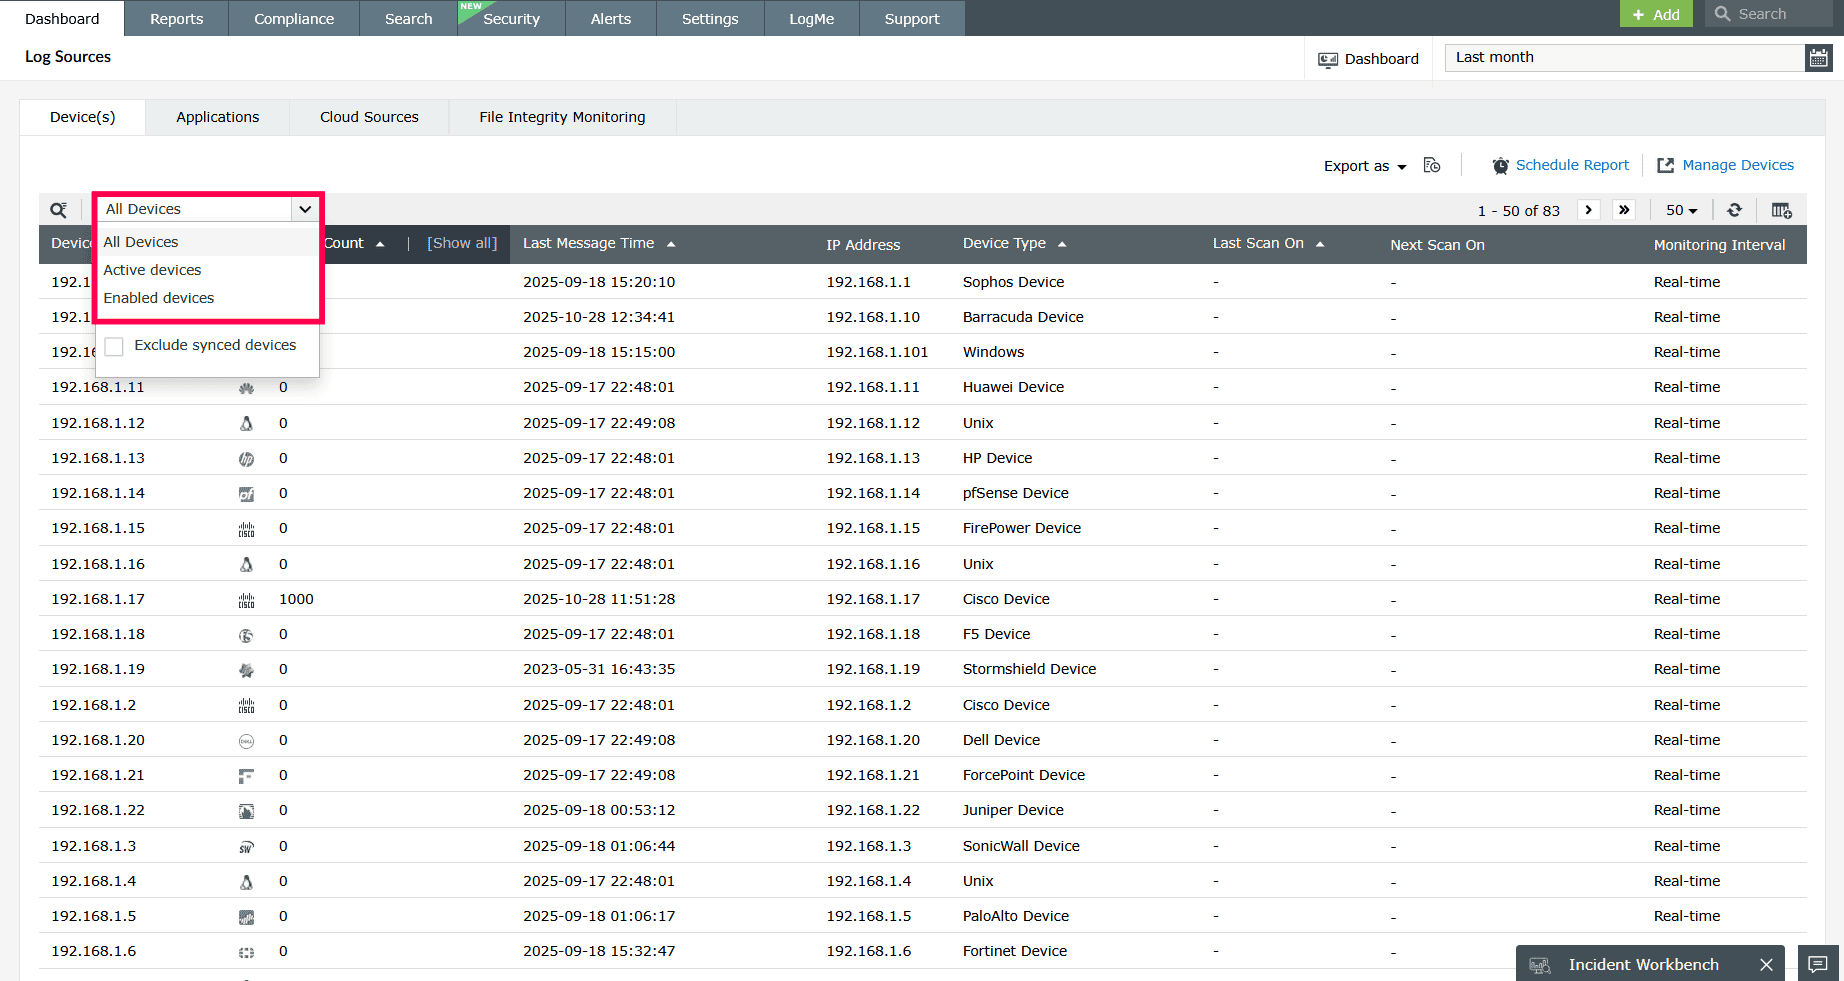
Figure 3: Selecting devices - You can also select the checkbox Exclude Synced Devices to hide devices that are already synchronized with other Log360 components.
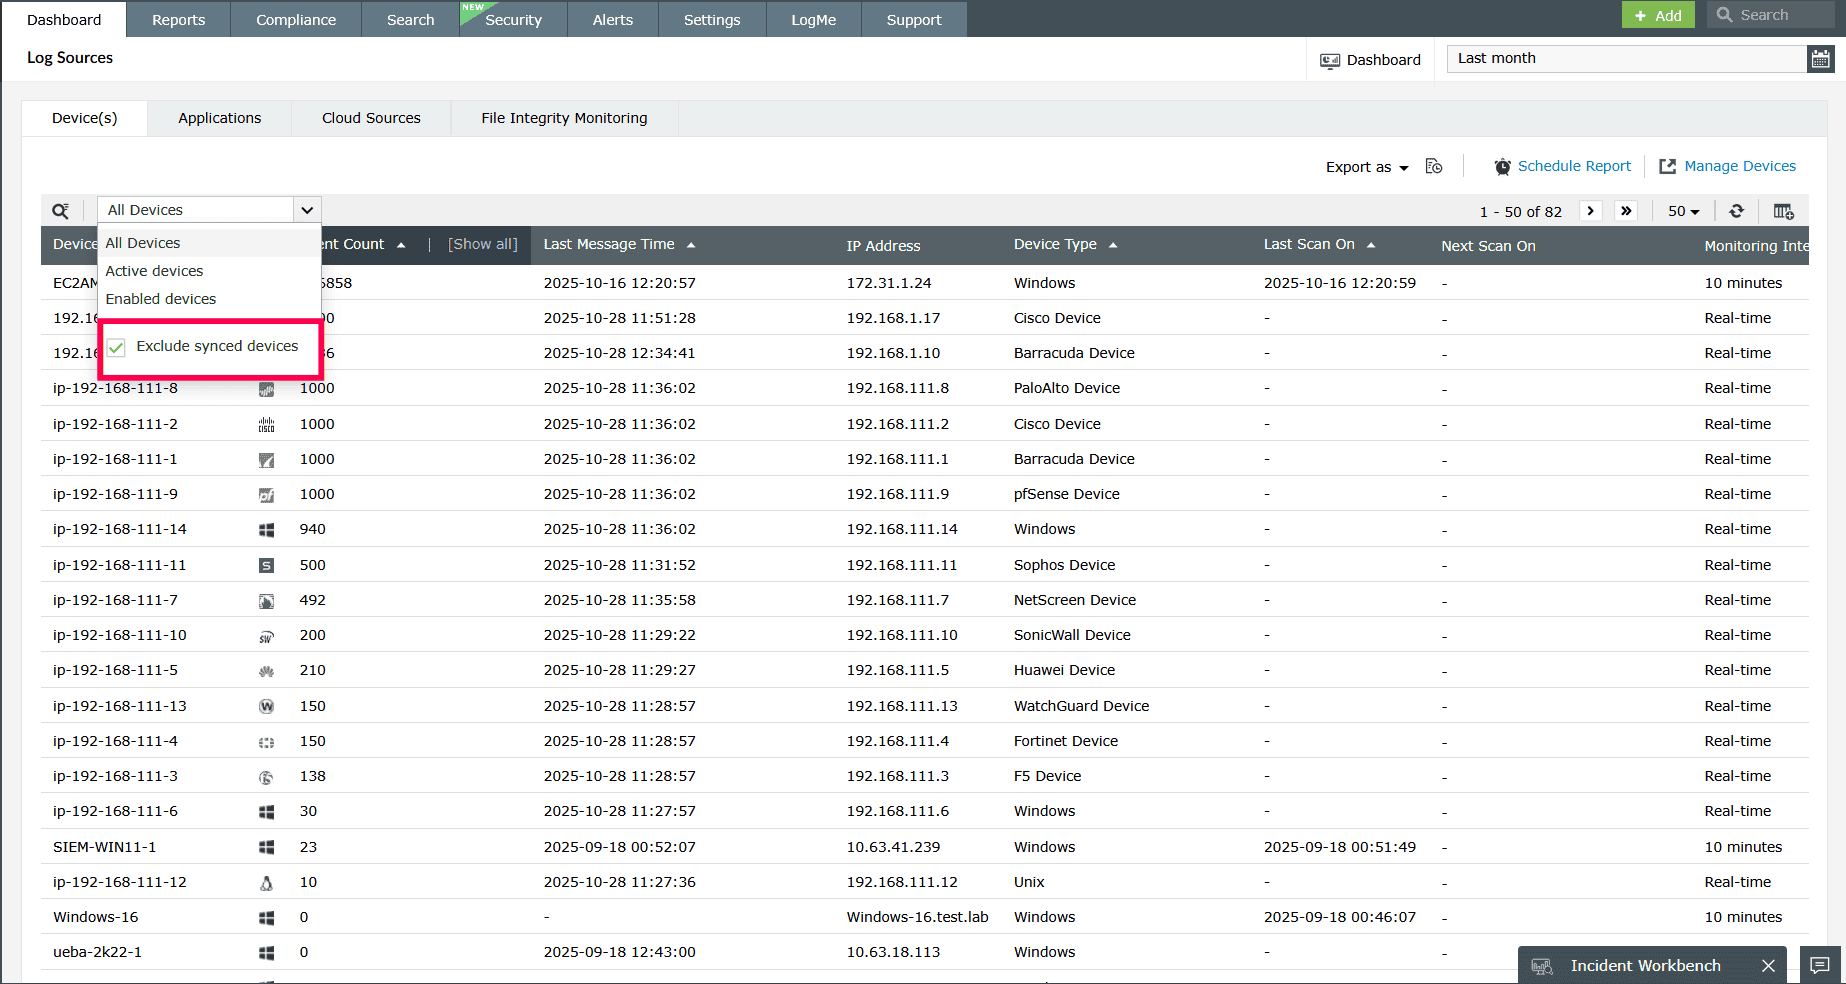
Figure 4: Excluding synced devices - Click the
 icon to add or remove additional columns from the table view as needed.
 - Select the checkbox next to the columns you want to add, and then click Apply to update the table view.
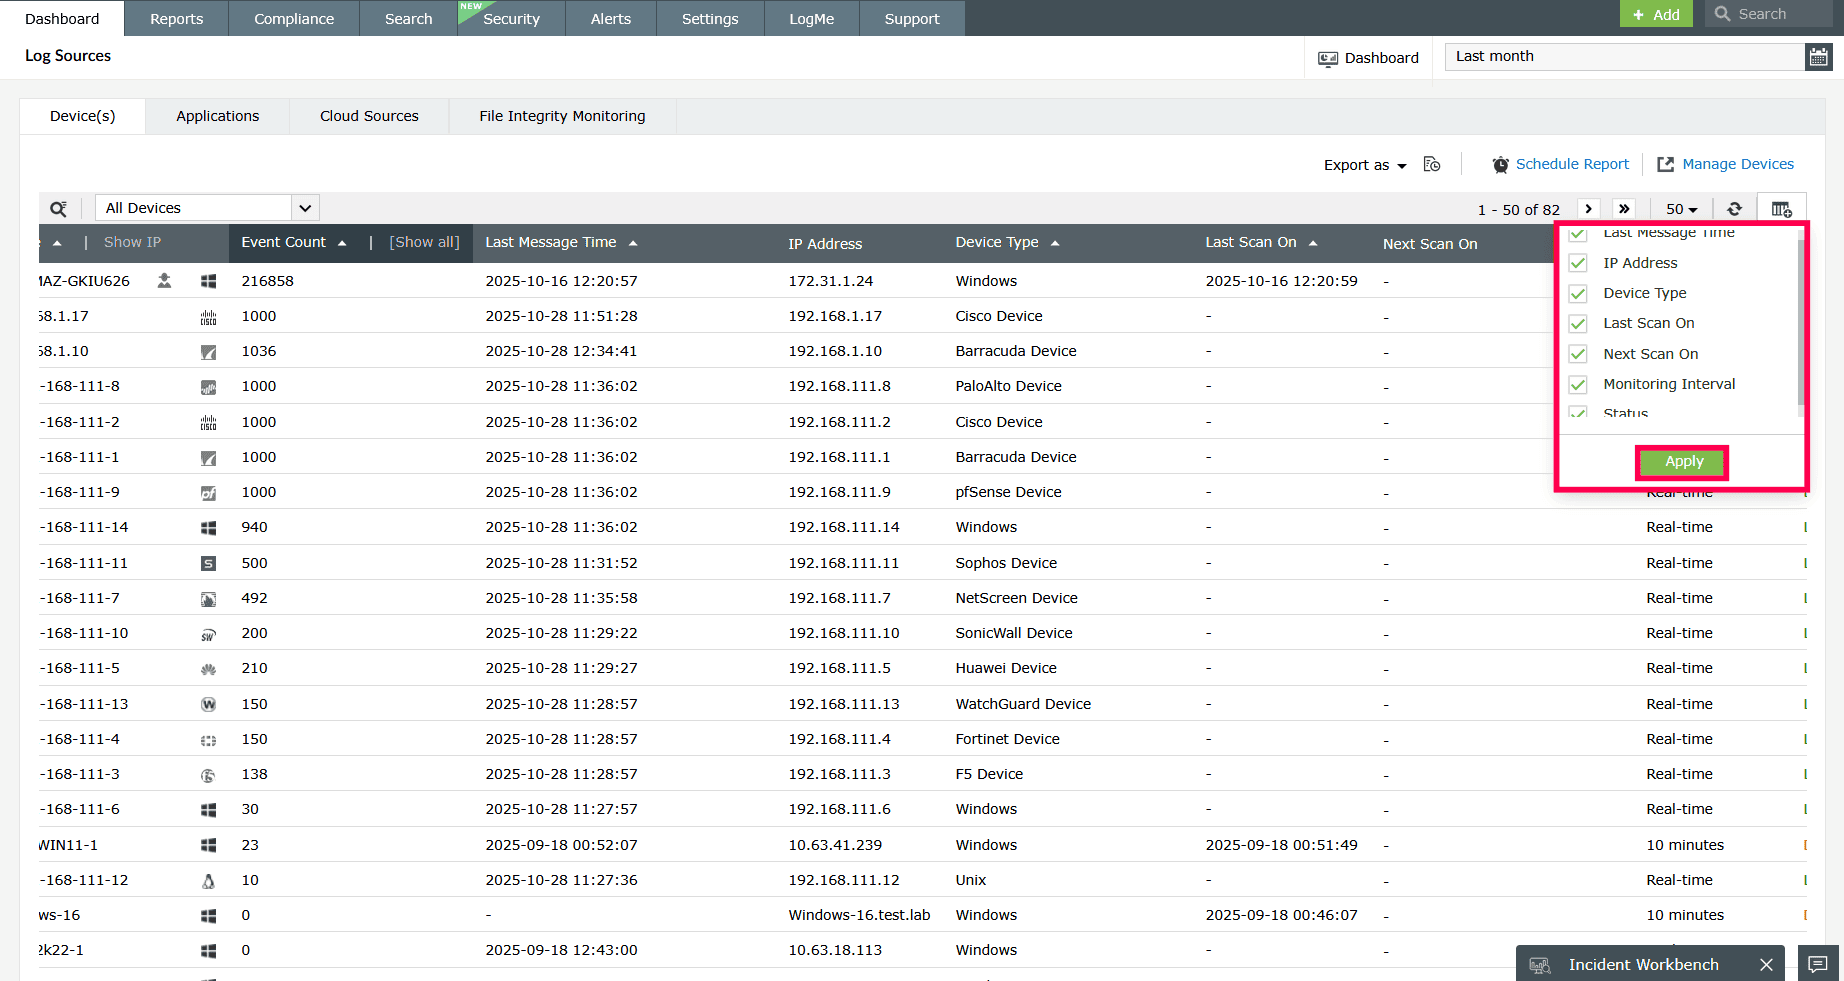
Figure 5: Adding columns to the table - The table includes the following fields:
- Device: Displays the name of the device or IP address.
- Event Count: Shows the total number of events received from the device. Click Show All view the following event details categorized by severity.
- Error: Indicates the number of error logs generated from the device.
- Failure: Displays the number of failure-related logs.
- Warning: Shows the count of warning-level logs from the device.
- Others: Displays logs that do not fall under error, failure, or warning categories.
NOTE: Log severity levels vary based on the log source type. Common severity levels that may appear under Others include:- Syslog severity levels: Emergency, Alert, Critical, Notice, Information, Debug
- Windows severity levels: Information and Success.
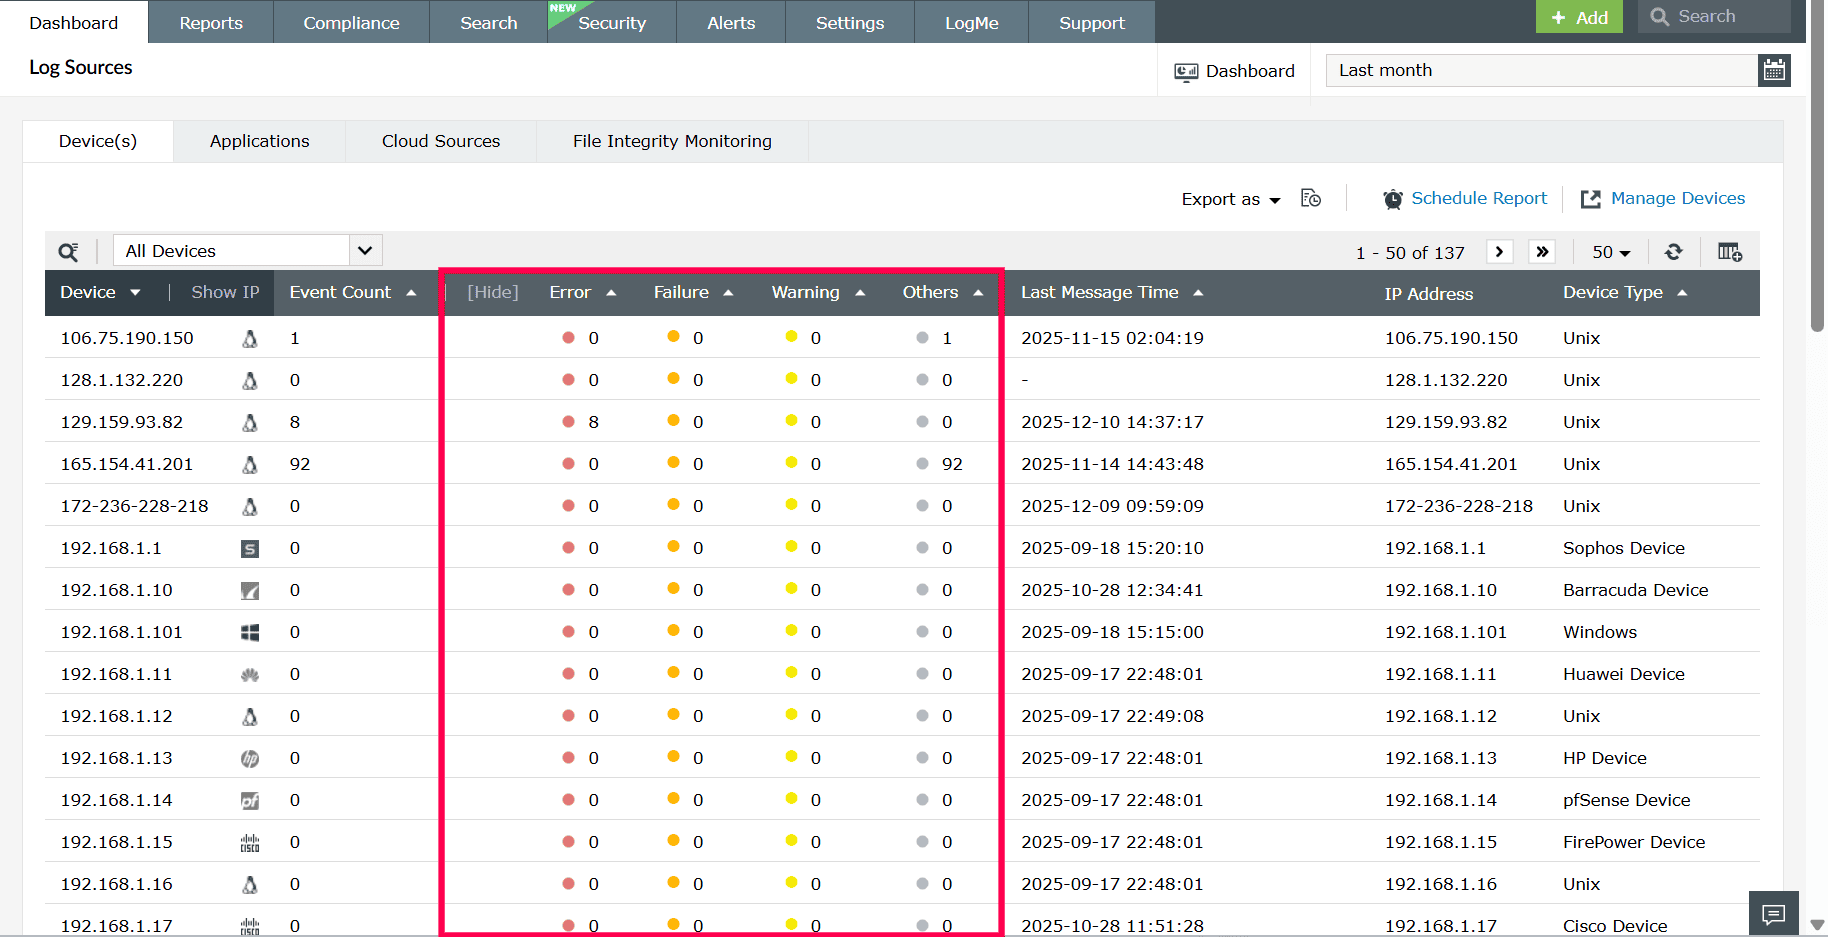
Figure 6: Viewing events categorized by severity - Last Message Time: Indicates the timestamp of the most recent log message received from the device.
- IP Address: Displays the IP address associated with the device.
- Device Type: Shows the operating system or type of device
- Last Scan On: Displays the date and time when the last device scan was performed.
- Next Scan On: Displays the scheduled time for the next scan, if applicable.
- Monitoring Interval: Indicates whether the device is monitored in real time or at specific intervals.
- Status: Displays the current state of log collection for each device.
- Click Show Name to view the device name.
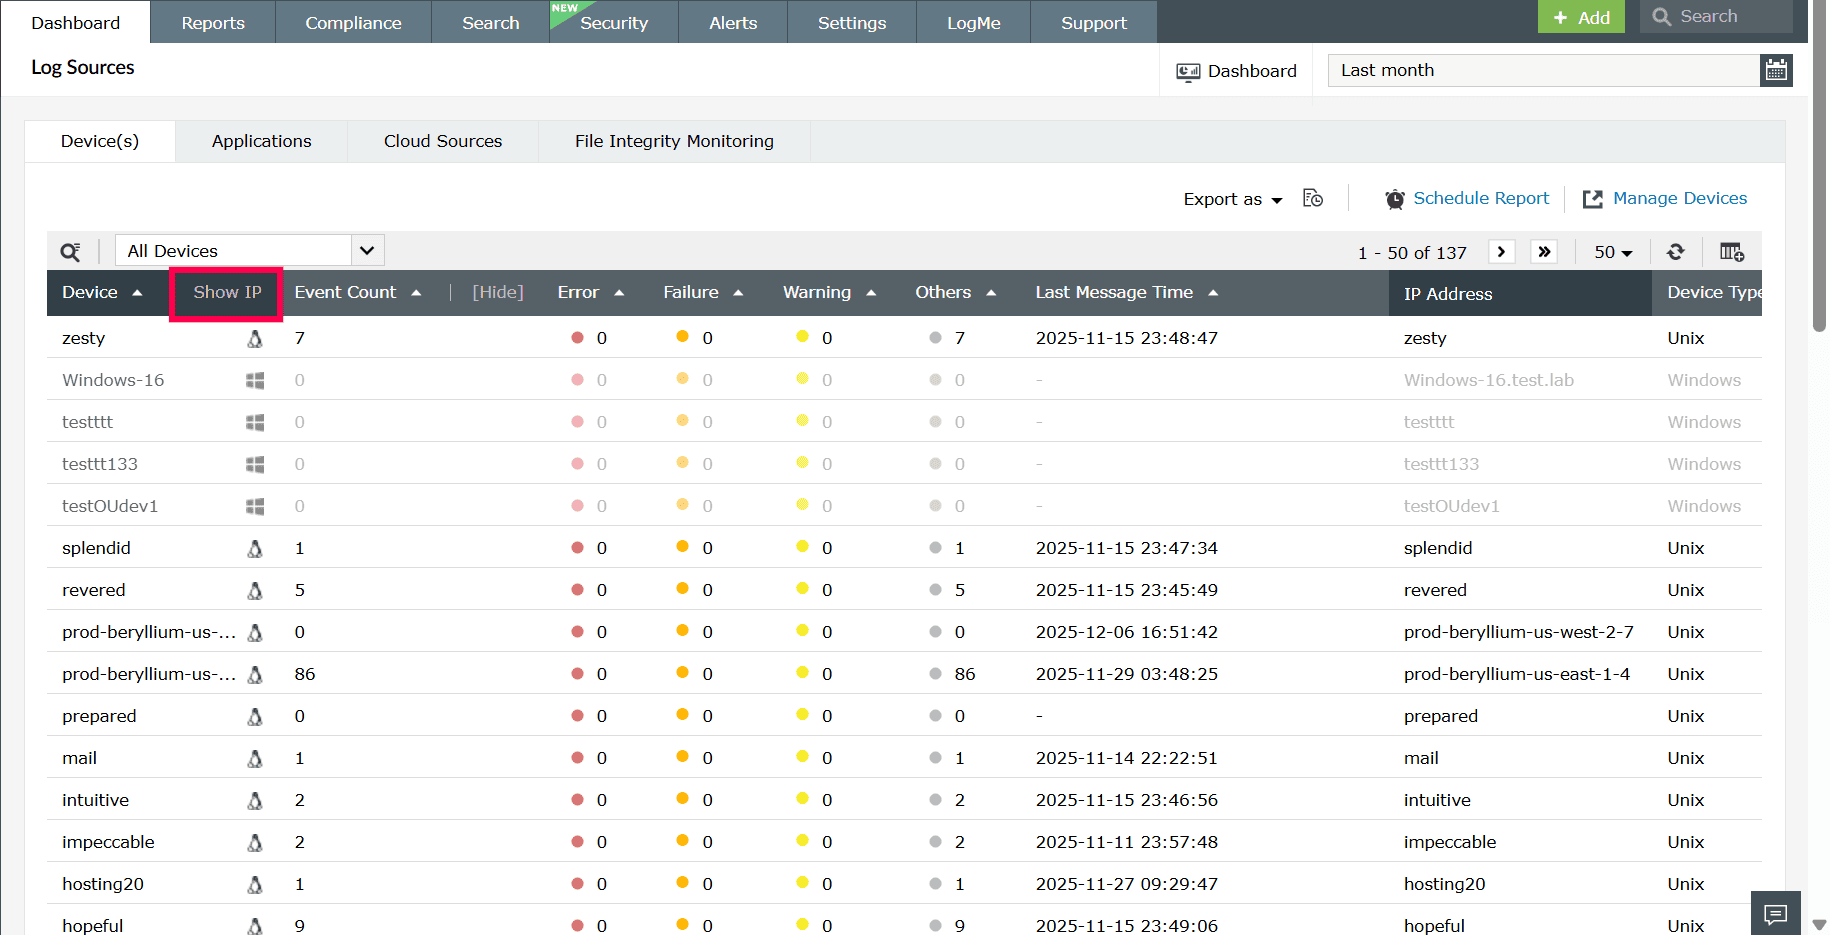
Figure 7: Viewing device name - You can also click Show IP to display the device’s IP address instead.
Figure 8: Viewing IP - You can also click Hide to remove the event count categorized by severity.
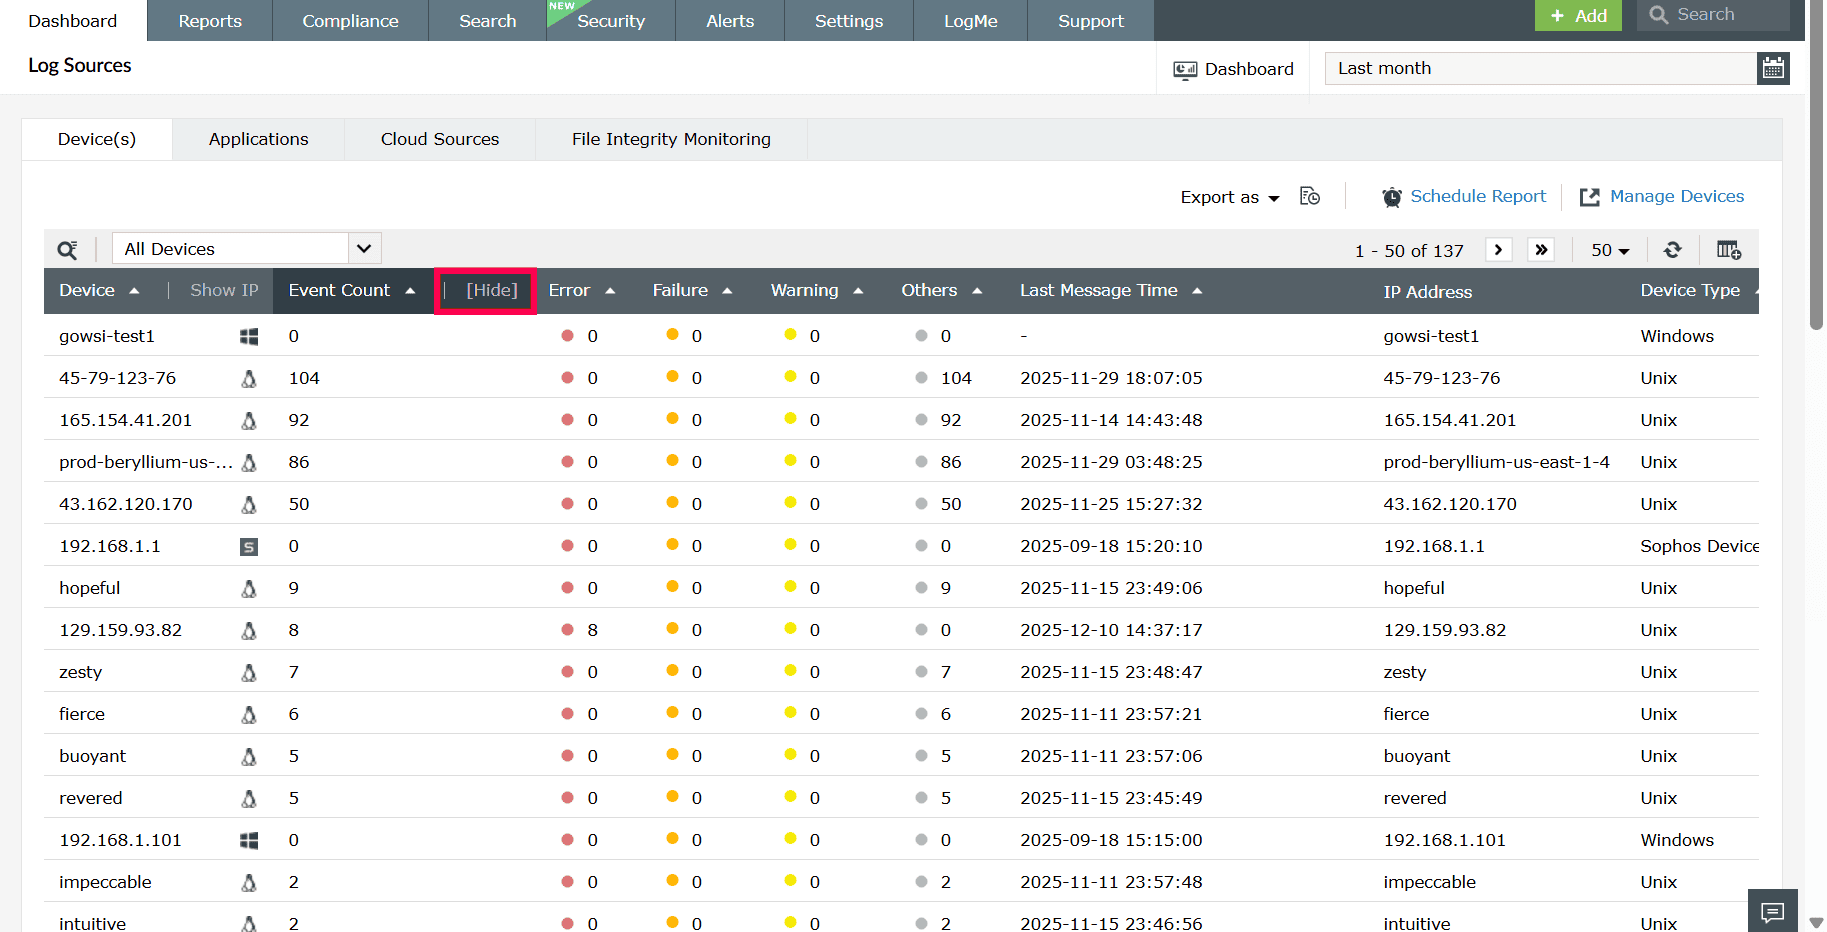
Figure 9: Hiding event count categorized by severity - Use the Search icon to quickly locate a specific device by name or IP address.
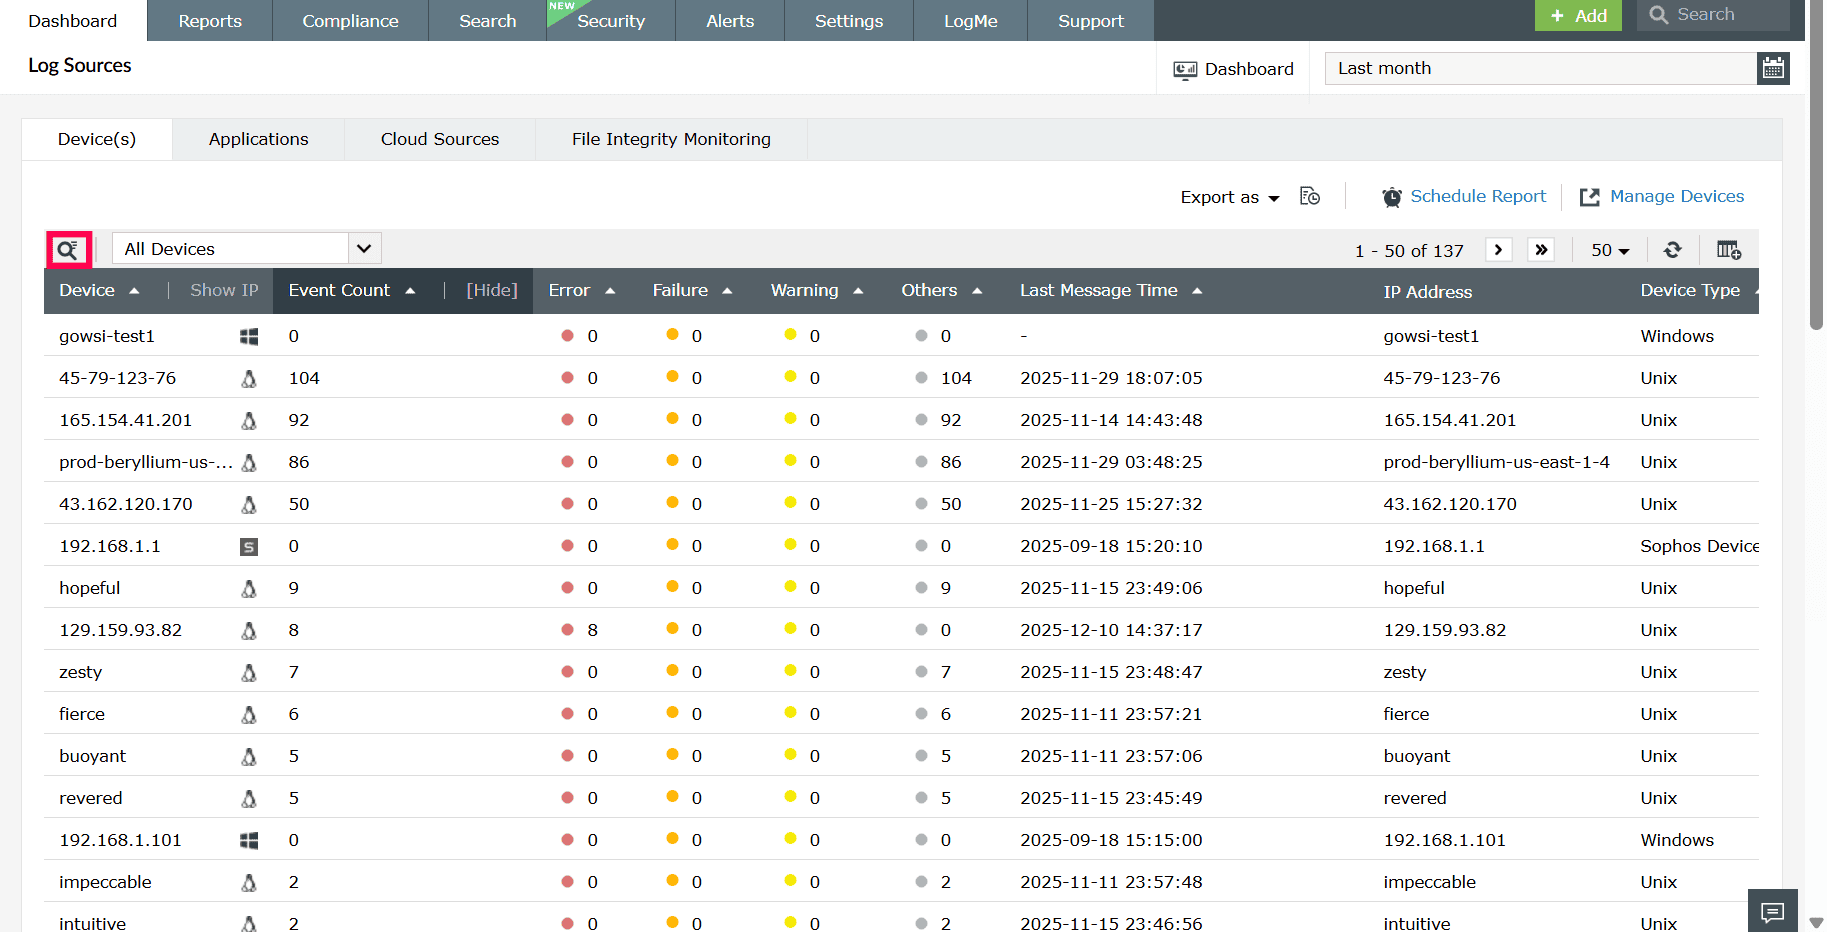
Figure 10: Locating a specific device - Hover next to the Last Message Time column to view the
Last 10
Events option.
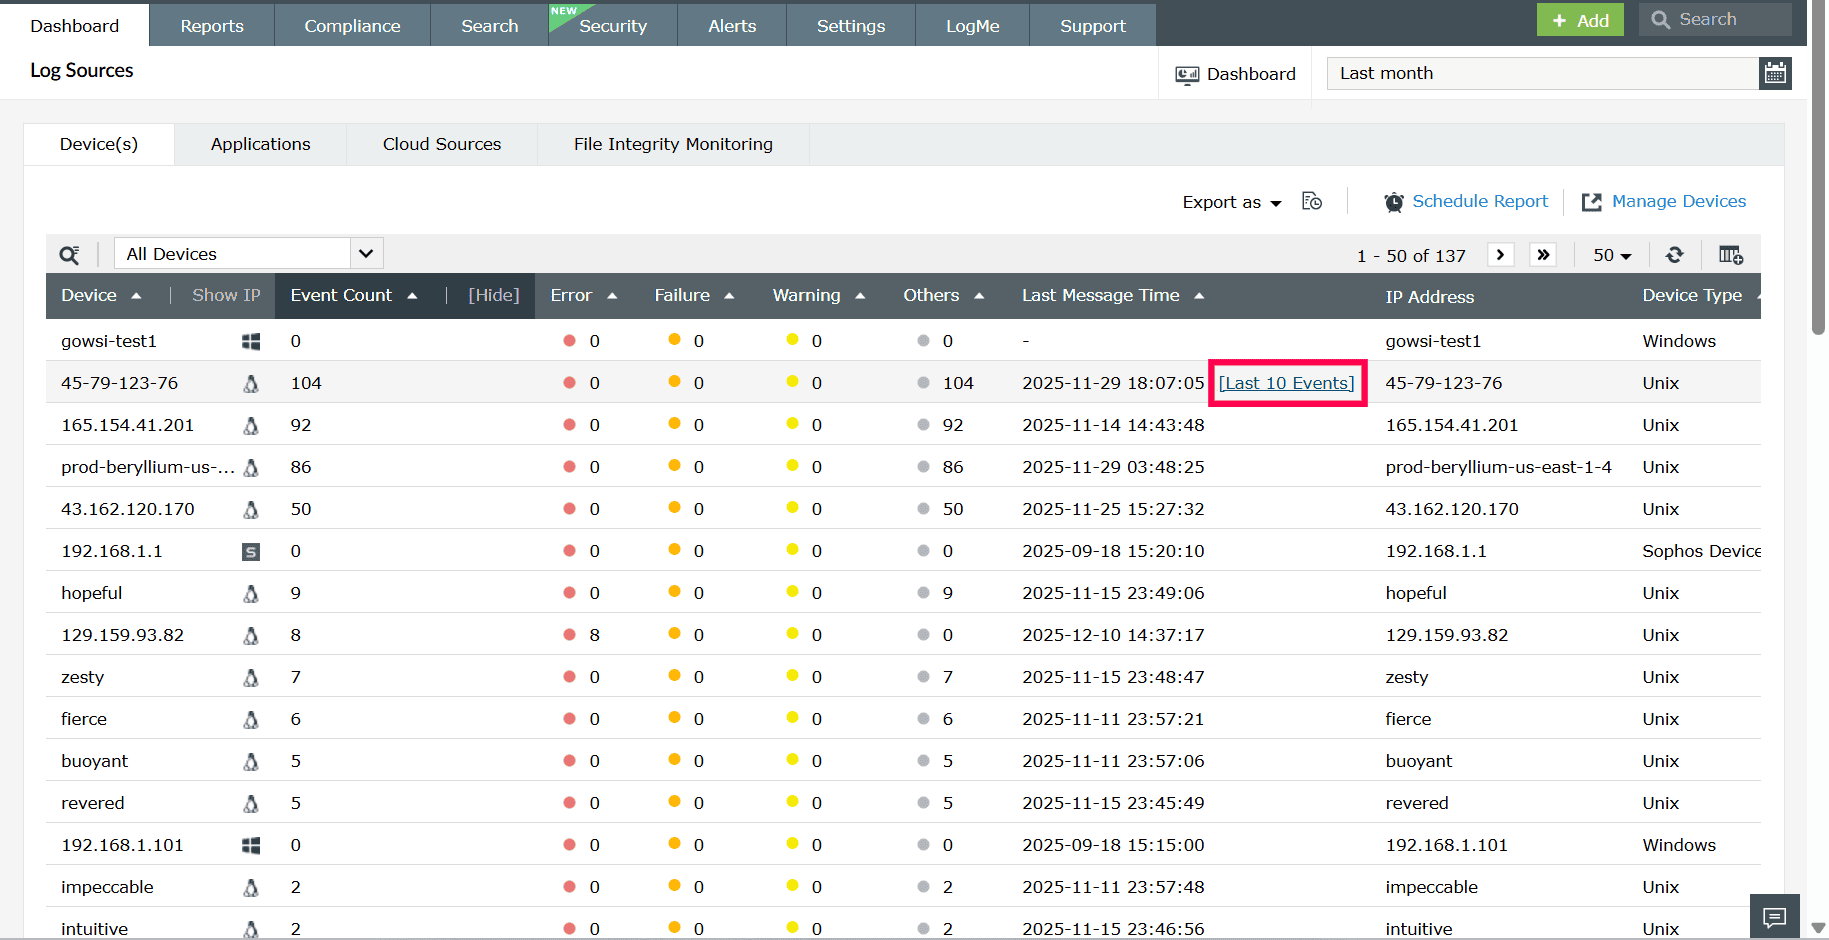
Figure 11: Viewing last 10 events - The Last 10 Events displays the ten most recent events received from the selected device.
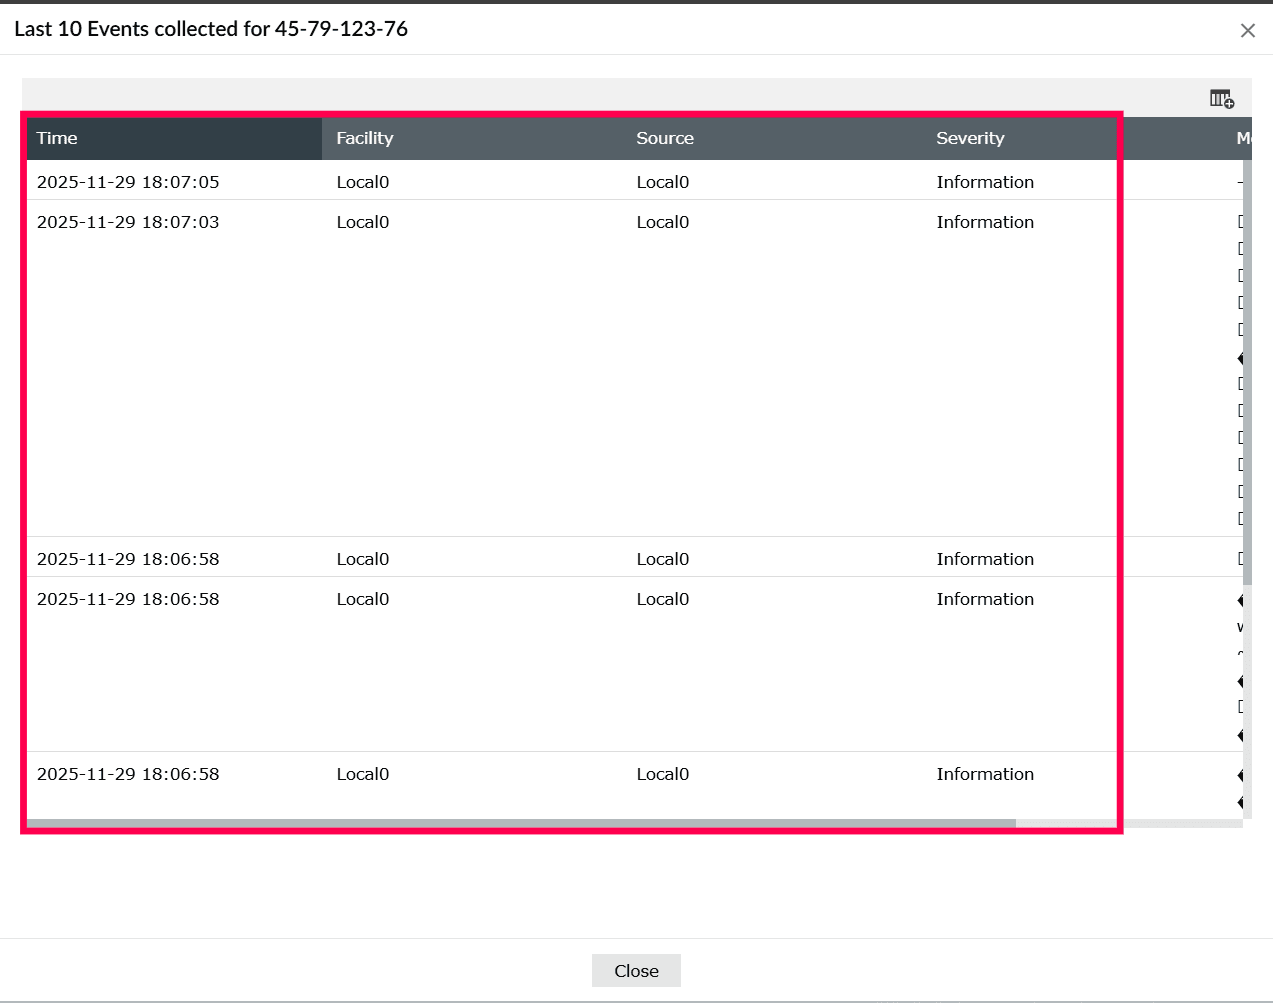
Figure 12: Viewing last 10 events - In the Last 10 Events collected window, you can see event details such as,
- Time: Displays the exact timestamp when the event occurred.
- Event ID: Indicates the unique identifier assigned to the event.
- Source: Specifies the application or service that generated the event.
- Severity: Represents the criticality level of the event.
- Type: Denotes the category or classification of the event.
- Facility: Identifies the system process or component that produced the event.
- Message: Provides a brief description or summary of the event details.
- Click the icon to customize the view. Select the checkbox next to the fields you want to display and click Apply to update the table.
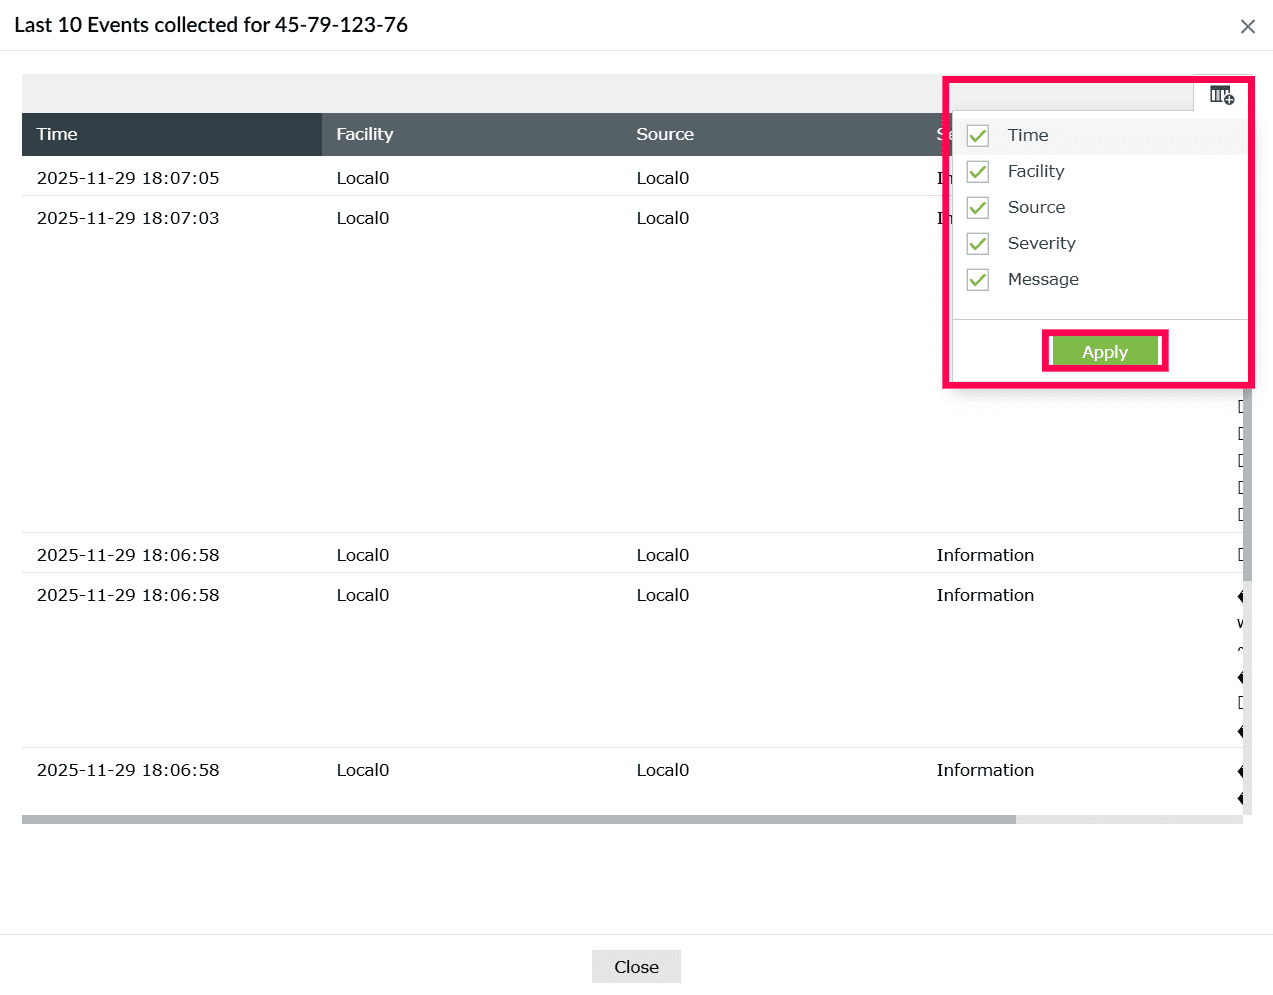
Figure 13: Adding or removing columns - To modify your list of devices, click Manage Devices to add, edit, or remove device configurations.
- Click the
 icon to refresh the device list and view the latest event and monitoring data.
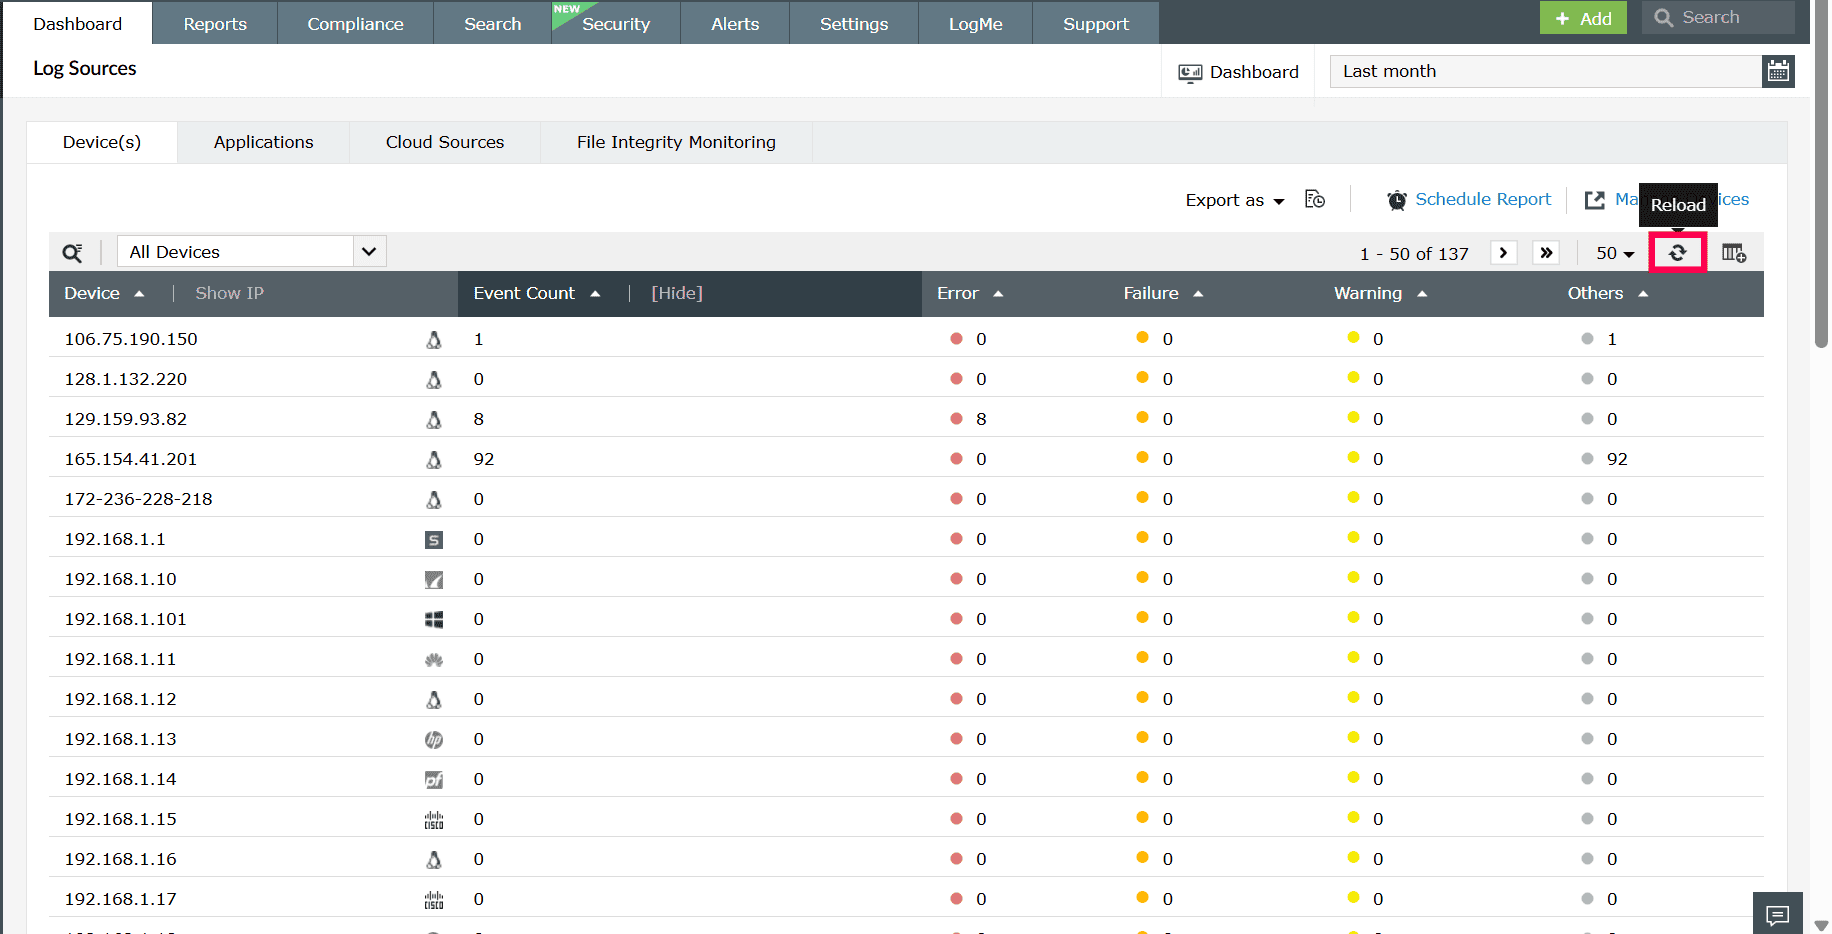
Figure 14: Refreshing log sources - Click Export as to download the list of devices in CSV or PDF.
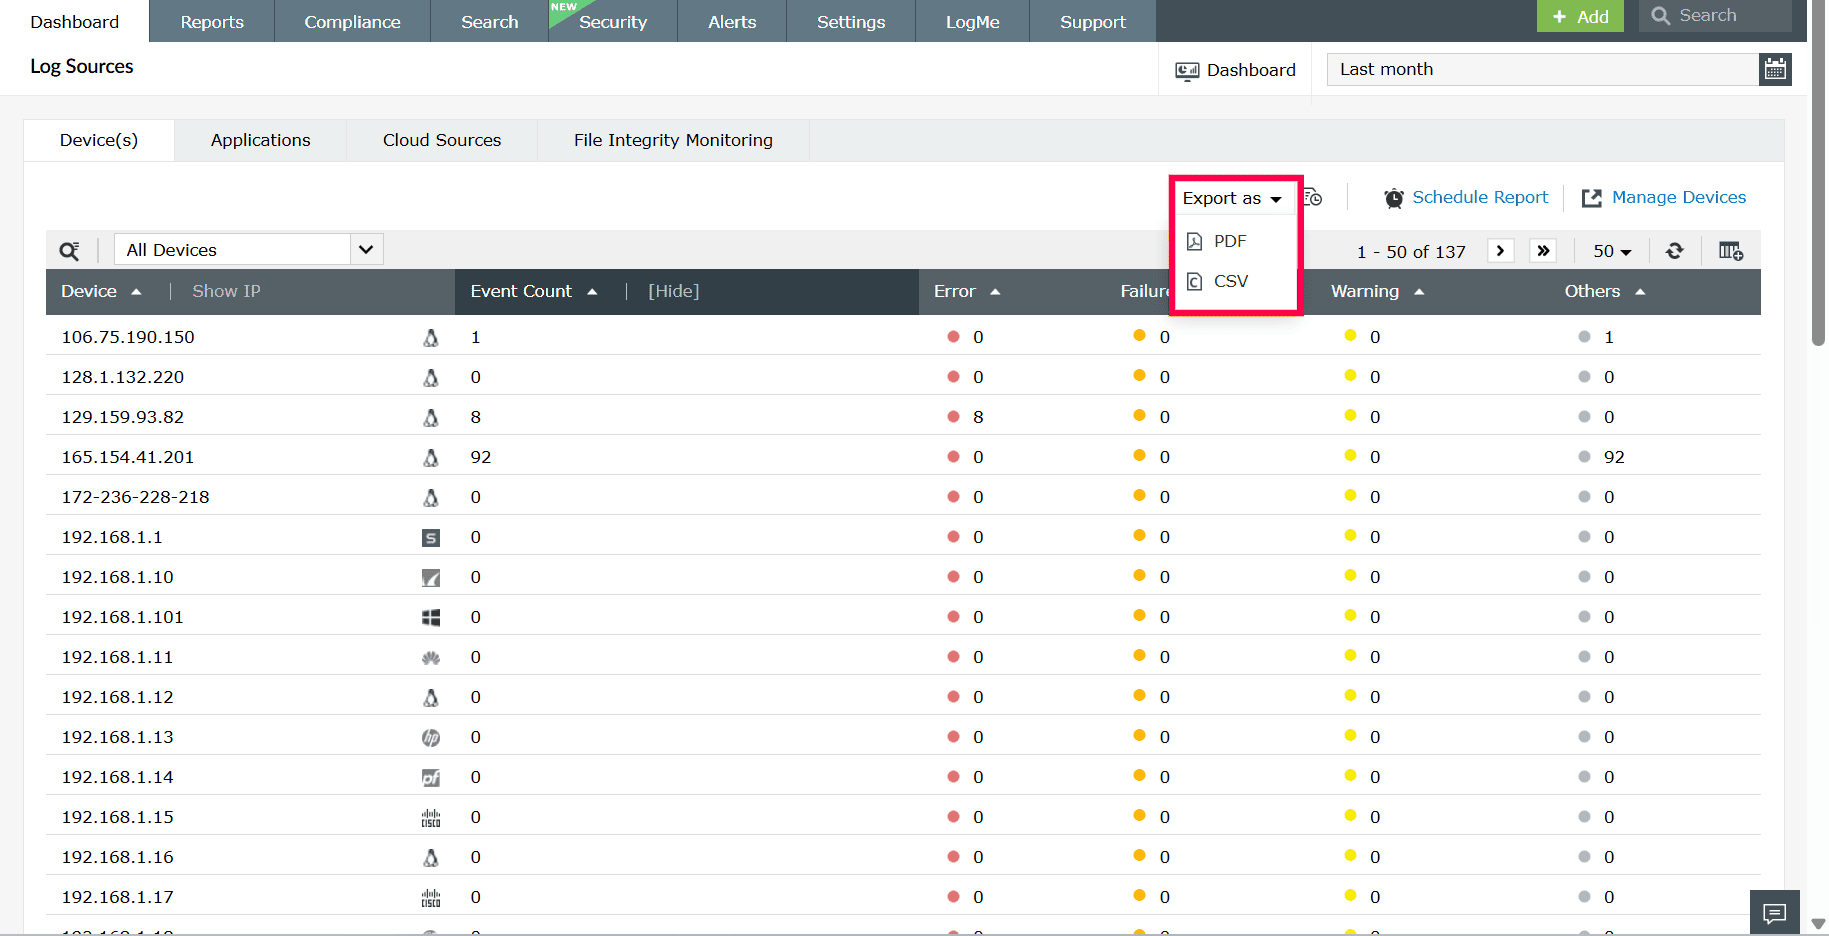
Figure 15: Exporting devices - When you select an option, the export will begin and the below pop-up appears.
- Click the
 icon to view the export history. Click Download to retrieve the exported file or Clear to delete it.
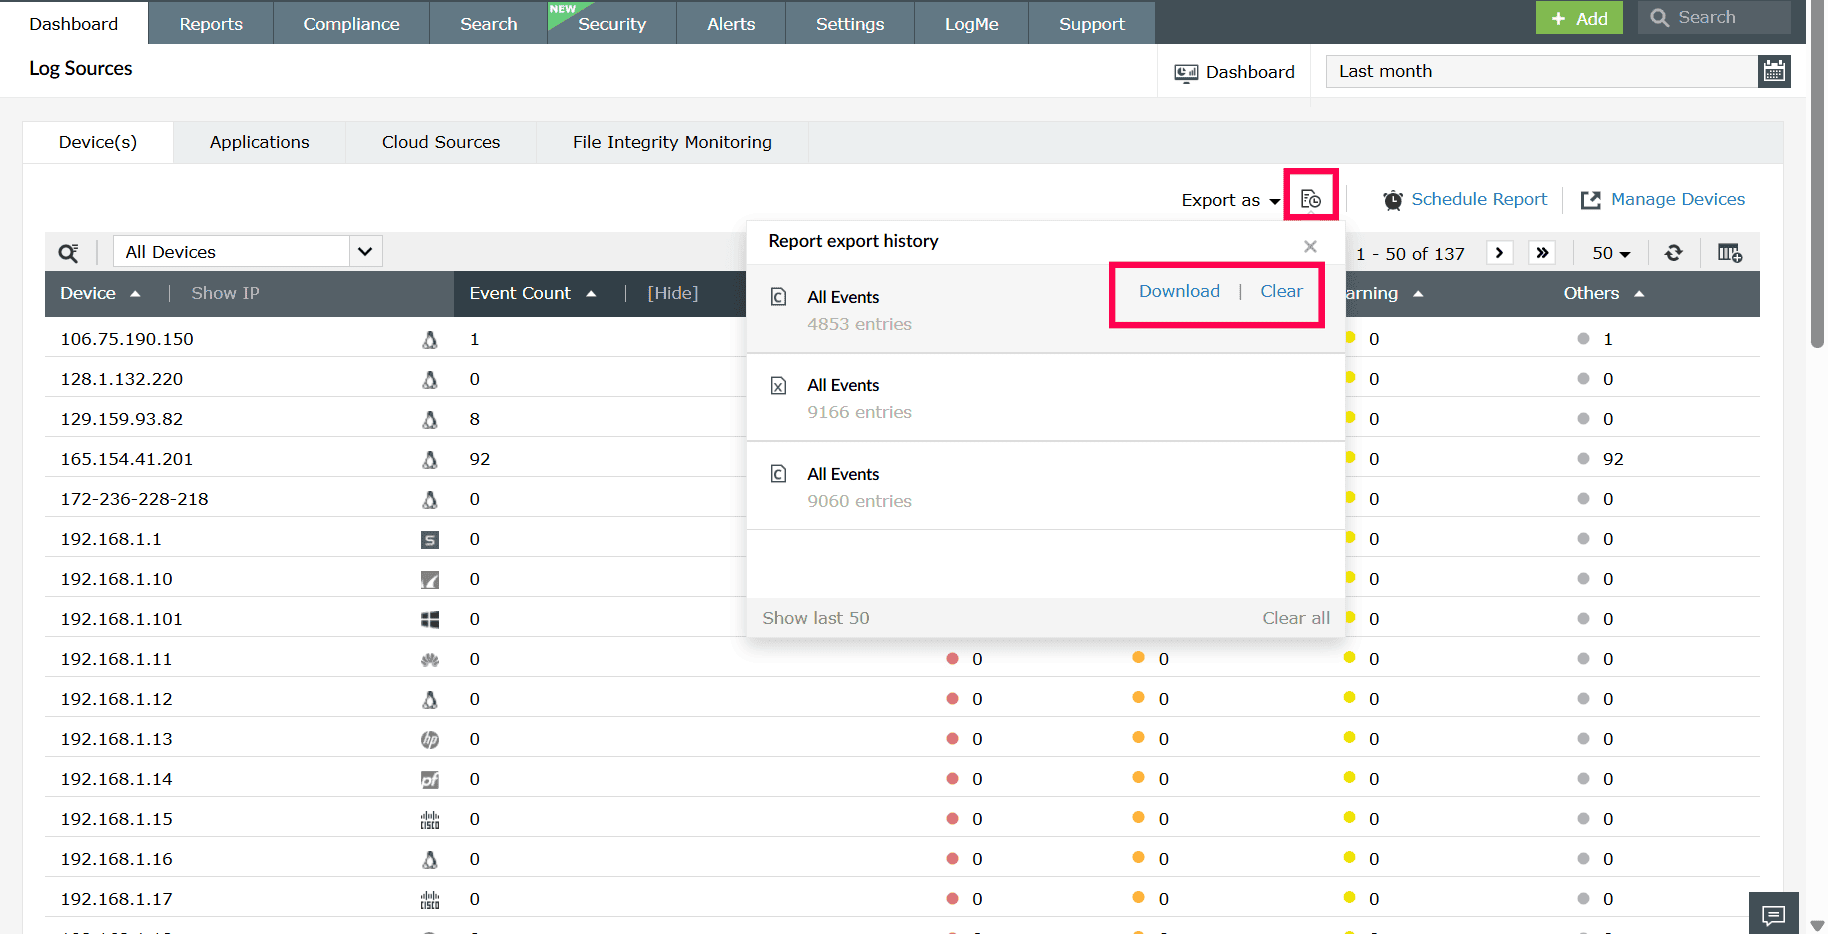
Figure 16: Viewing export history
Applications
The Applications tab displays all configured application log sources. From this tab, you can view the import timeline for each application, including when log collection started, when it ended, and when the logs were last imported, along with the total log count.
Follow these steps to view and manage the application log sources:
- Click the
 icon to narrow down the list of application log sources.
 - You can filter by selecting Log Source Type or Log Source Group. By default, the filter is set to All, displaying every application log source.
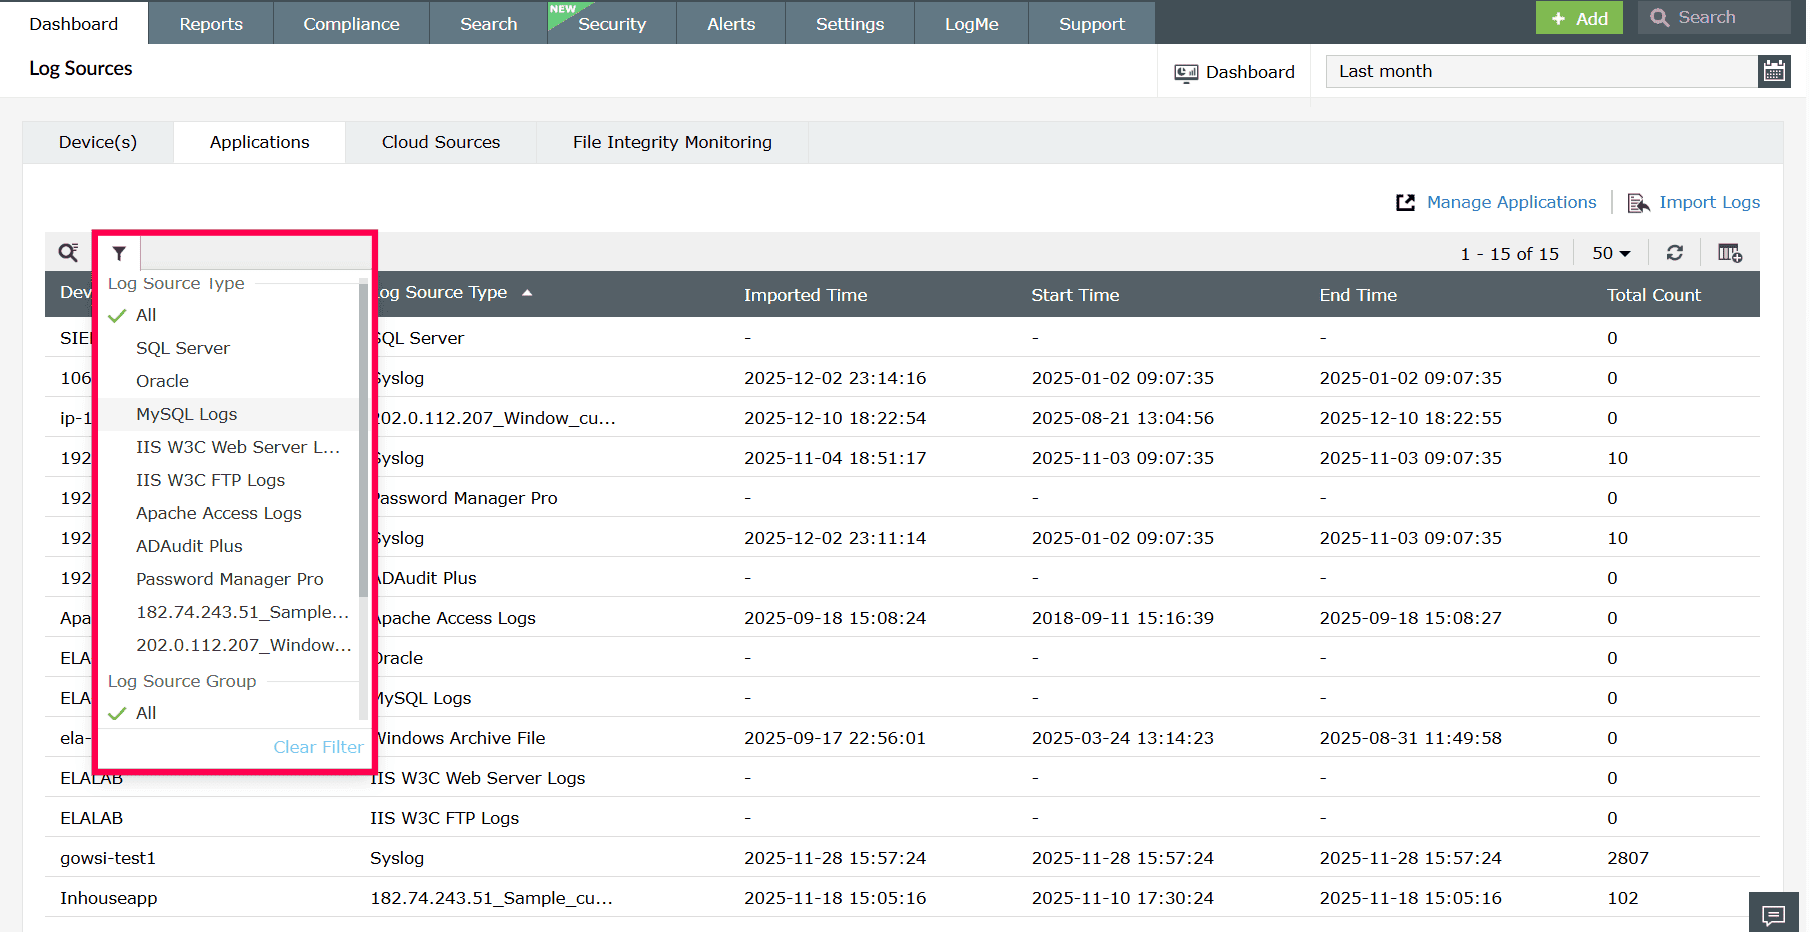
Figure 17: Filtering application log sources - Select Clear Filter to reset the view.
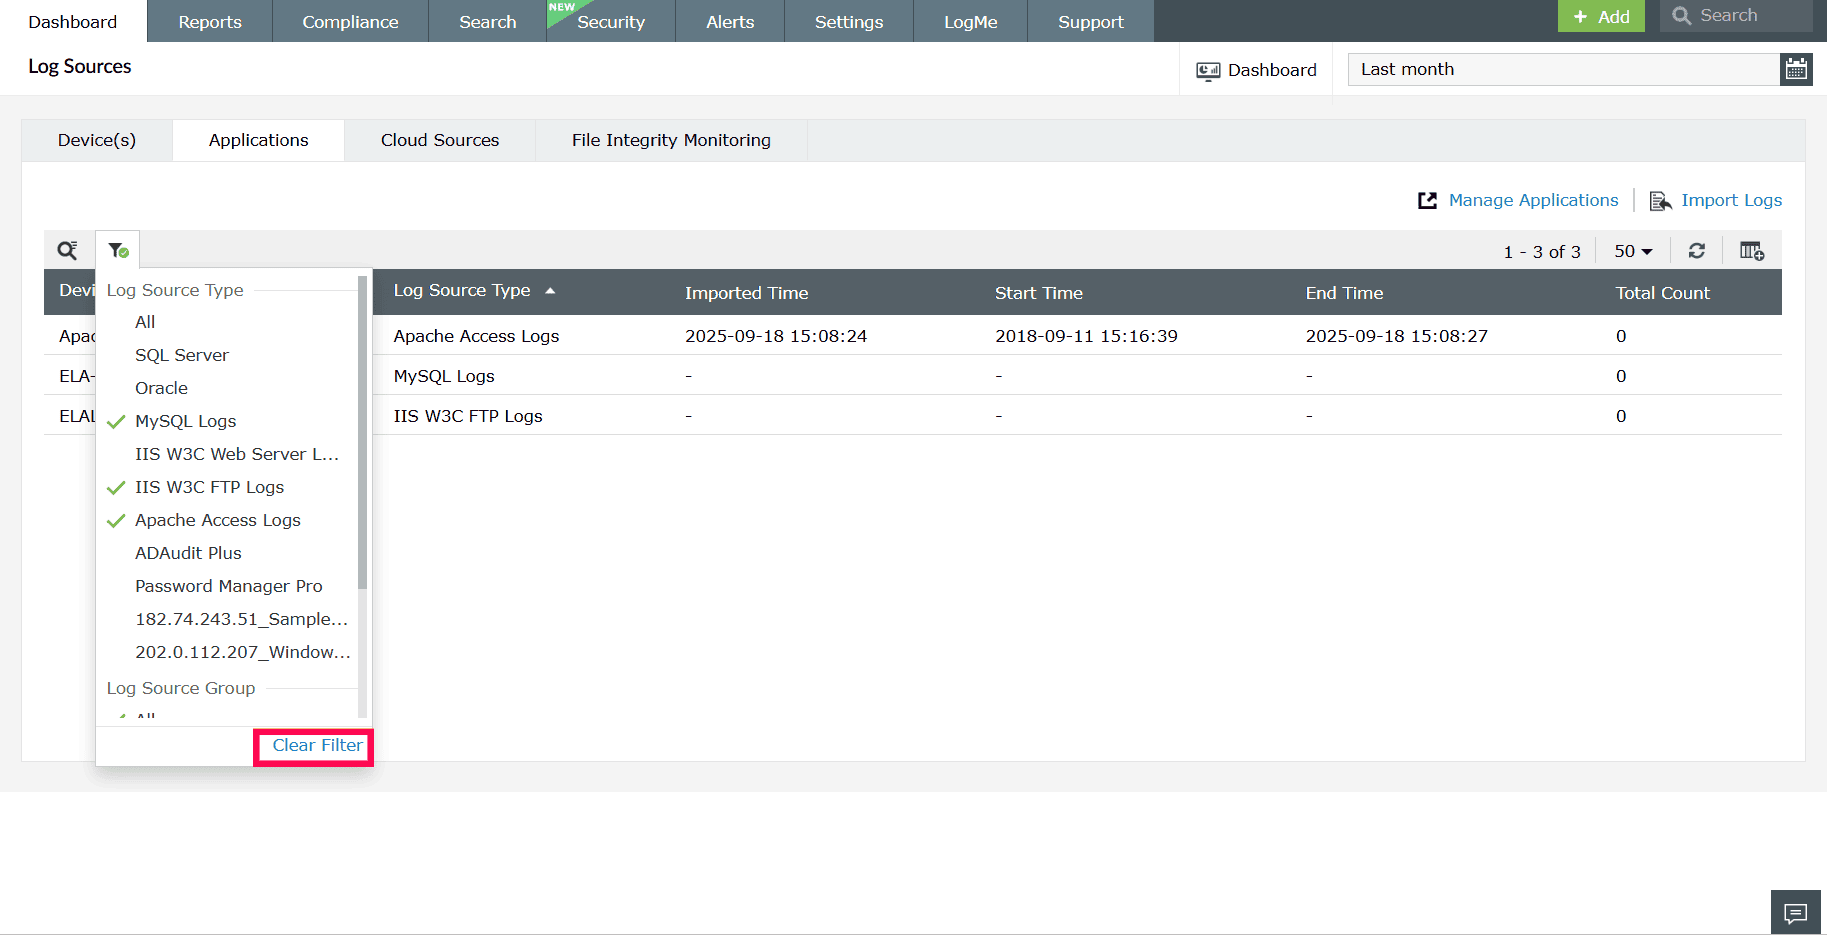
Figure 18: Clearing filters - Use the
 icon to locate a specific application by the device name or IP.
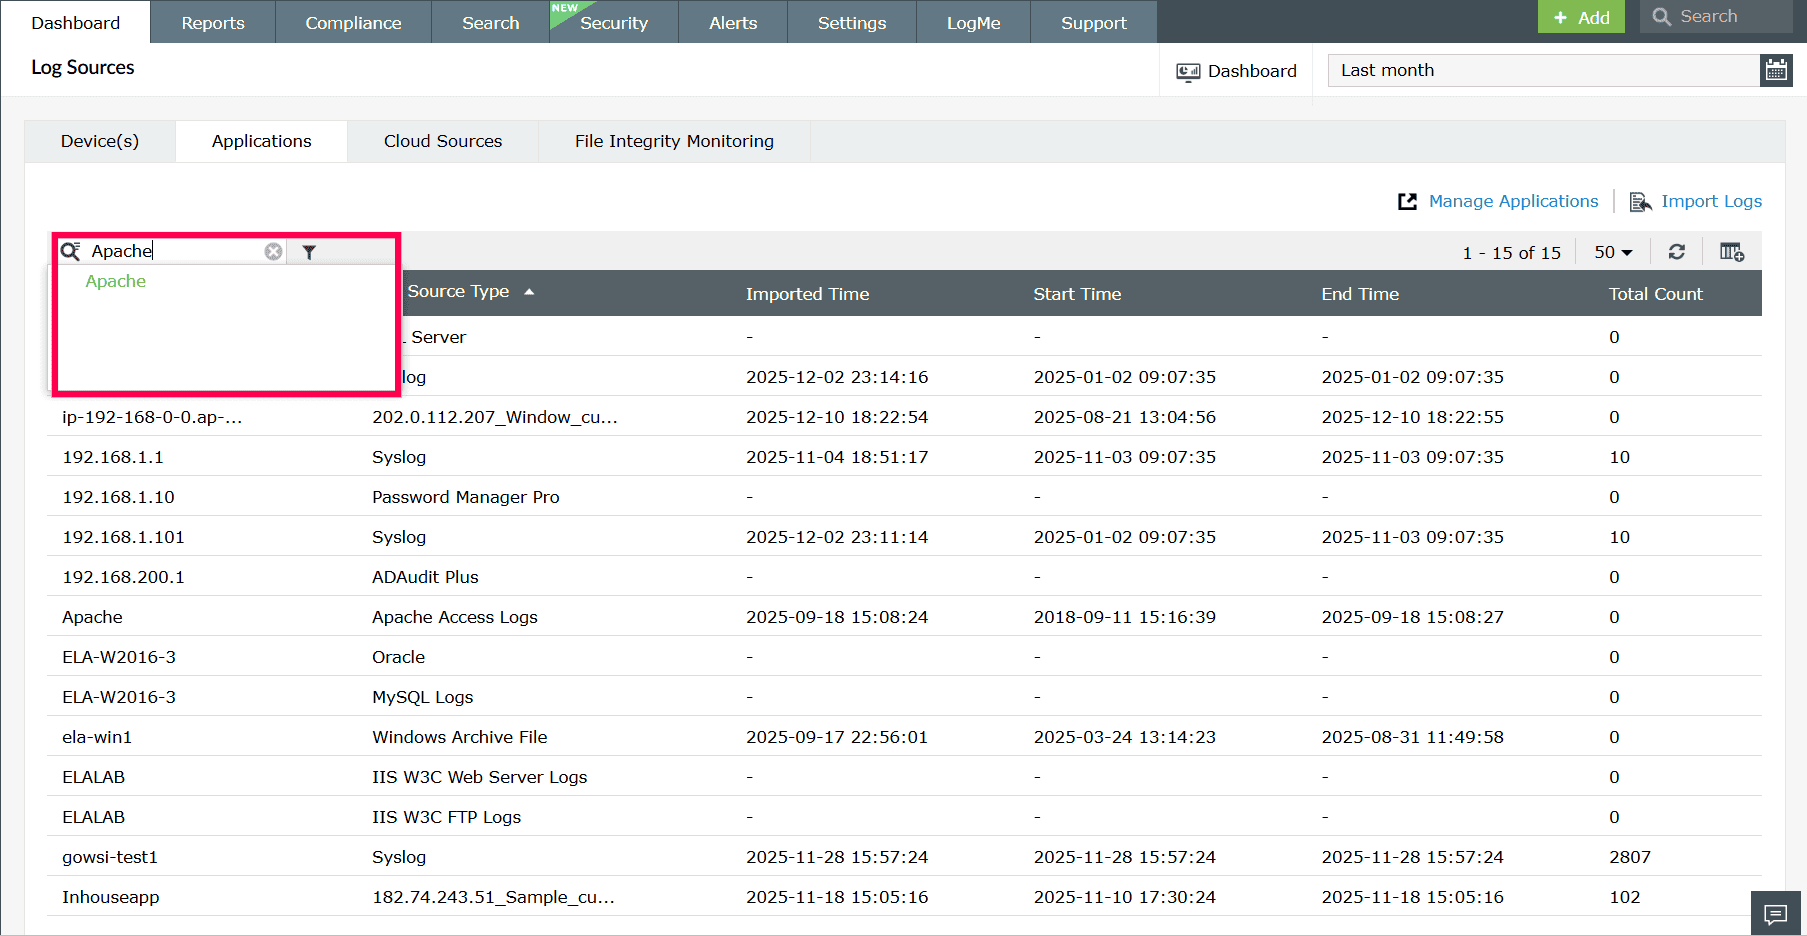
Figure 19: Locating an application - Click Show IP to display the IP address associated with the device.
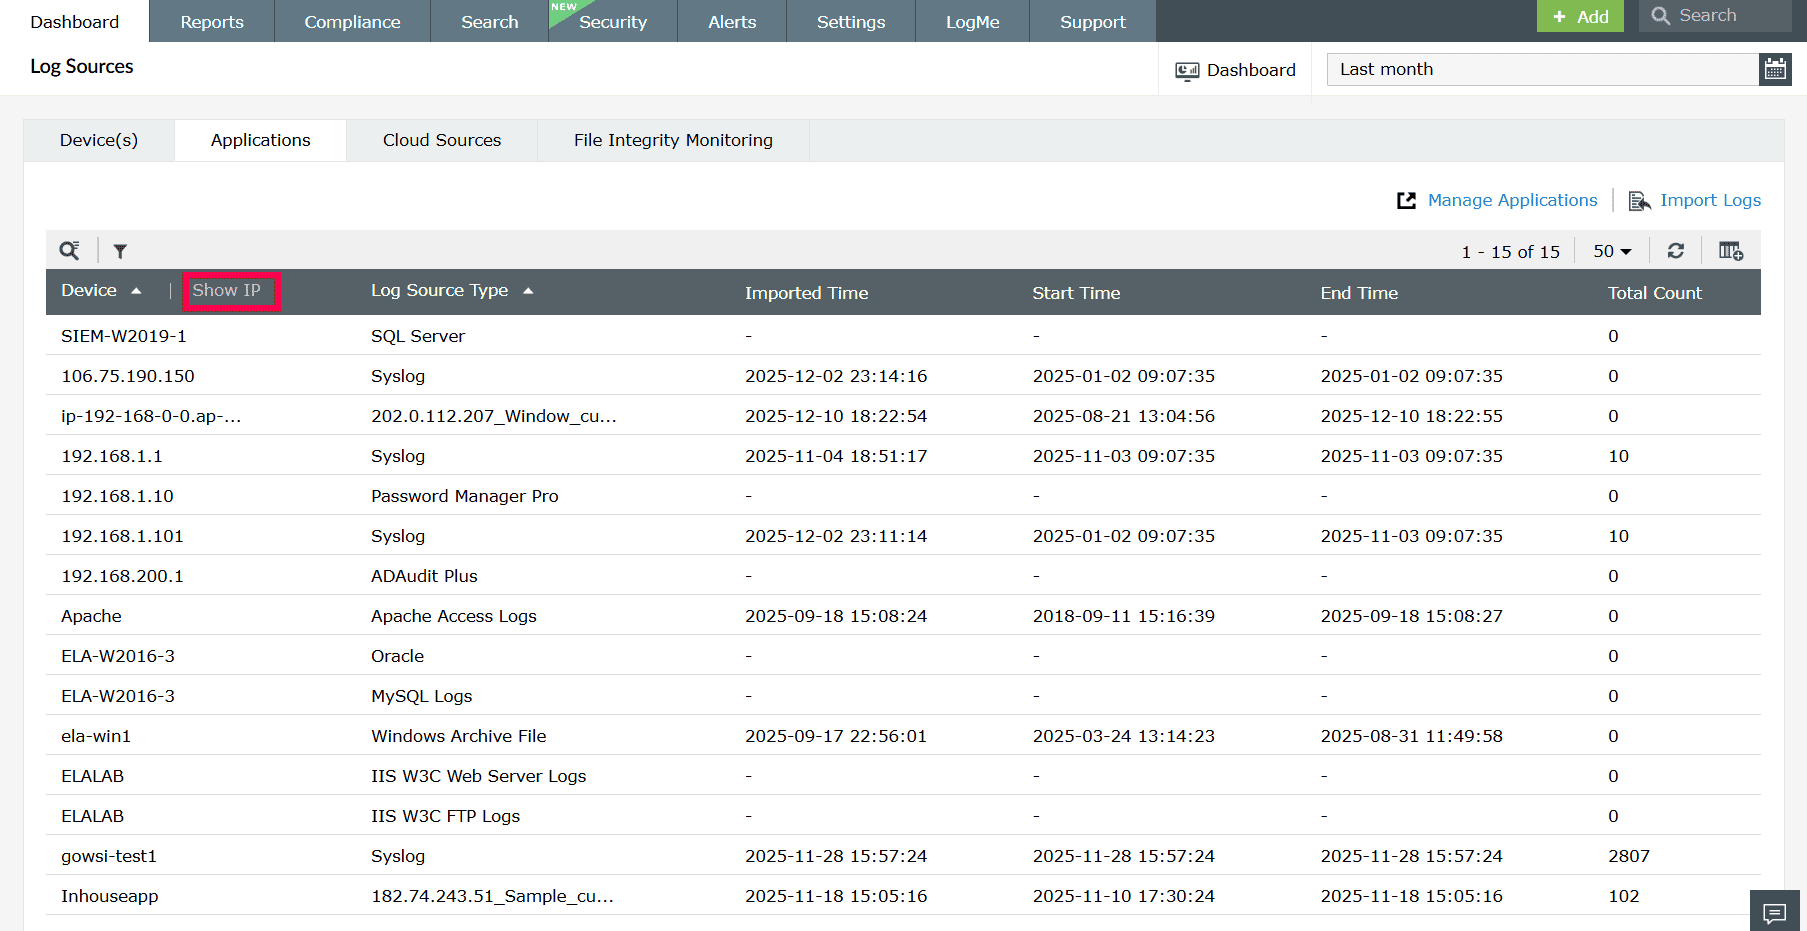
Figure 20: Viewing IP associated with the device - You can also click Show Name to display the name associated with the device.

Figure 21: Viewing device name - The table includes the following fields:
- Device: Displays the device name or IP address associated with the application.
- Log Source Type: Shows the type of application or log format configured for collection.
- Imported Time: Indicates when logs were last imported.
- Start Time: Displays when the log collection or import process began.
- End Time: Displays when the log collection or import process ended, if applicable.
- Total Count: Shows the total number of logs collected from the application.
- To modify your list of application log sources, click Manage
Applications to add, edit, or remove configurations.
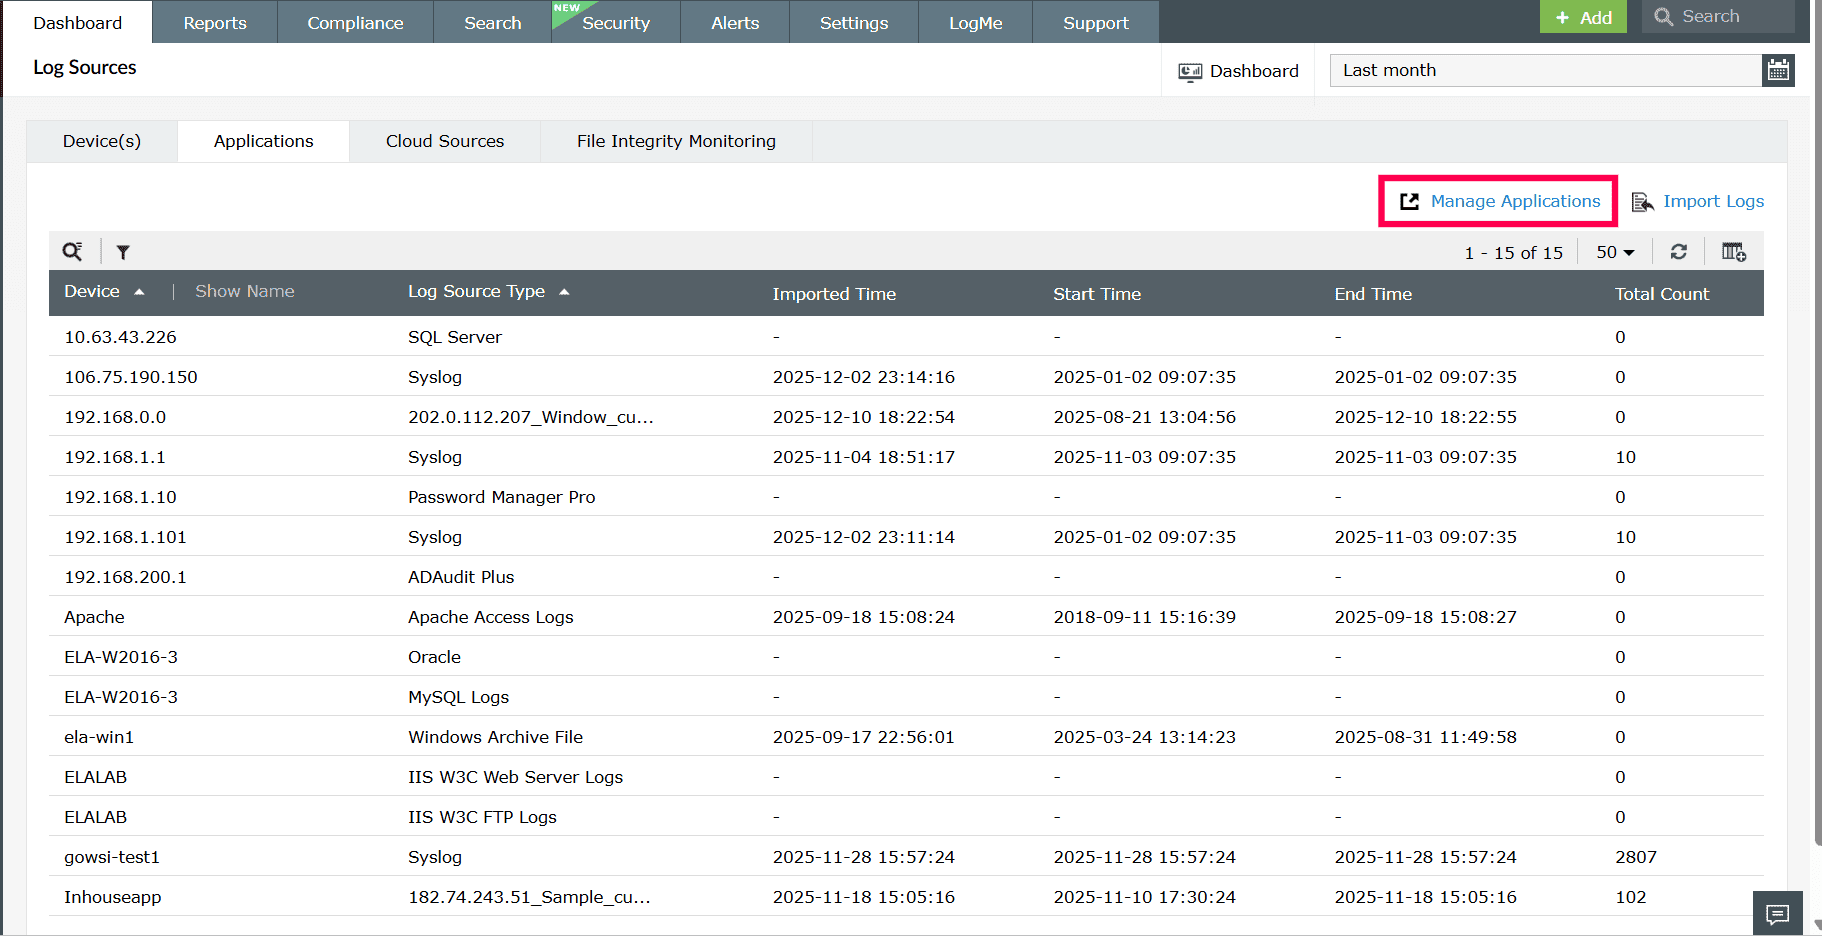
Figure 22: Managing applications - Click the icon to update the application list and view the most recent data.
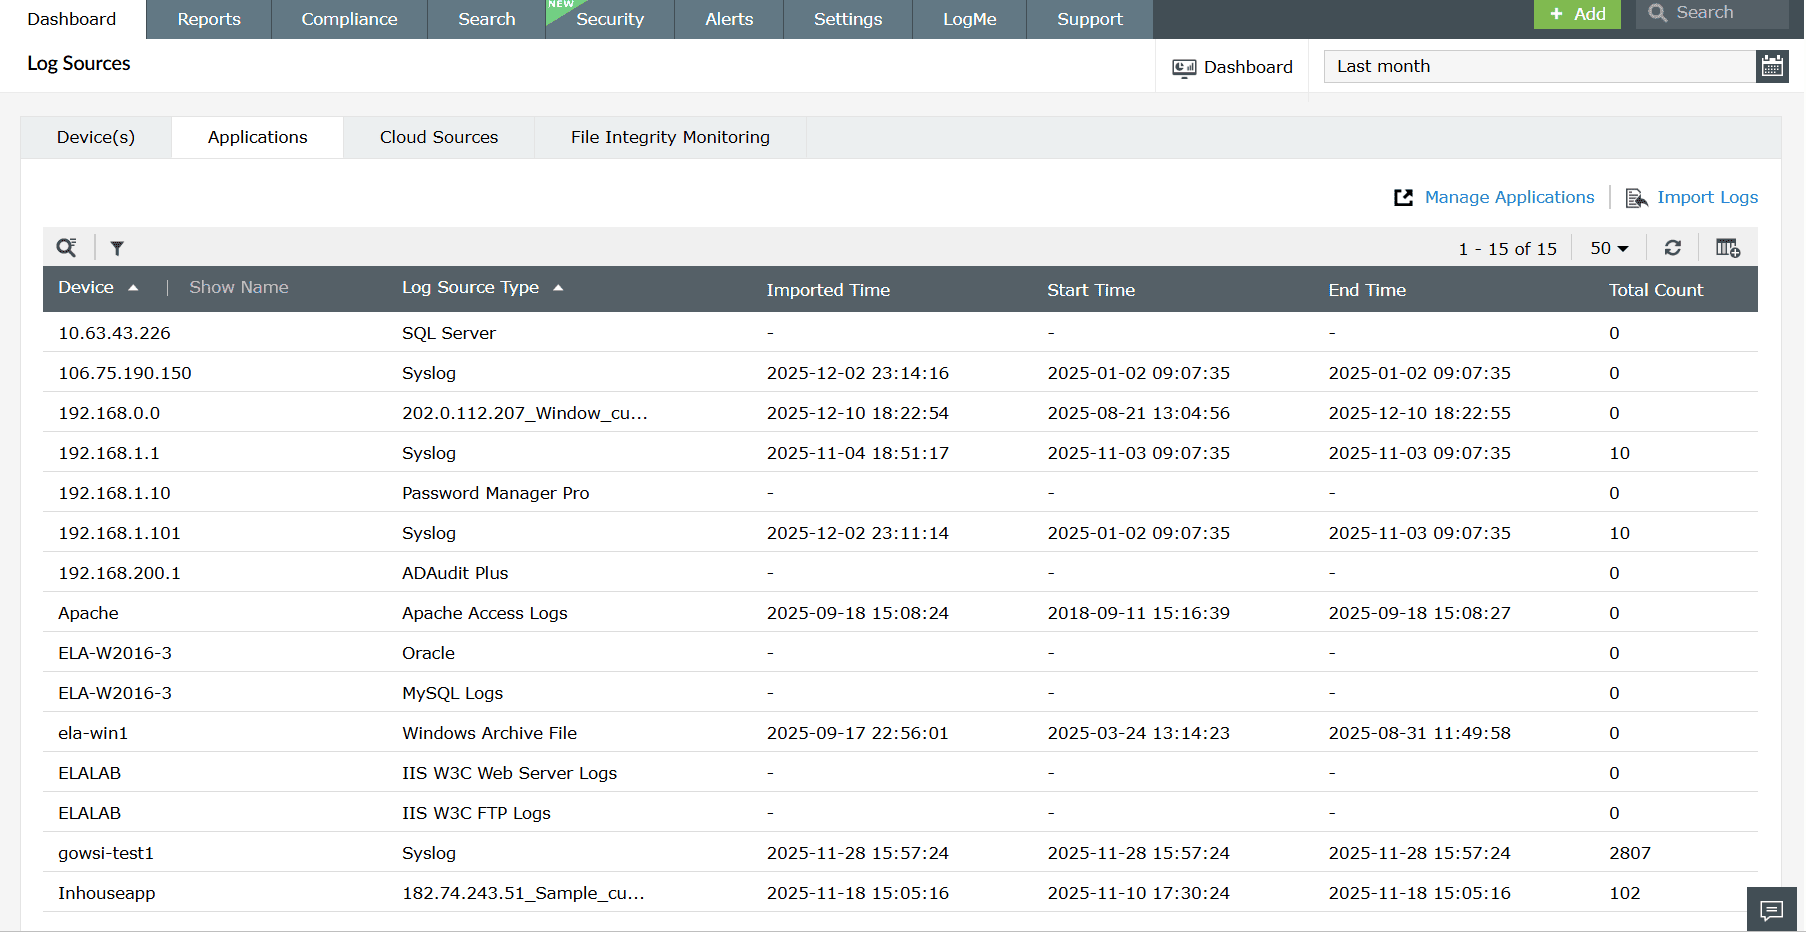
Figure 23: Reloading application data - If applicable, click
Import
Logs to manually upload application log files.
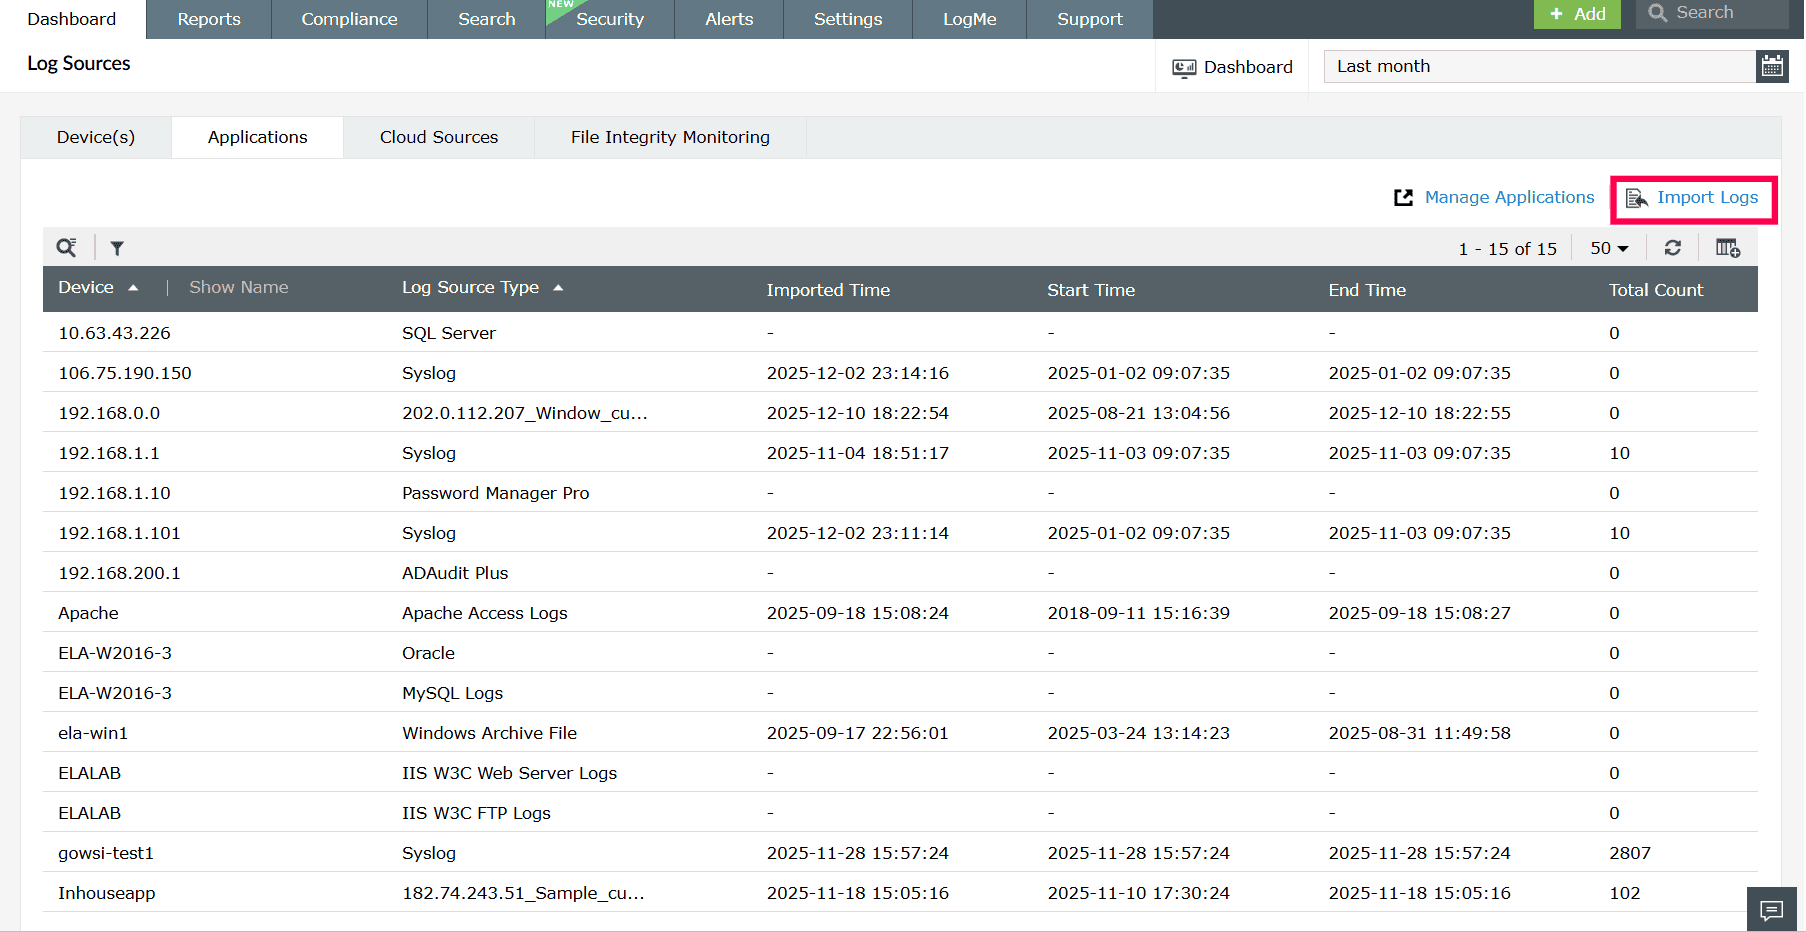
Figure 24: Importing logs - Click the icon to add or remove columns from the table.
- Select the checkbox next to the fields you want to display and click Apply to update the table view.
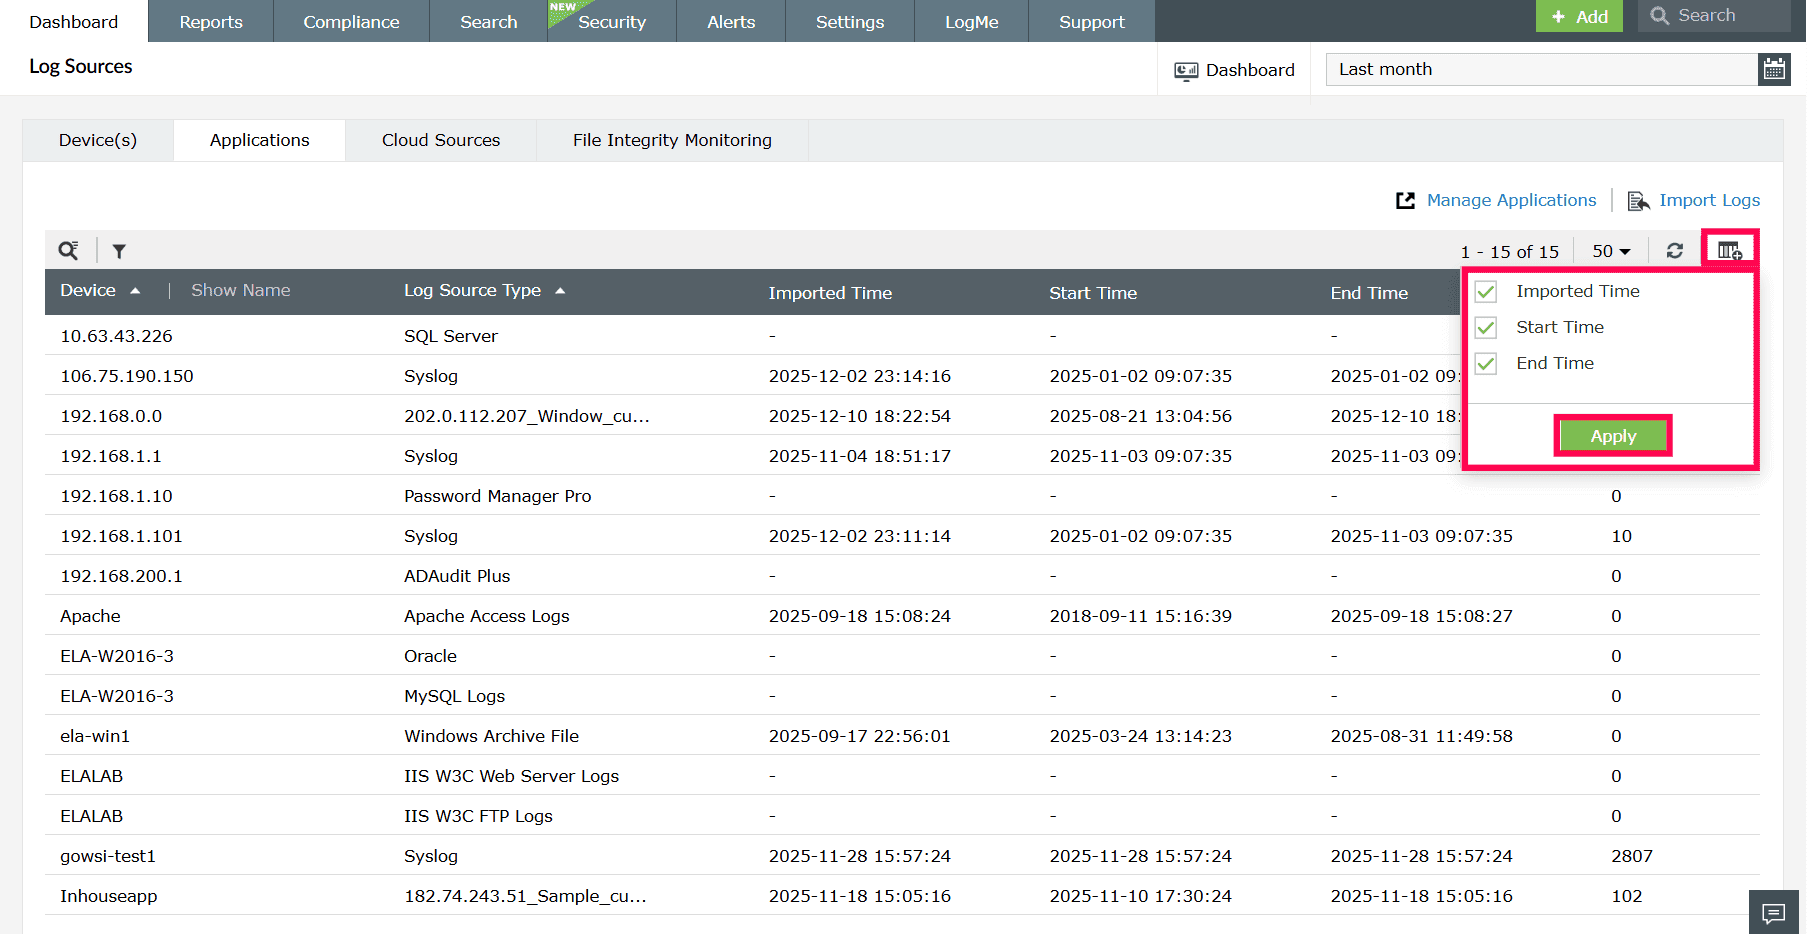
Figure 25: Adding or removing columns - Click the value under Total Count to open the Application
Event Details window and view the events collected for that application.
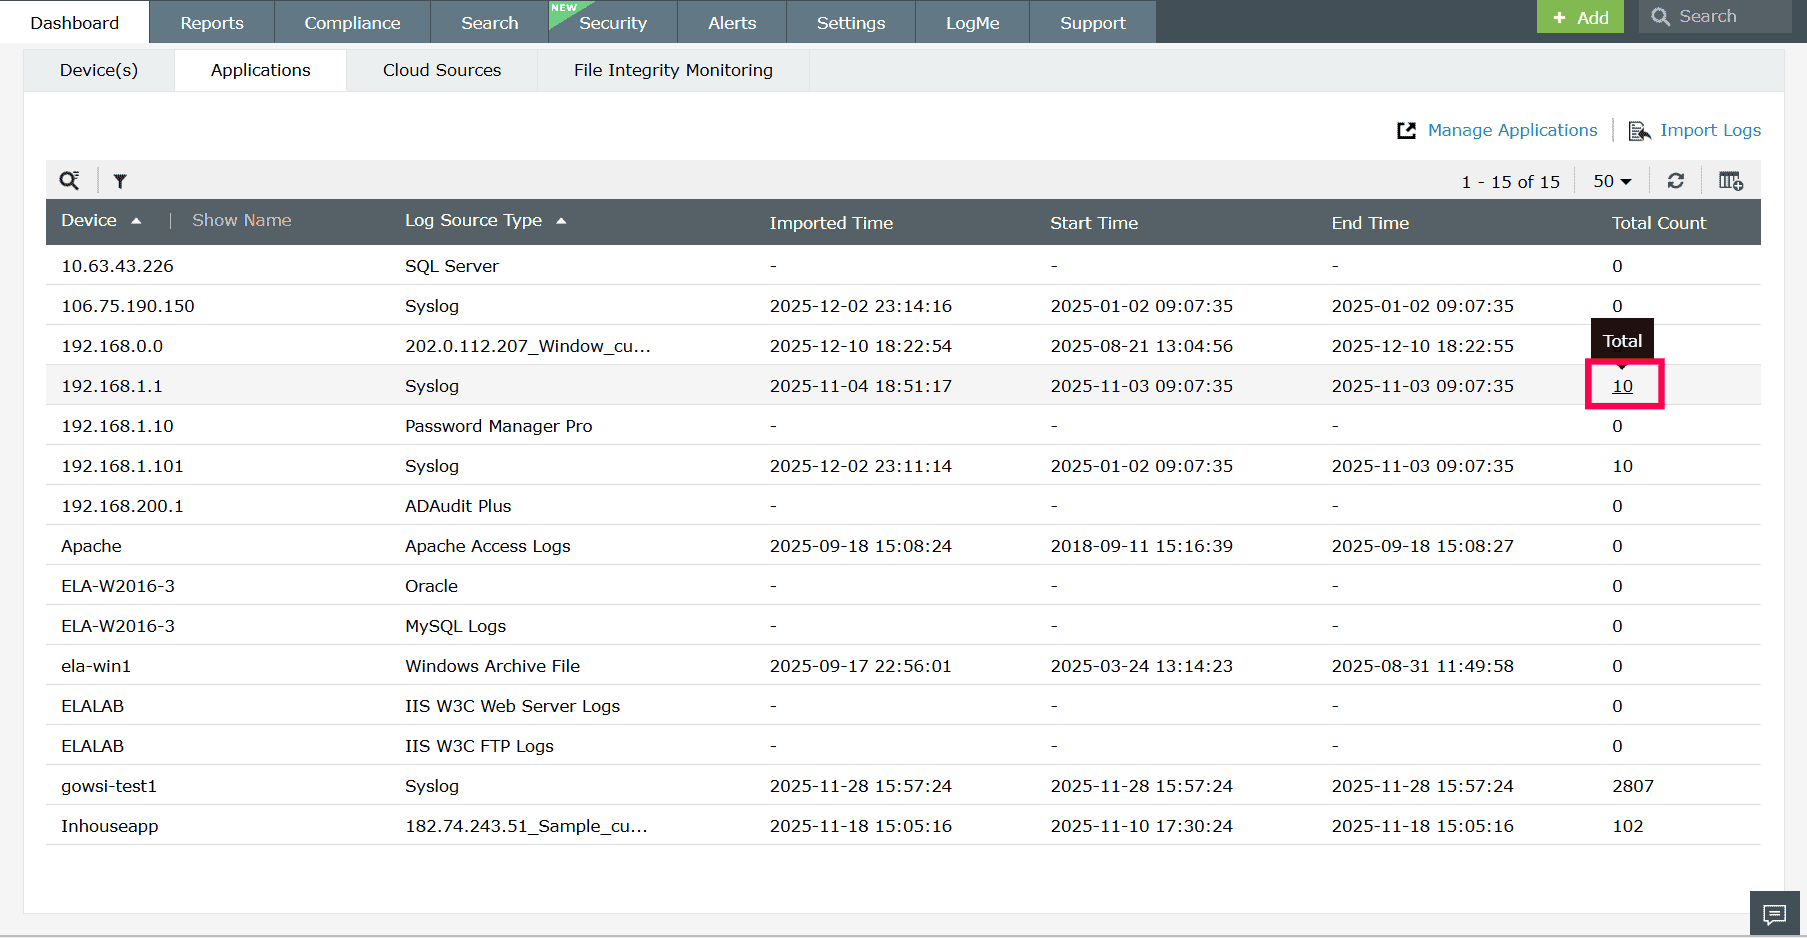
Figure 26: Viewing application event details - The Application Event Details window displays the following fields:
- Time: Shows the exact timestamp when the event occurred.
- Message: Provides a brief description or summary of the event content.
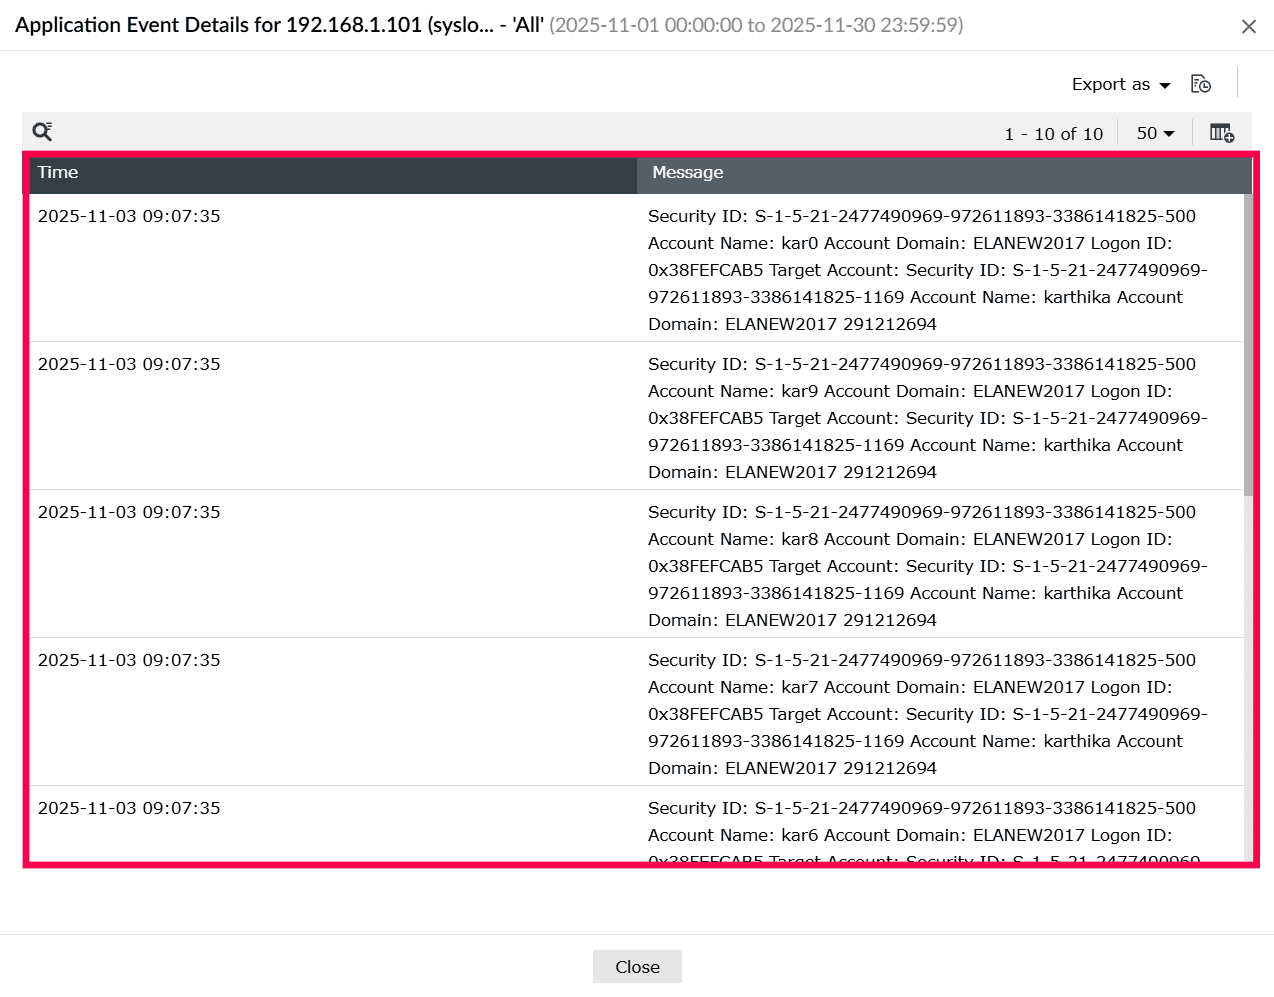
Figure 27: Viewing application event details - Click the icon to customize the event details table.
- Select the checkboxes for the fields you want to display and click Apply to update the view.
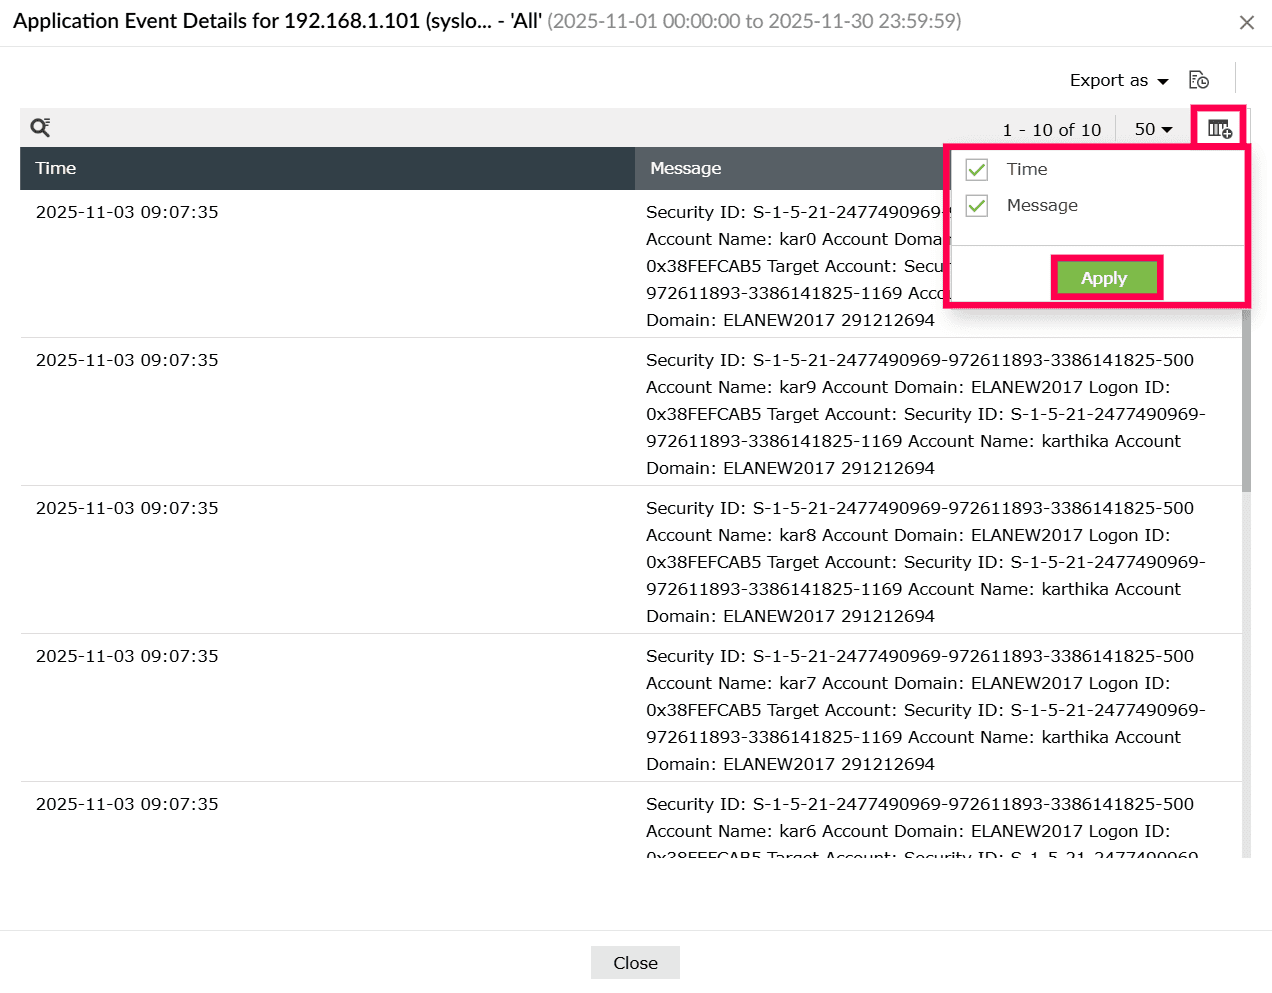
Figure 28: Adding or removing columns - In the Application Event Details window, Click Export as to download the event details in CSV or PDF format.
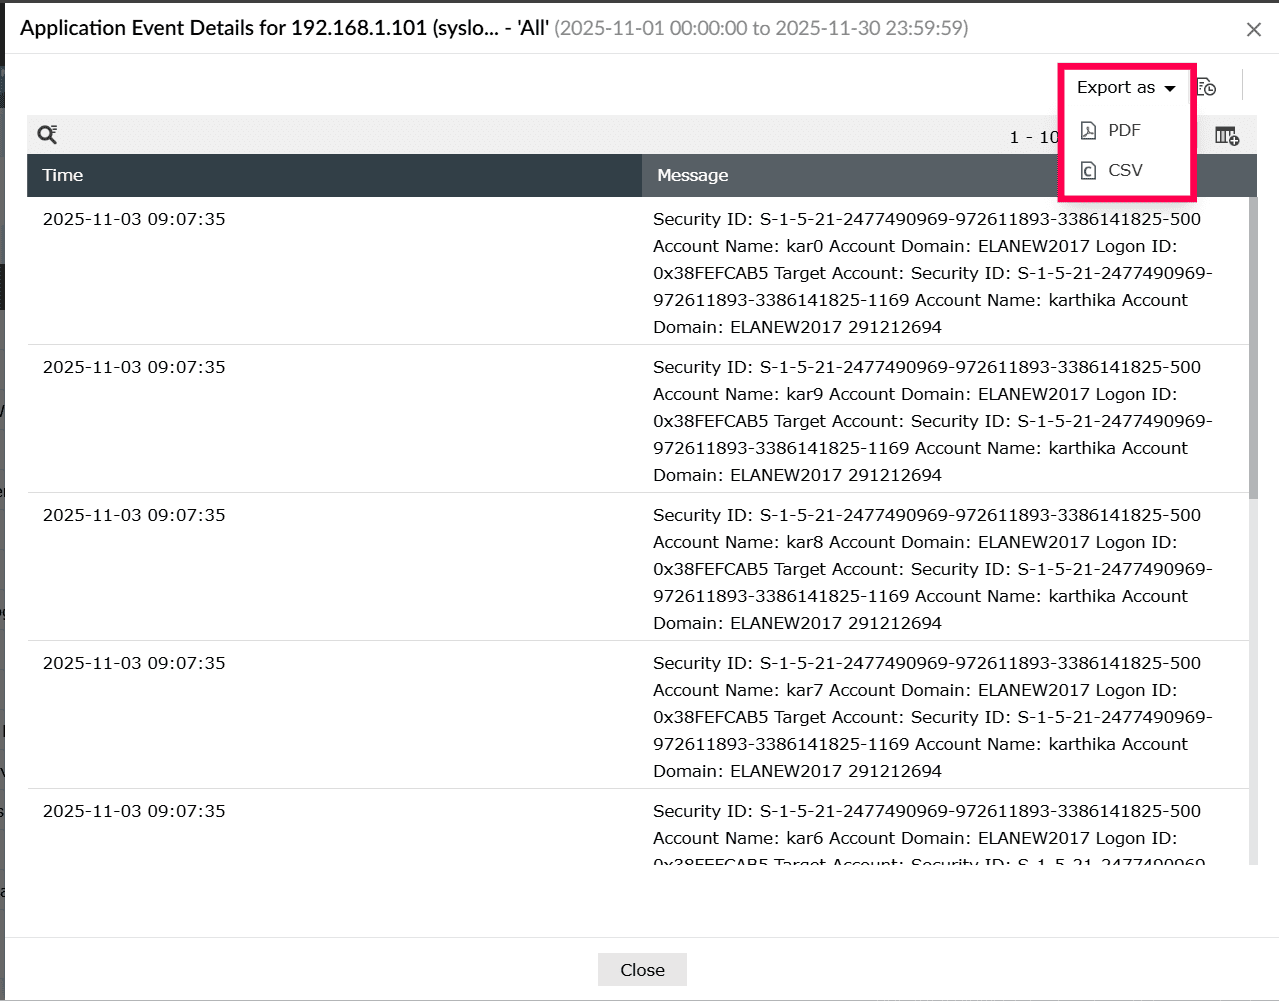
Figure 29: Exporting event details - After initiating an export, click the icon to view past exports.You can Download an exported file or click Clear to remove it from the history.
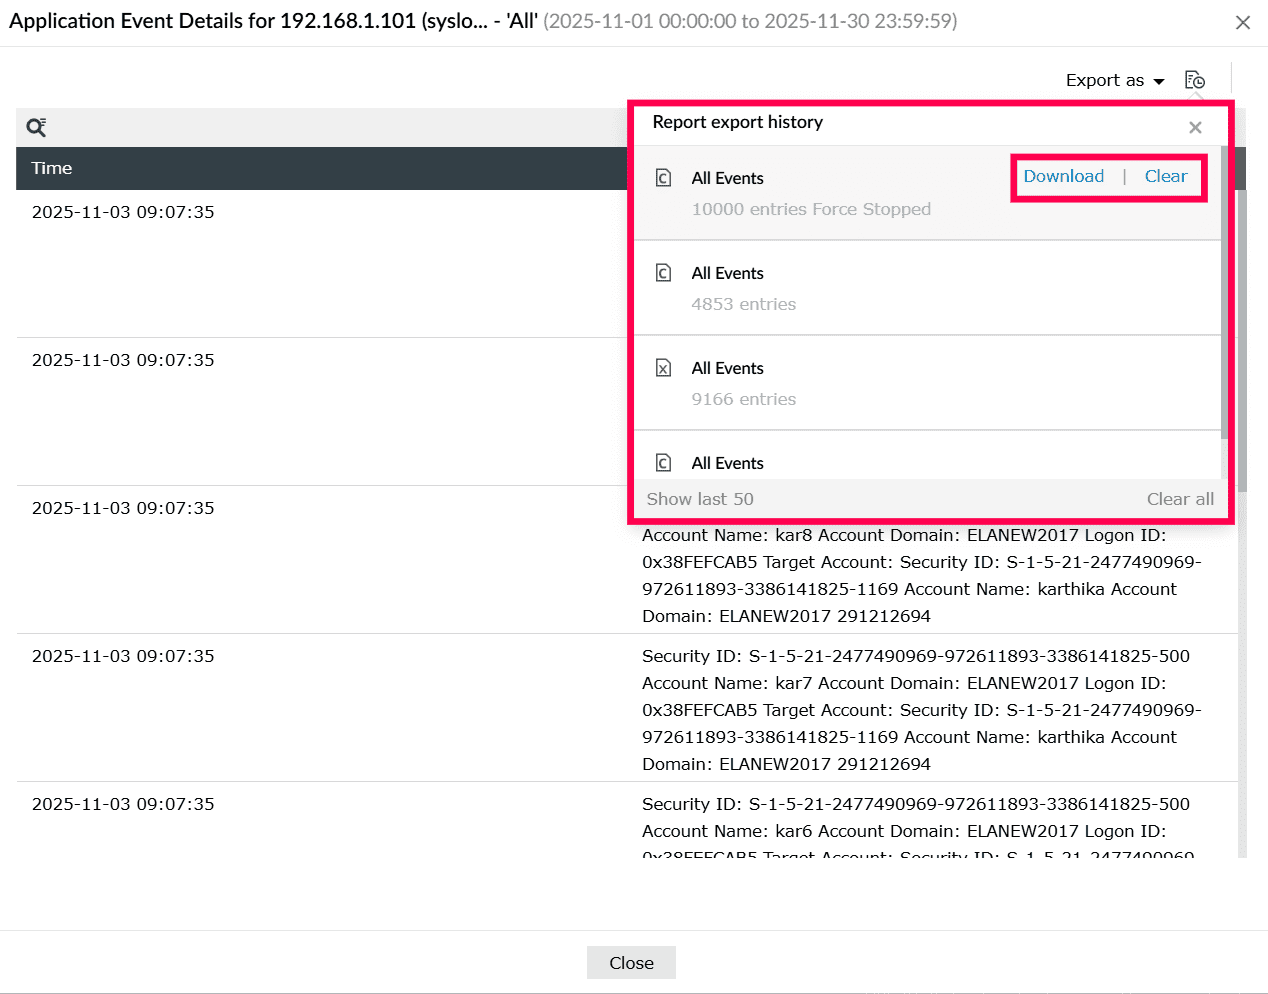
Figure 30: Viewing report export history - Click the icon to show a search field above the Message column for filtering events by message.
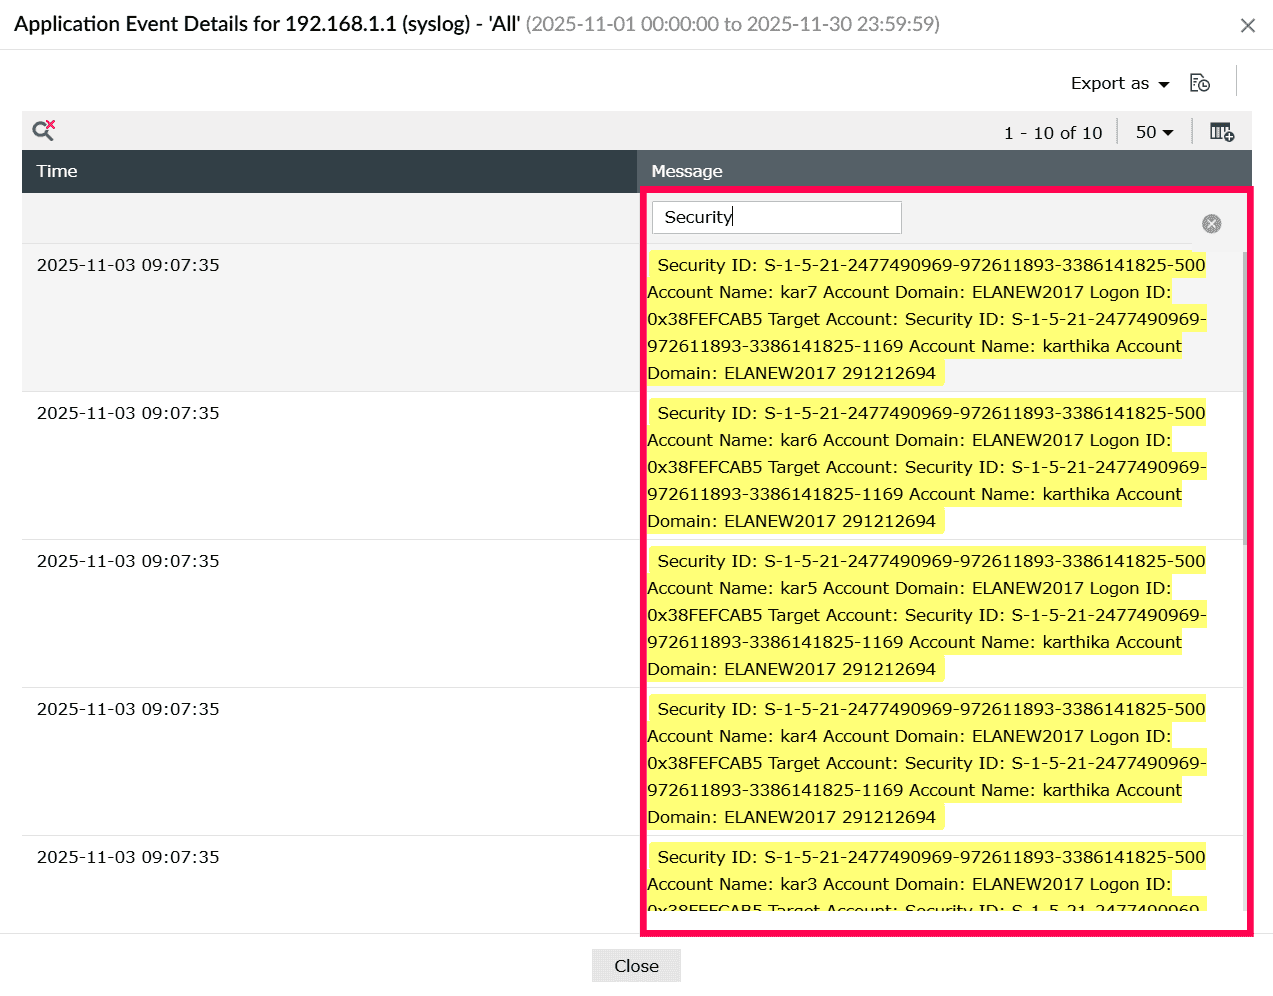
Figure 31: Using search - Click the
 icon to close the search field and click the
  icon to remove the applied search filter.
 - To return to the previous window, click Close.
Cloud sources
The Cloud Sources tab displays all configured cloud-based log sources. From this tab, you can view details such as the data source, tenant name, log count, data fetch interval, last scan time, last message time, and the status of log collection.
Follow these steps to view and manage cloud log sources:
- Use the icon to locate a specific cloud source by data source type.
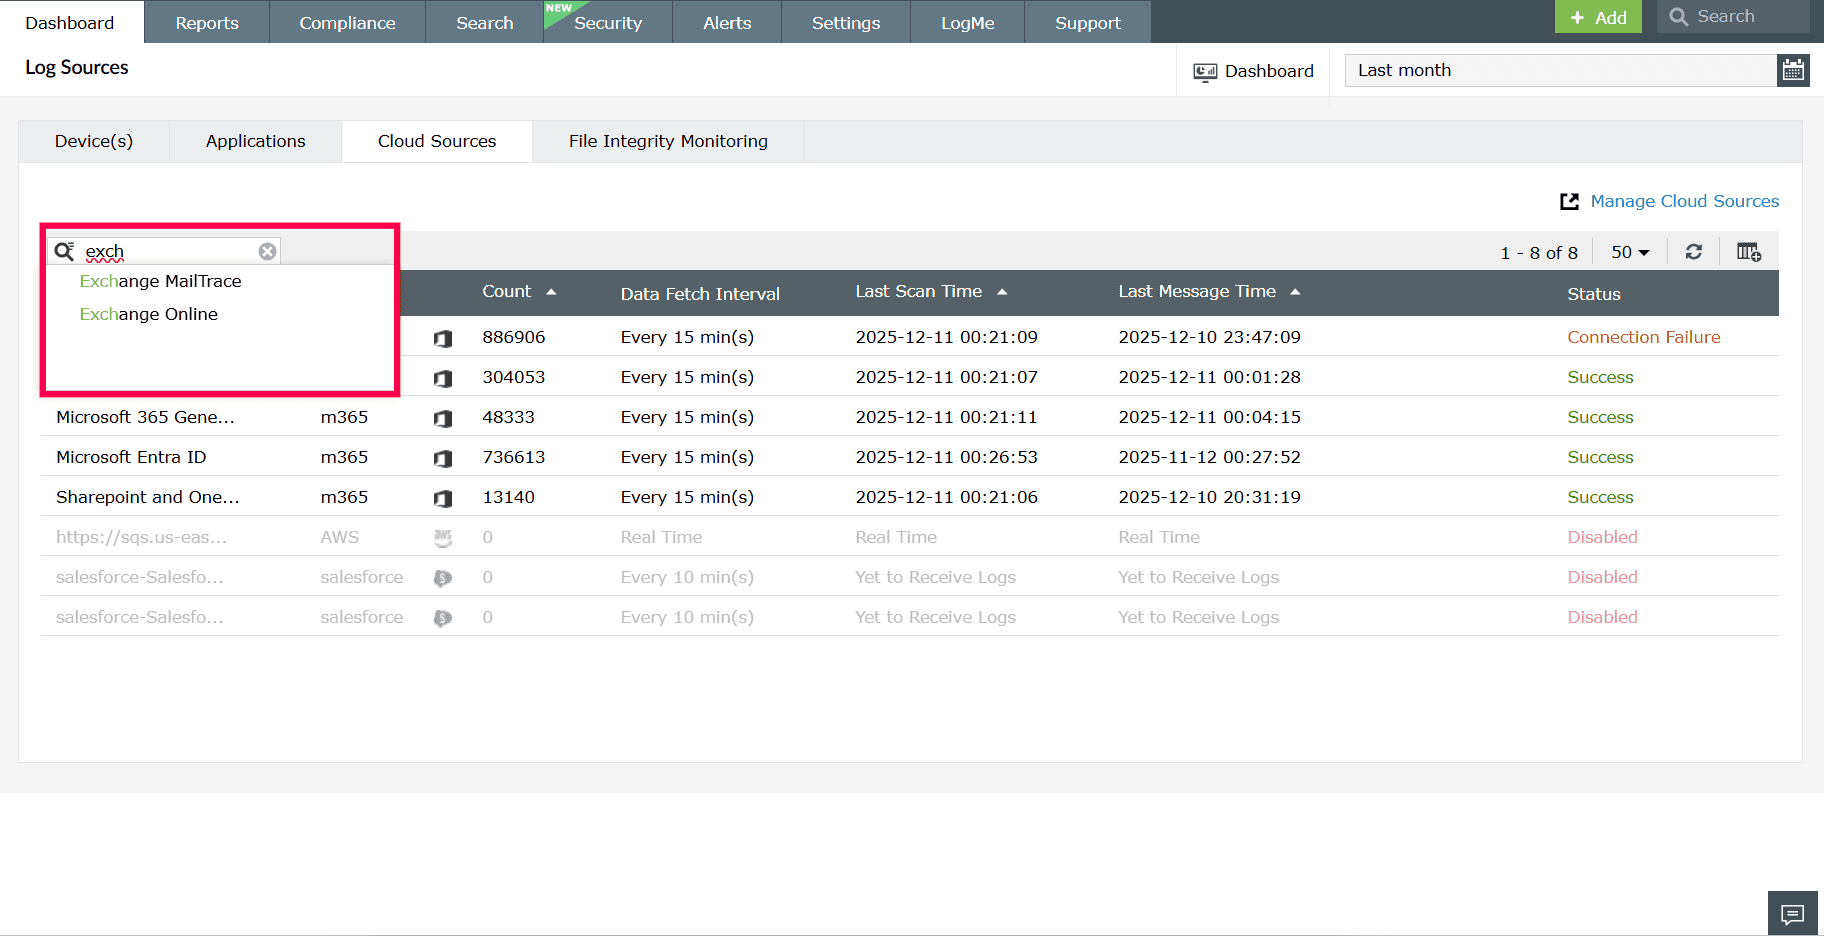
Figure 32: Locating cloud sources - Click Manage Cloud Sources to add, edit, or remove cloud source configurations.
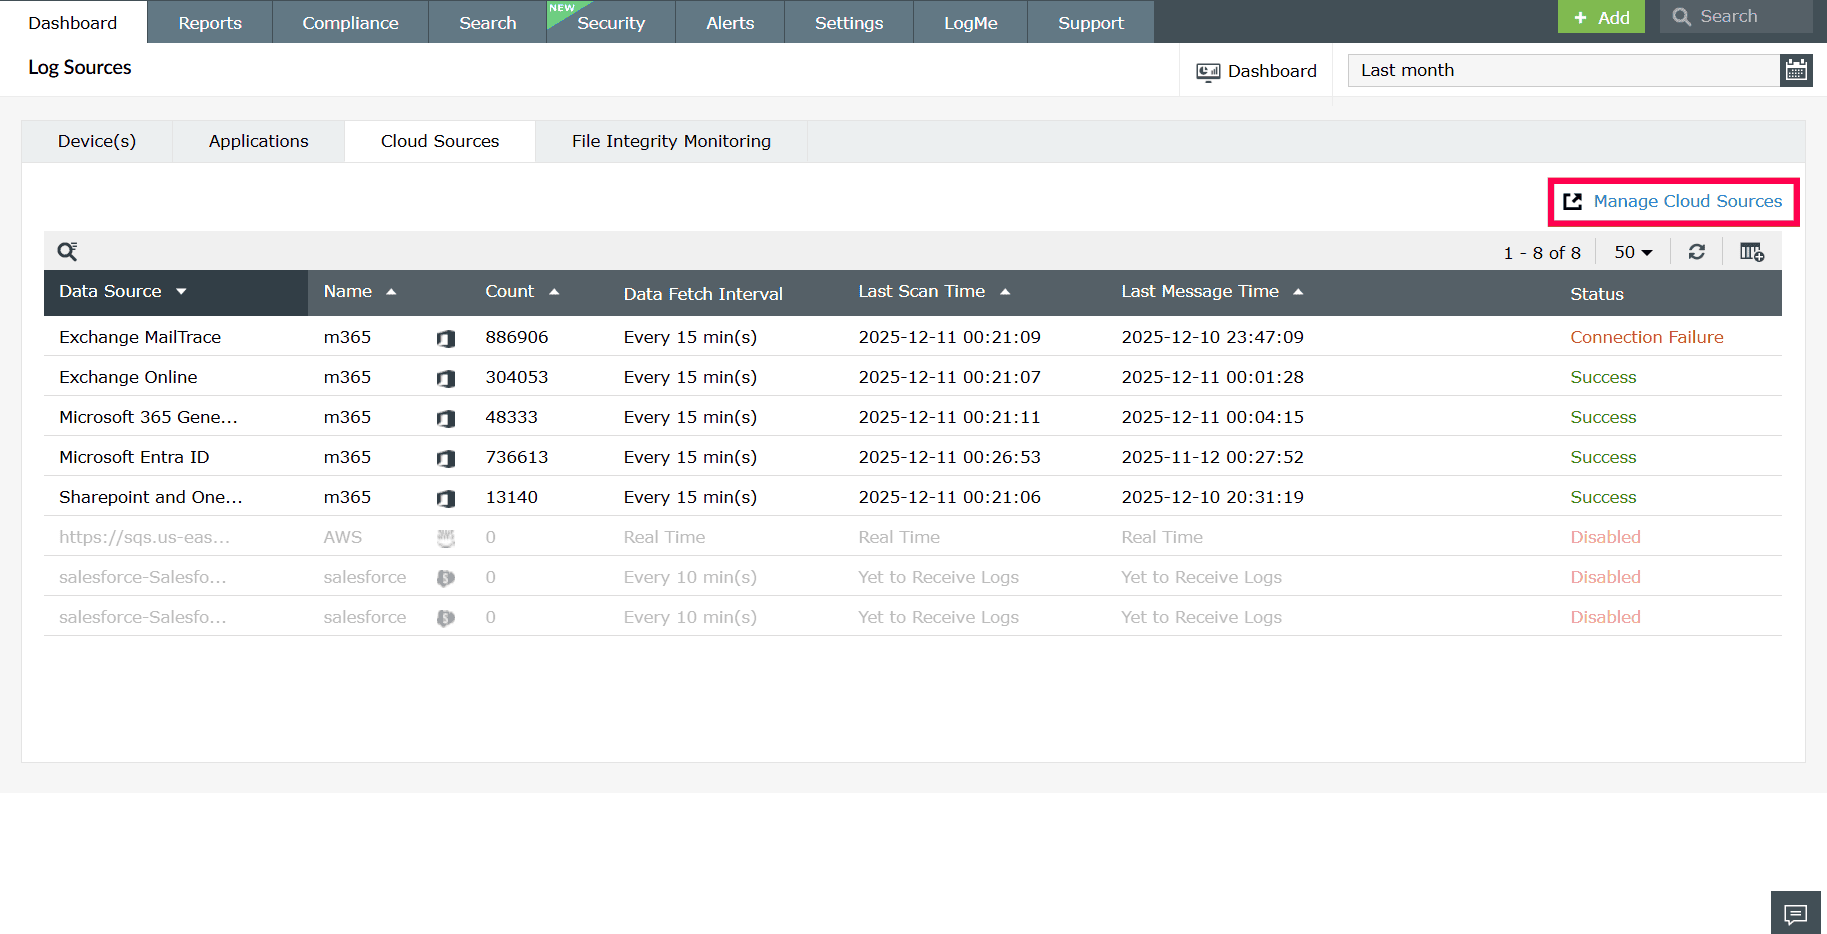
Figure 33: Managing cloud sources - Click the icon to add or remove columns from the table. Select the checkboxes for the fields you want to display and click Apply to update the table.
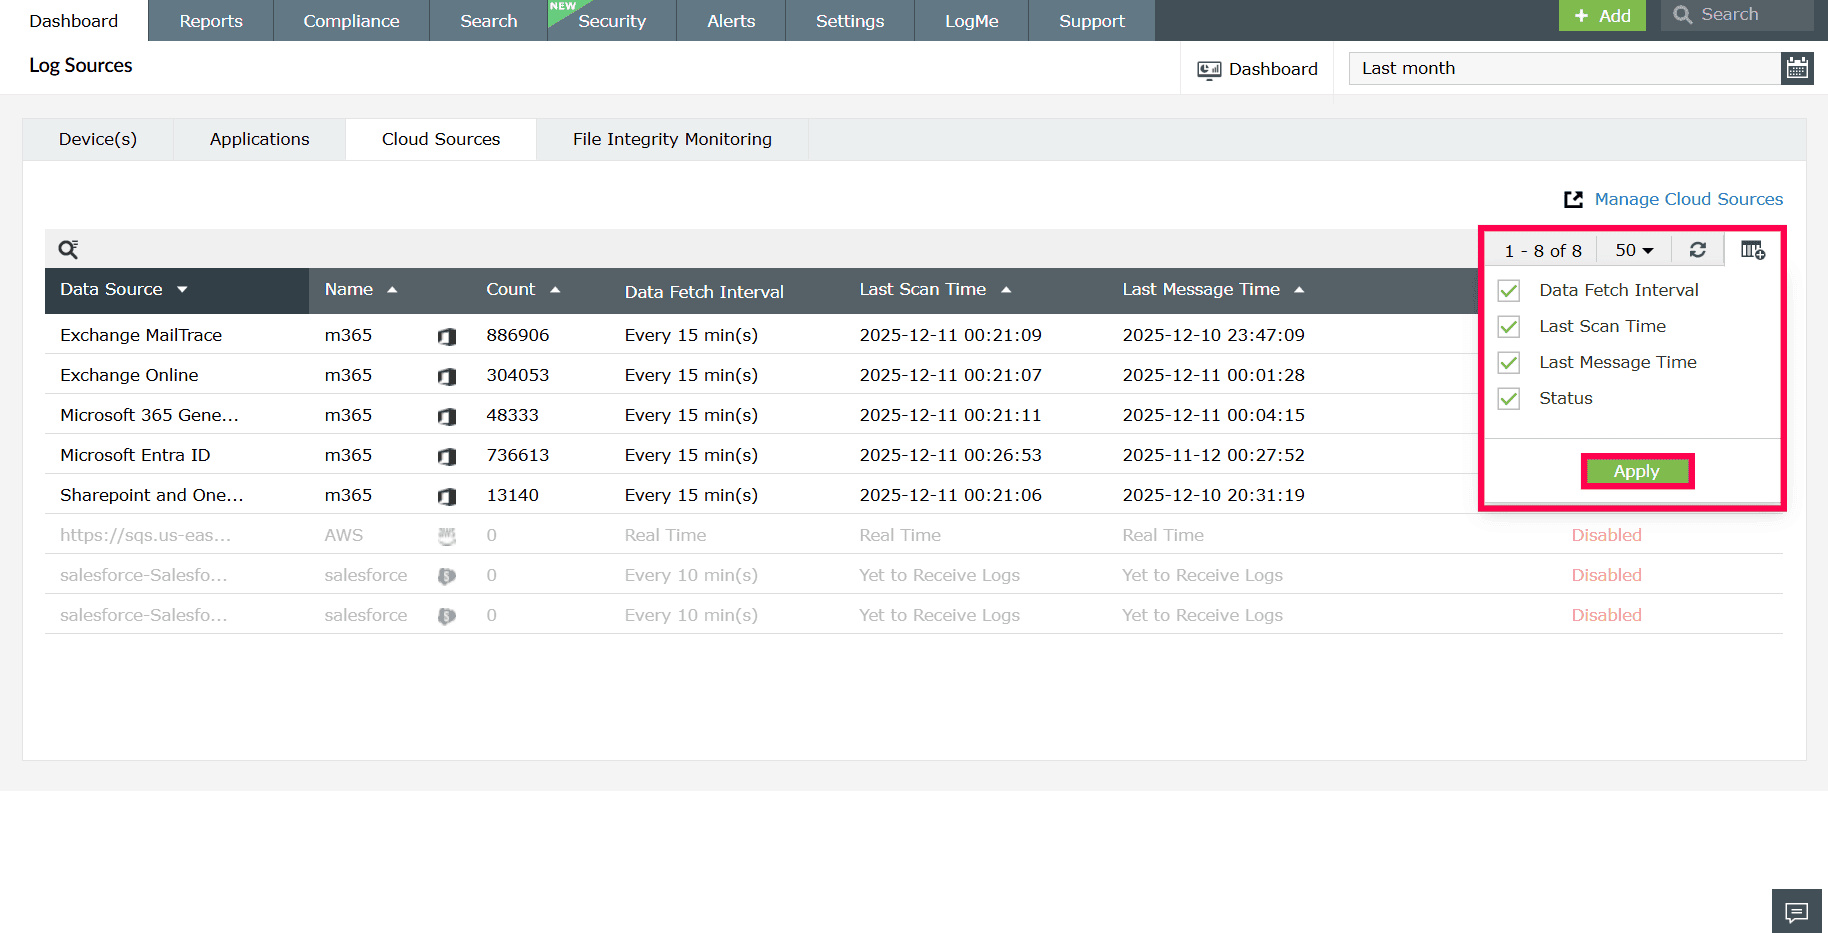
Figure 34: Adding or removing columns - Click the icon to reload the table.
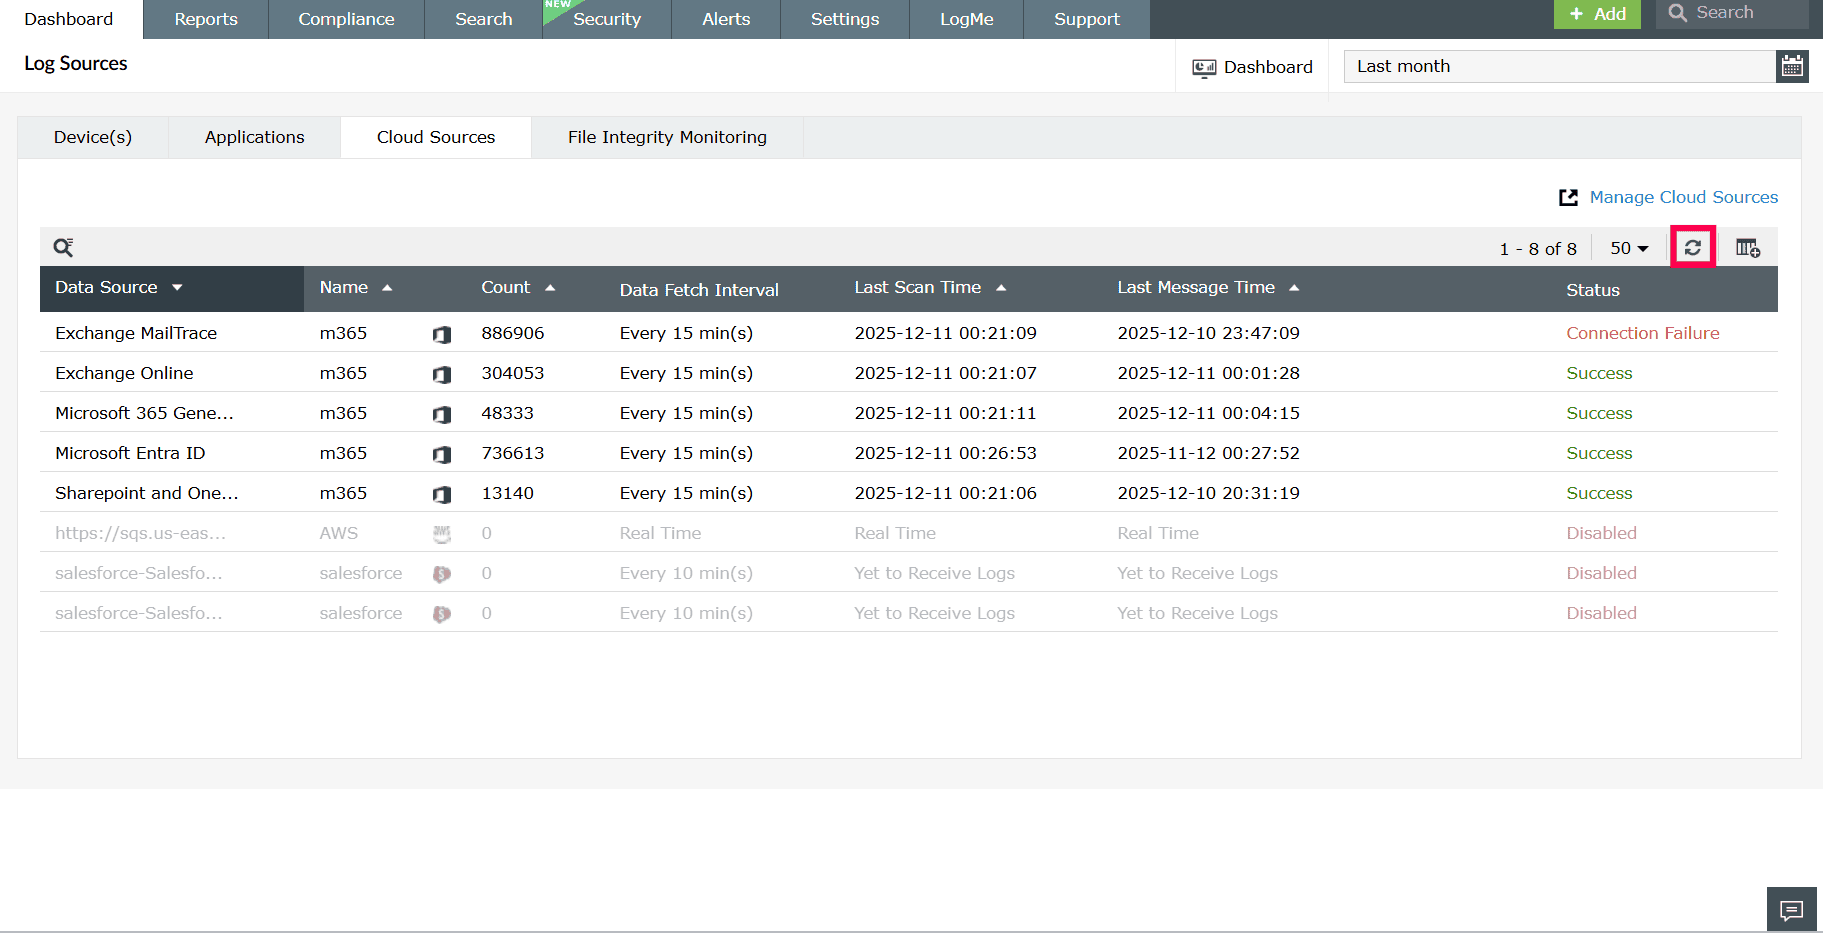
Figure 35: Refreshing the table - The table includes the following fields:
- Data Source: Displays the cloud service or platform from which logs are collected.
- Name: Displays the tenant or integration associated with the cloud source.
- Count: Indicates the total number of logs collected.
- Data Fetch Interval: Displays how often logs are retrieved from the cloud source.
- Last Scan Time: Shows the most recent time the cloud source was scanned for logs.
- Last Message Time: Displays the timestamp of the most recent event received.
- Status: Indicates the status of log collection.
- Hover next to the Last Message Time value to access the
Last 10
Events option and view the most recent events collected for that cloud source.
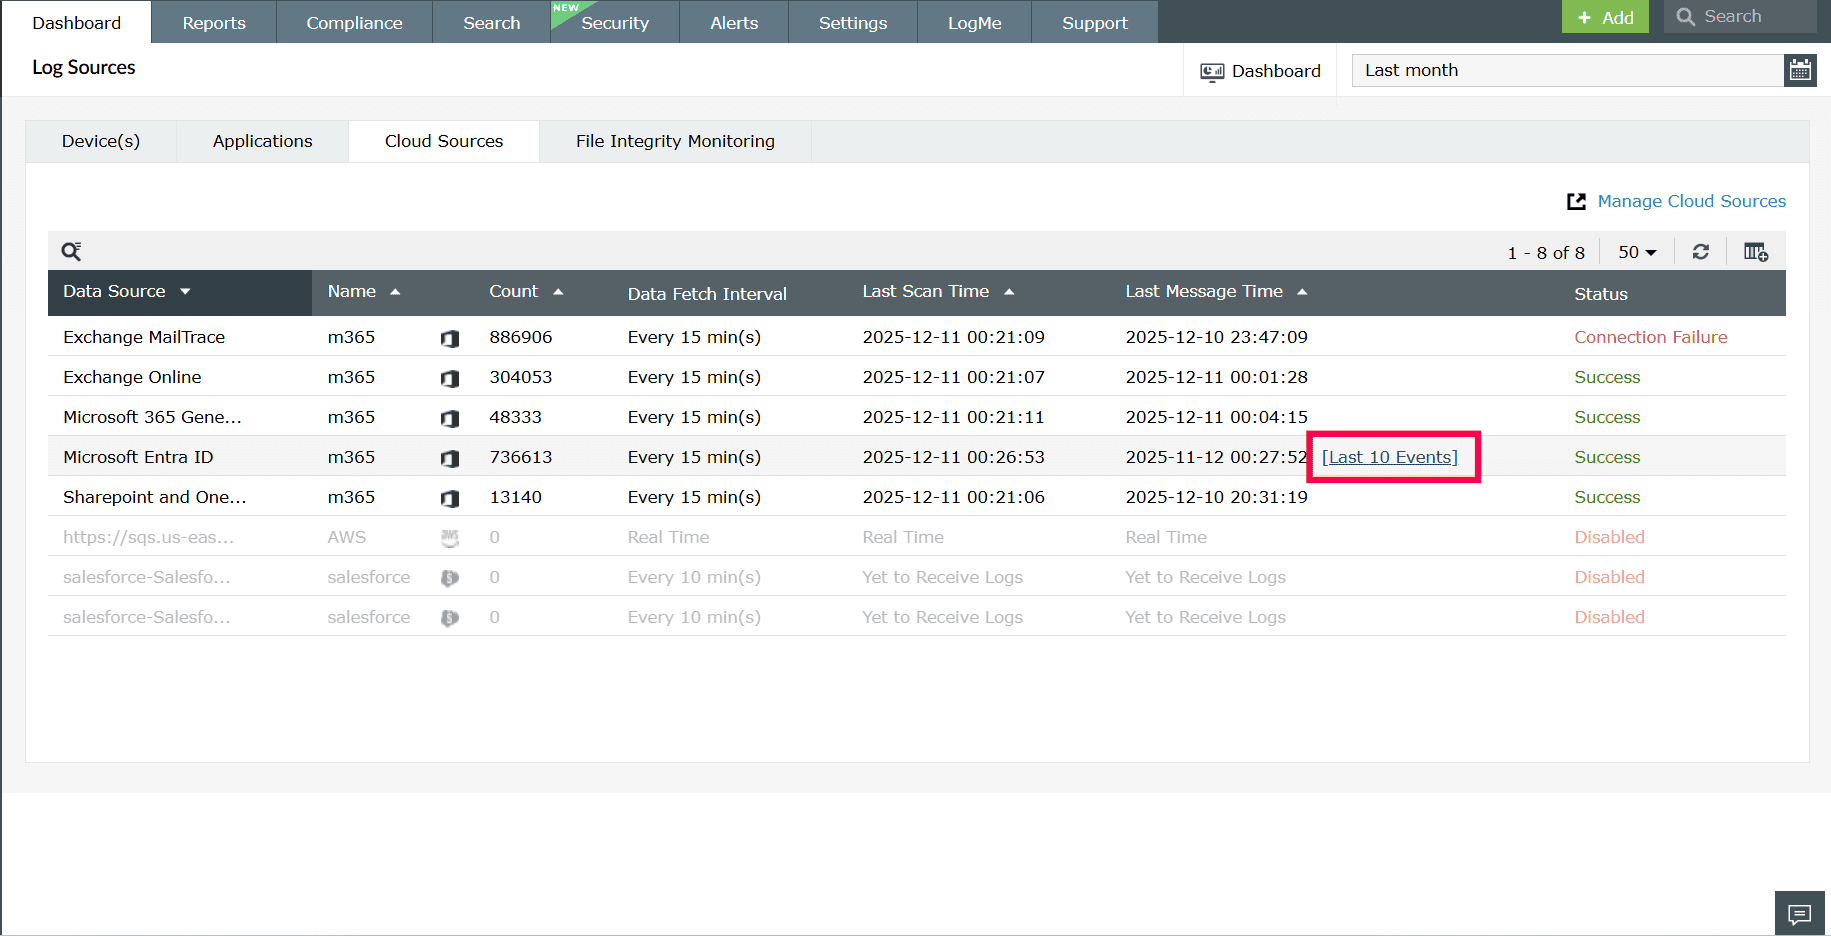
Figure 36: Viewing last 10 events - In the Last 10 Events window, click the icon to customize the fields shown in the event details table. Select the required checkboxes and click Apply to update the view.
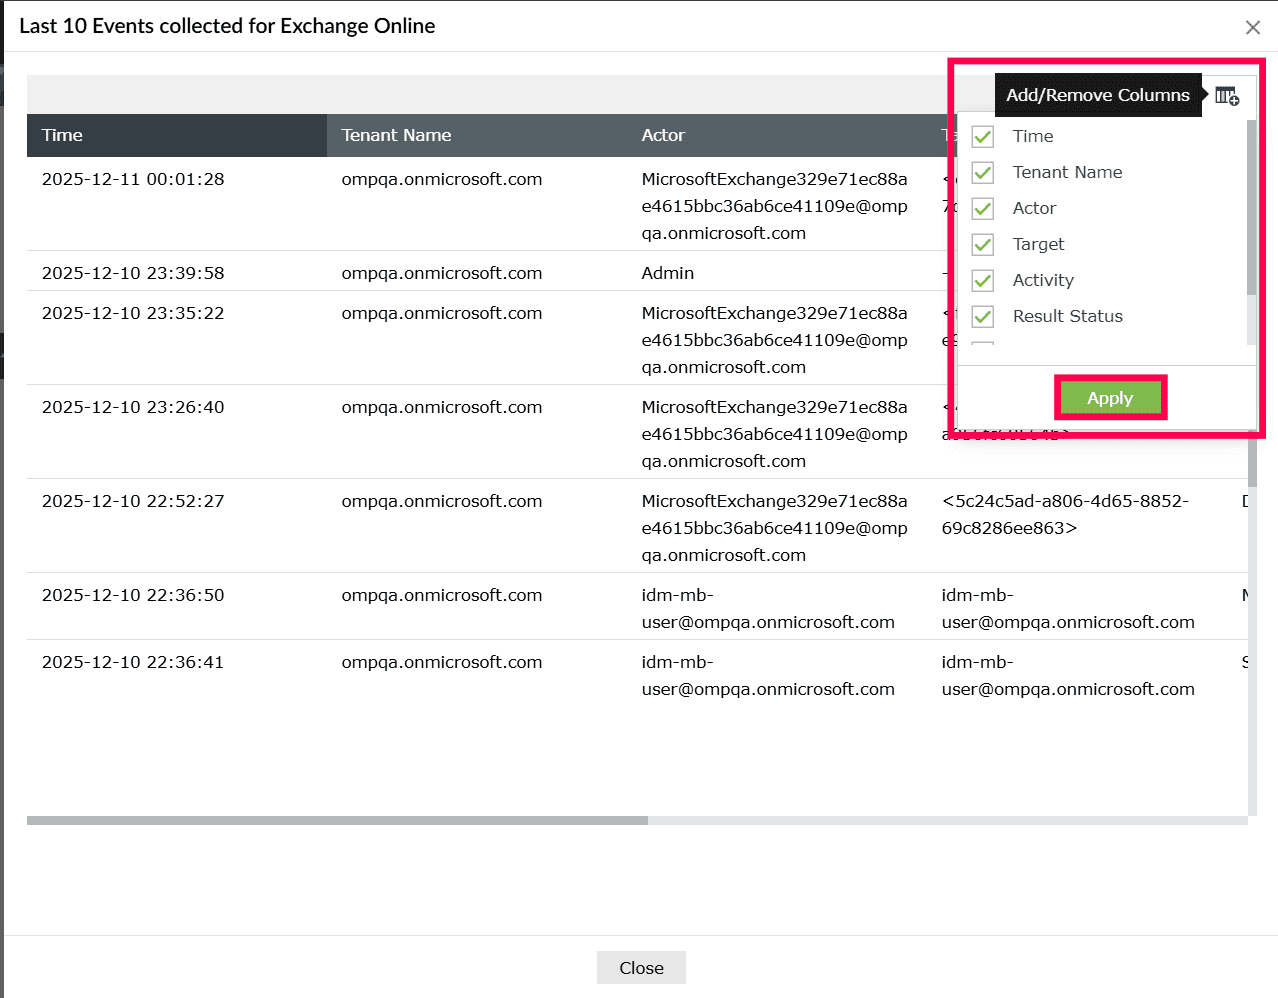
Figure 37: Adding or removing columns - To return to the Cloud Sources tab, click Close.
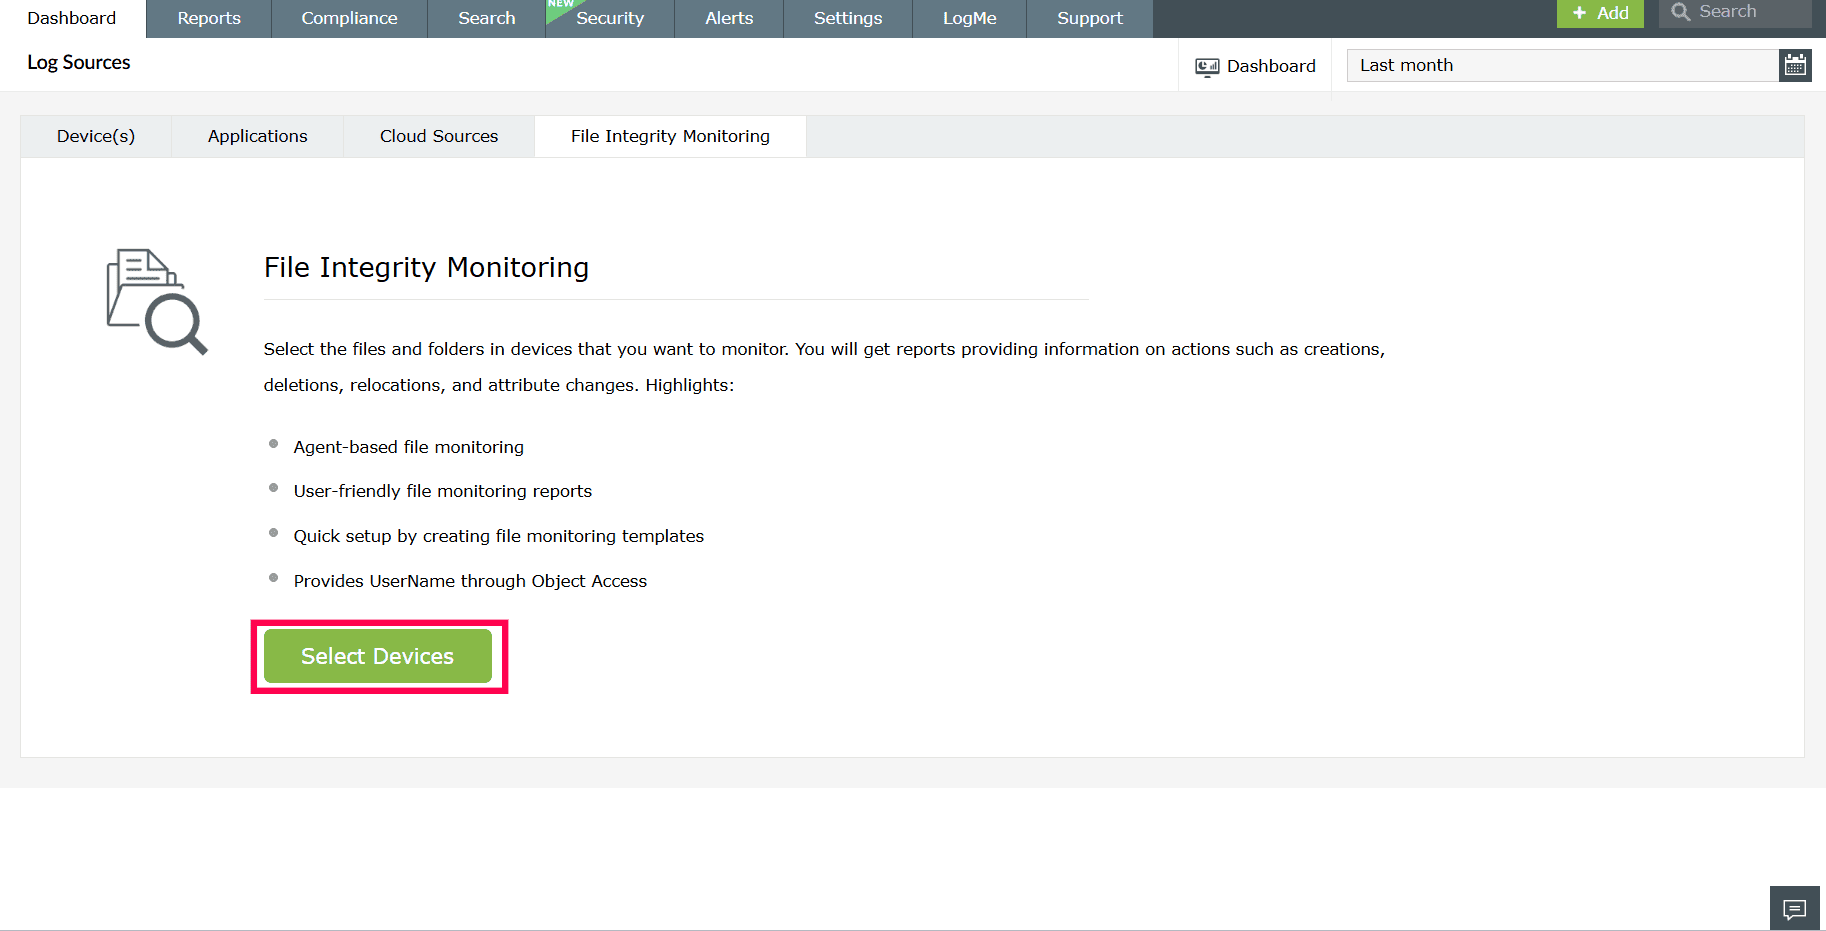
File Integrity Monitoring
Click Select Devices redirects you to the File Monitoring page. Refer to this page for detailed steps on configuring and managing file monitoring.
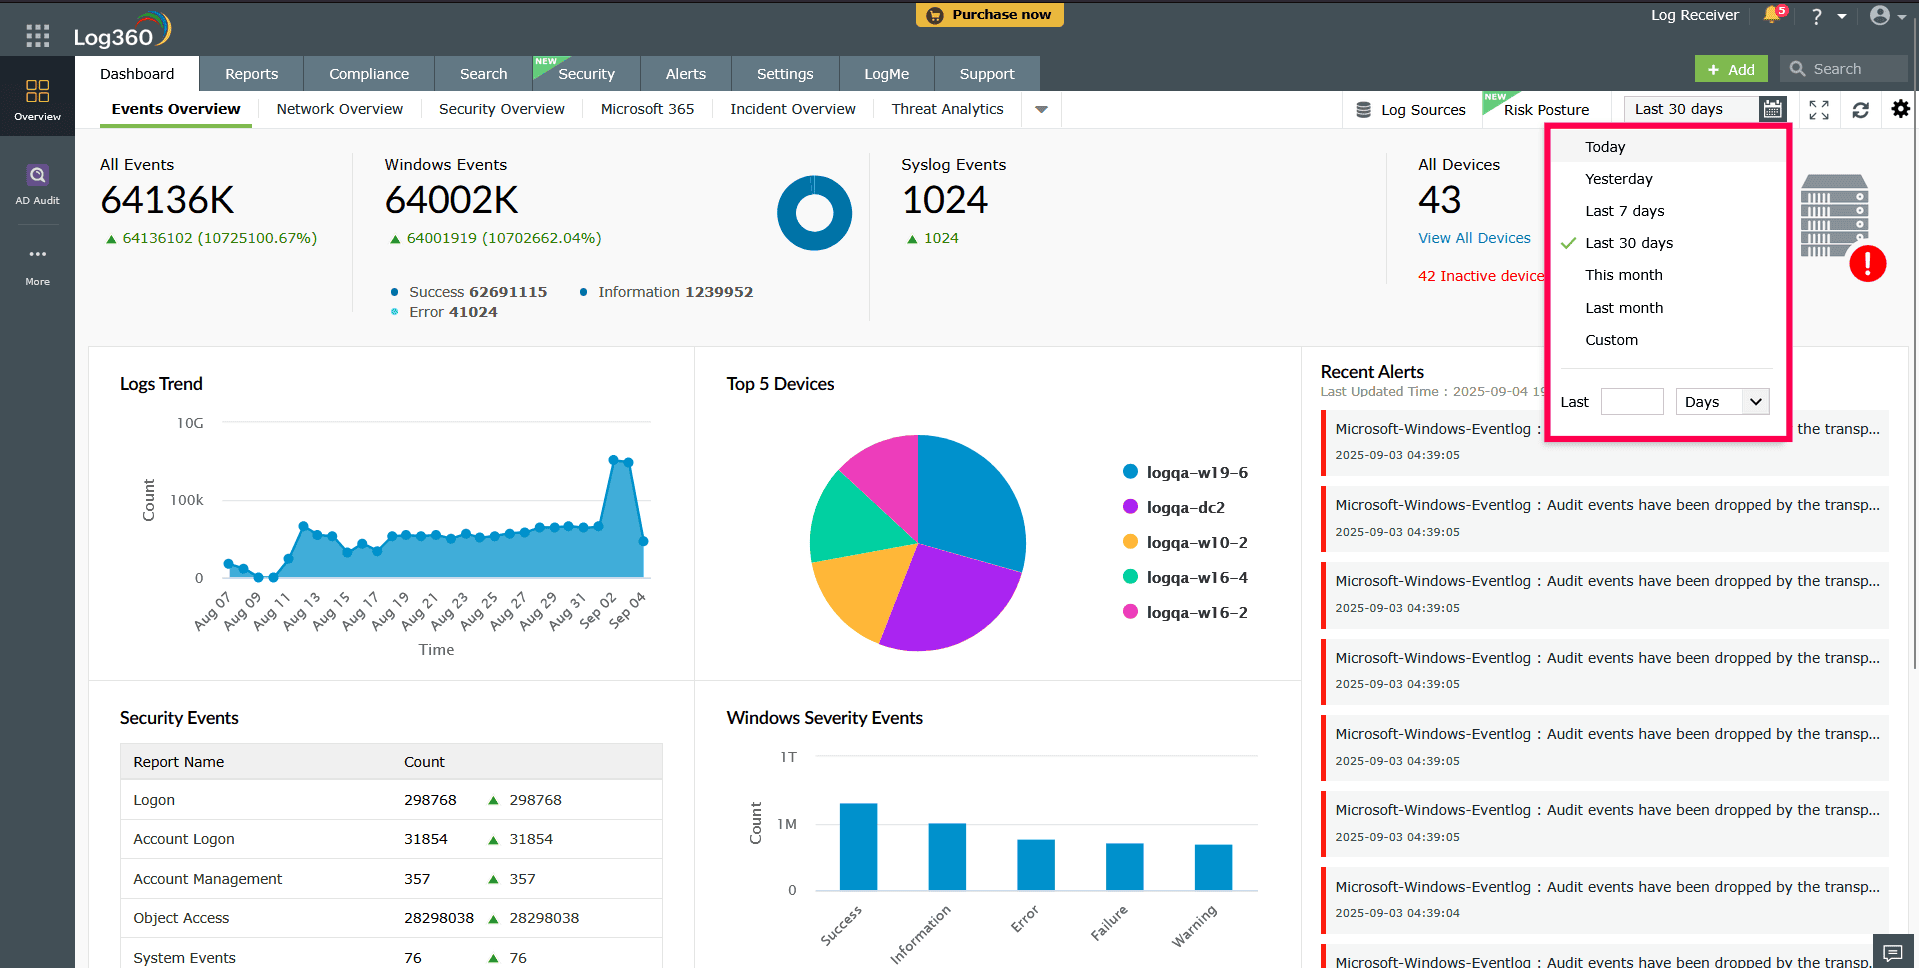
Filtering data by time range
You can filter the data displayed on the dashboard by selecting a time range.
- In the top-right corner of the dashboard, click the
 drop-down.
 - Choose from predefined options such as Today, Yesterday, Last 7 days, Last 30 days, This month, Last month.
- To define your own range, select Custom and specify the From and To dates and times using the calendar and time
fields.
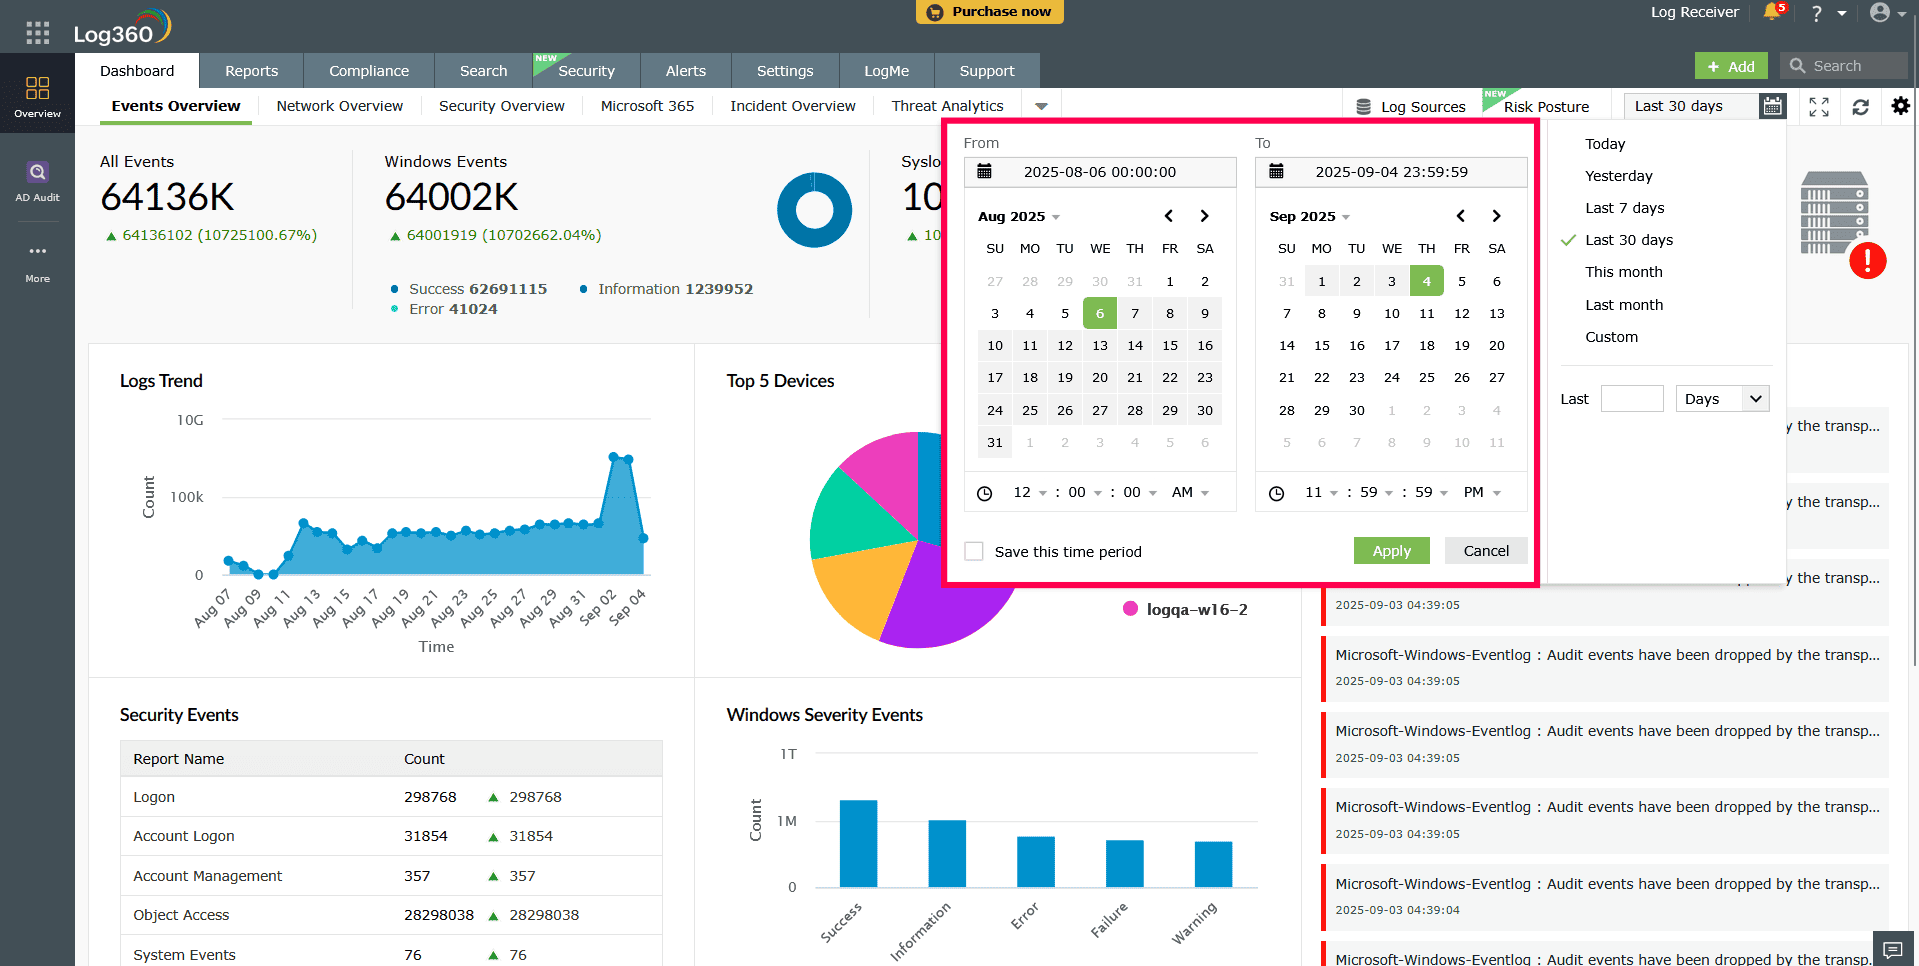
Figure 40: Selecting a time range - Alternatively, you can use the Last field to set a relative time range.
- Click Apply to update the dashboard data for the selected period.
Adding a new tab
To add a new tab to the dashboard,
- In the dashboard, click the
 icon on the top-right corner and select Add Tab.
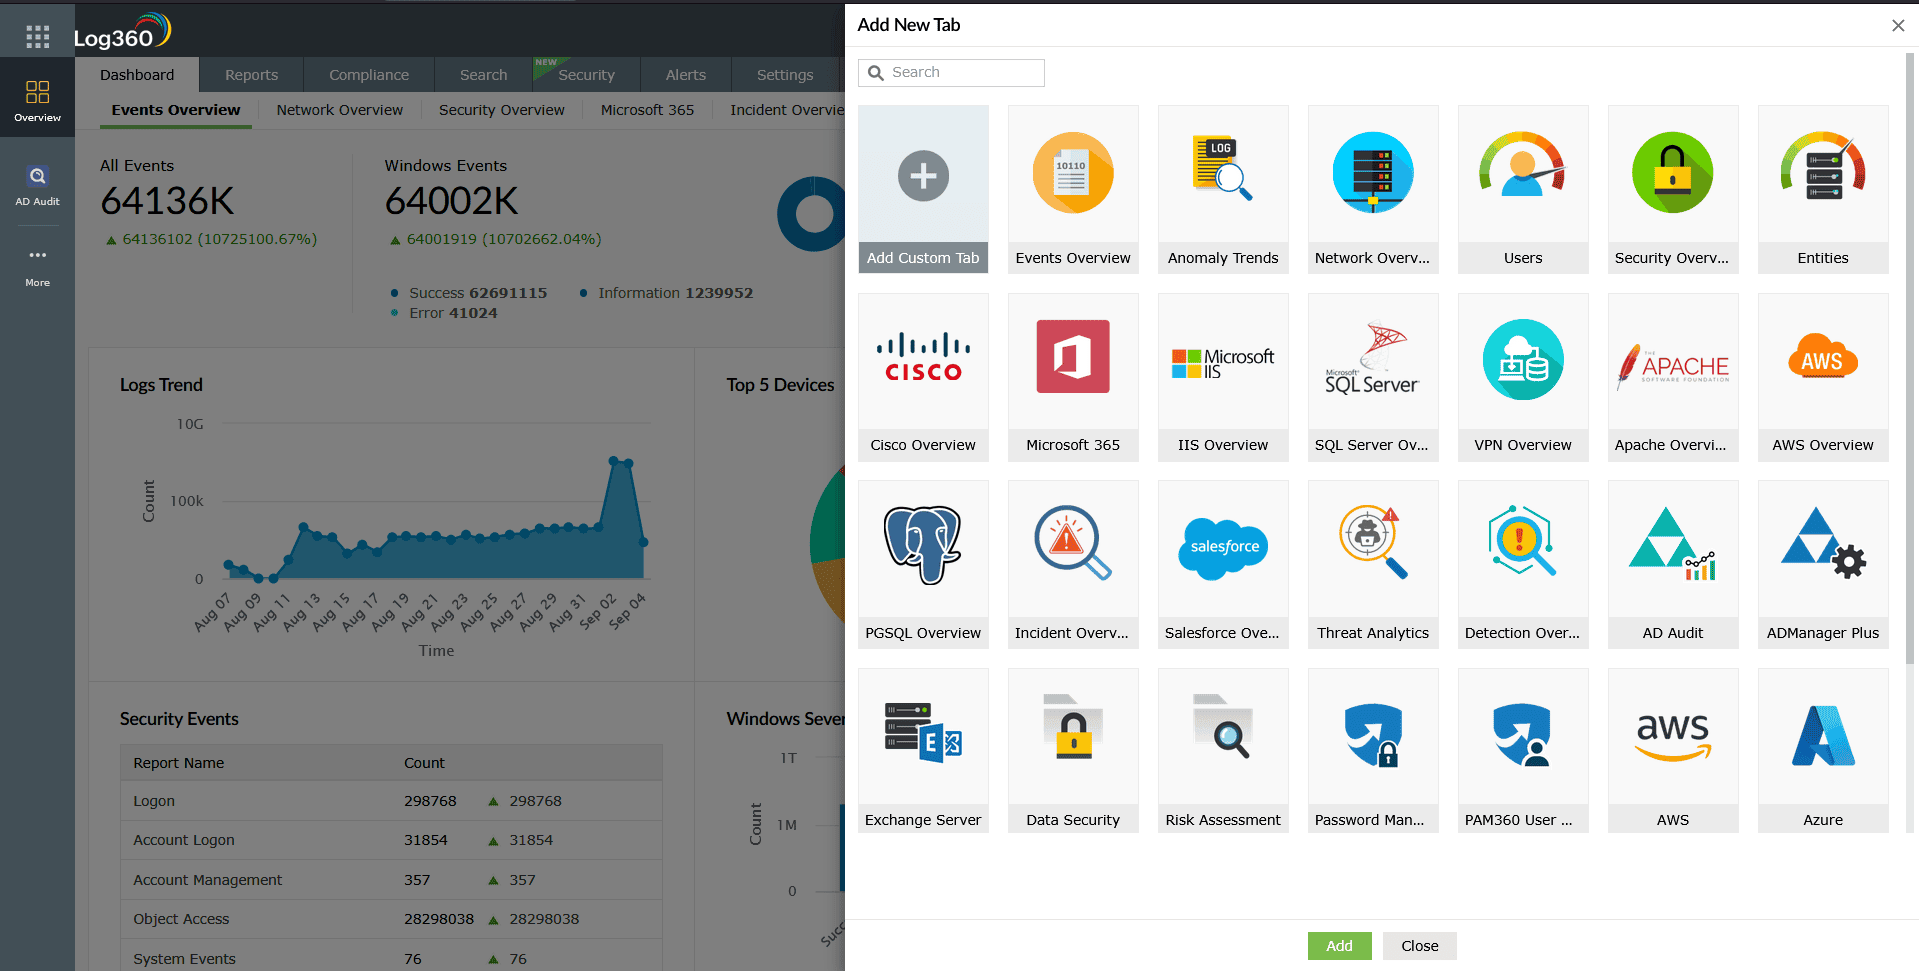
Figure 41: Adding a New Tab in the dashboard - In the pop-up box that appears, you can see the following:
- Default tabs: Events Overview, Network Overview, Security Overview, M365 Overview, Incident Overview, Detection Overview, Threat Analytics, and AD Audit.
- Other predefined templates
- Add Custom Tab option
- Click Add Custom Tab. Enter a name for the tab in the given field and click Add.
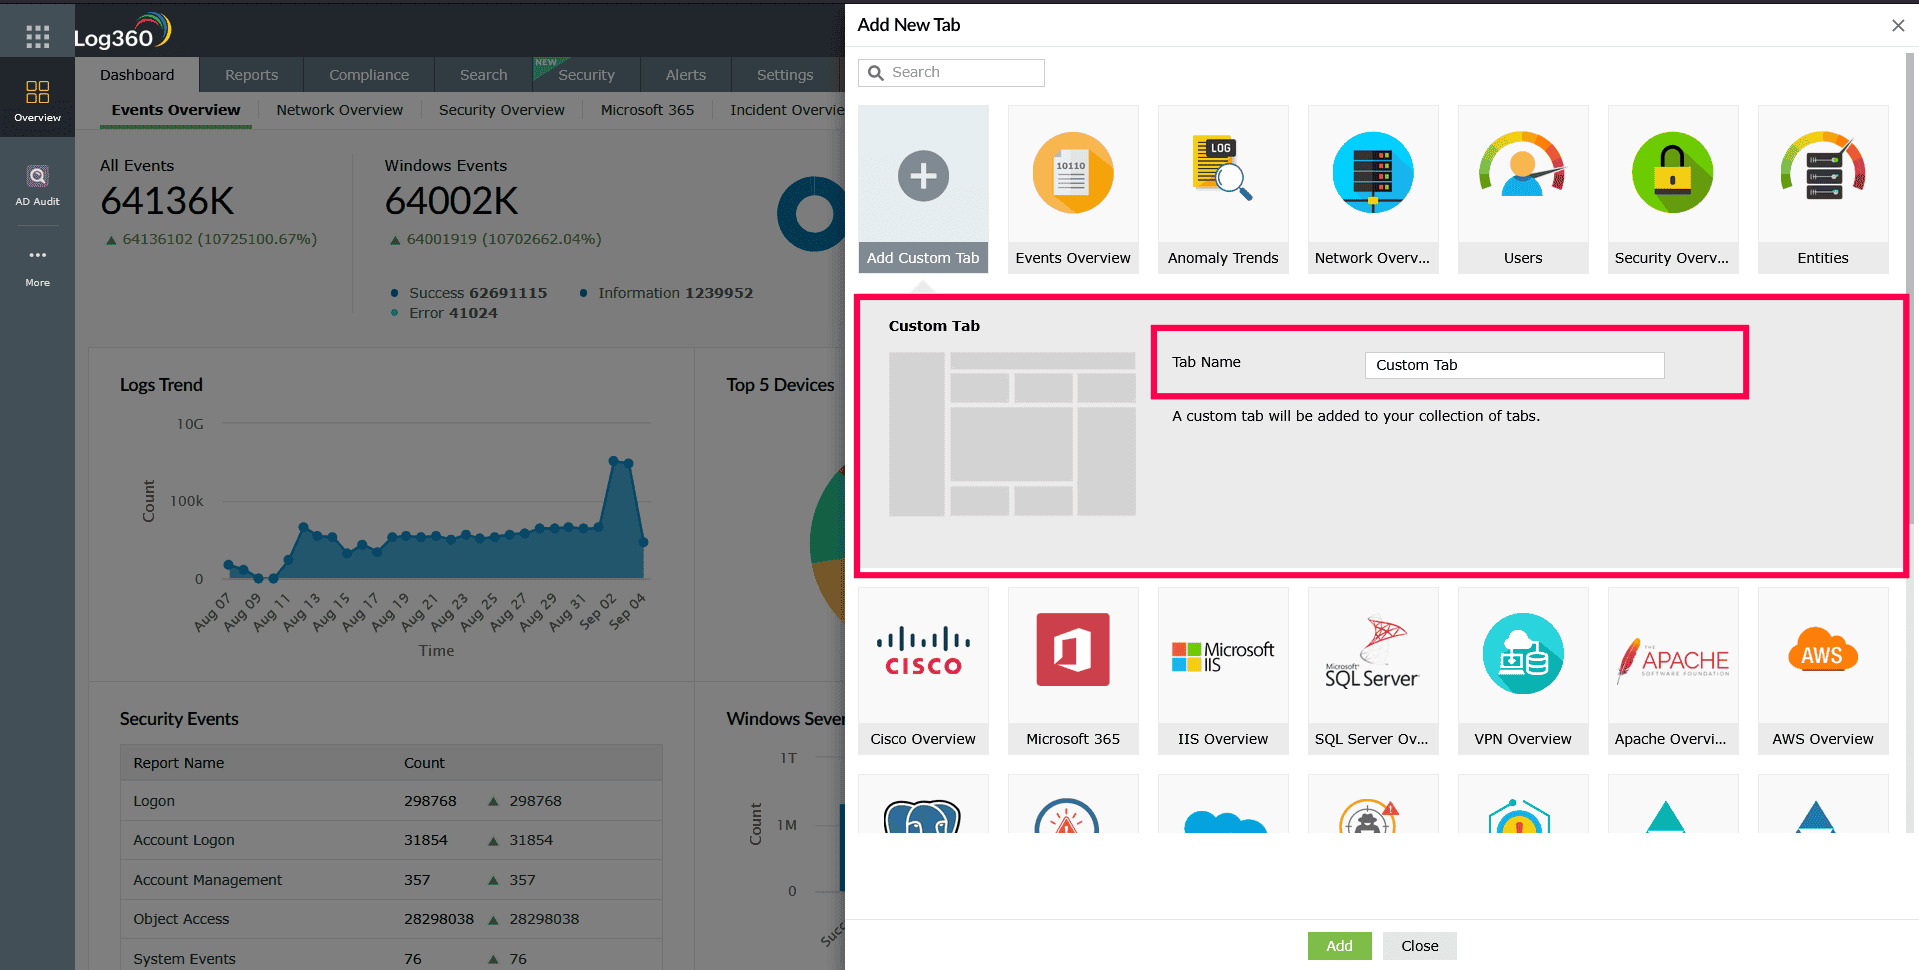
Figure 42: Adding a Custom Tab
Adding a new widget to a tab
To add a new widget,
- In the dashboard, click the icon on the top-right corner and select Add Widgets.
- In the Add New Widget window, choose a component from the Select Component drop-down.
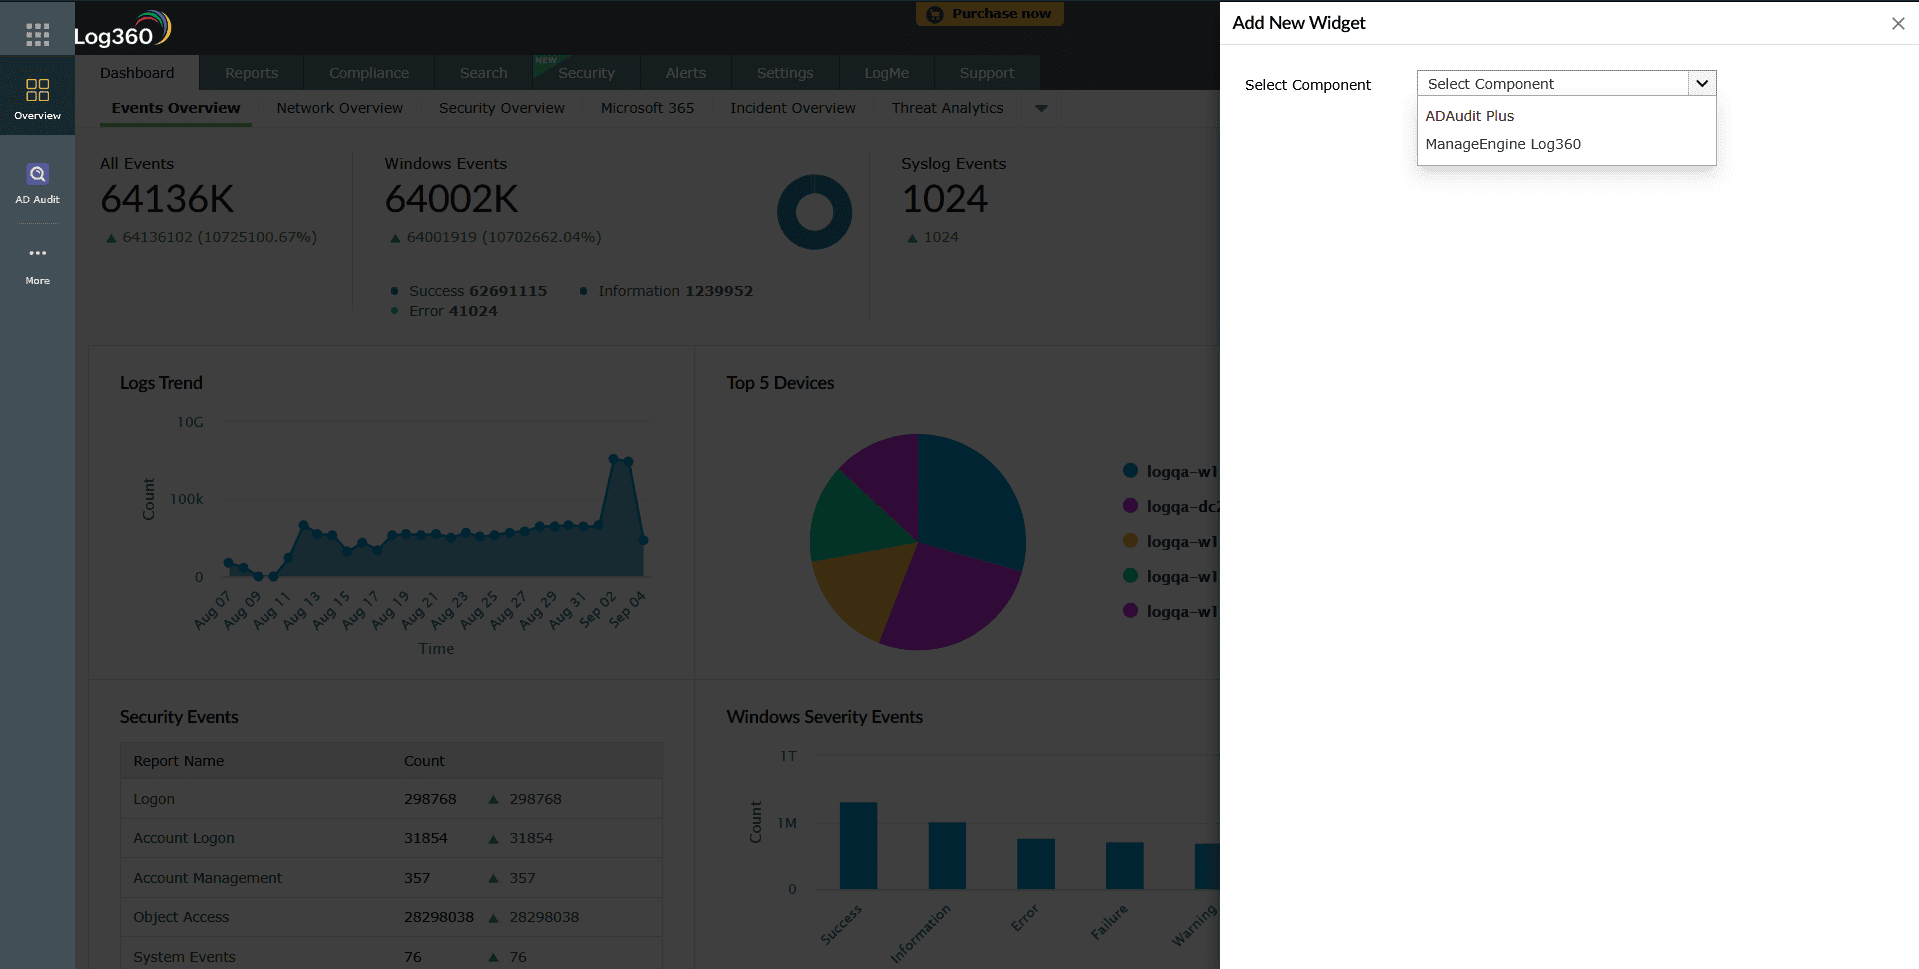
Figure 43: Selecting a component - Specify the widget, widget type, chart type, chart color, and provide a display name for the widget.
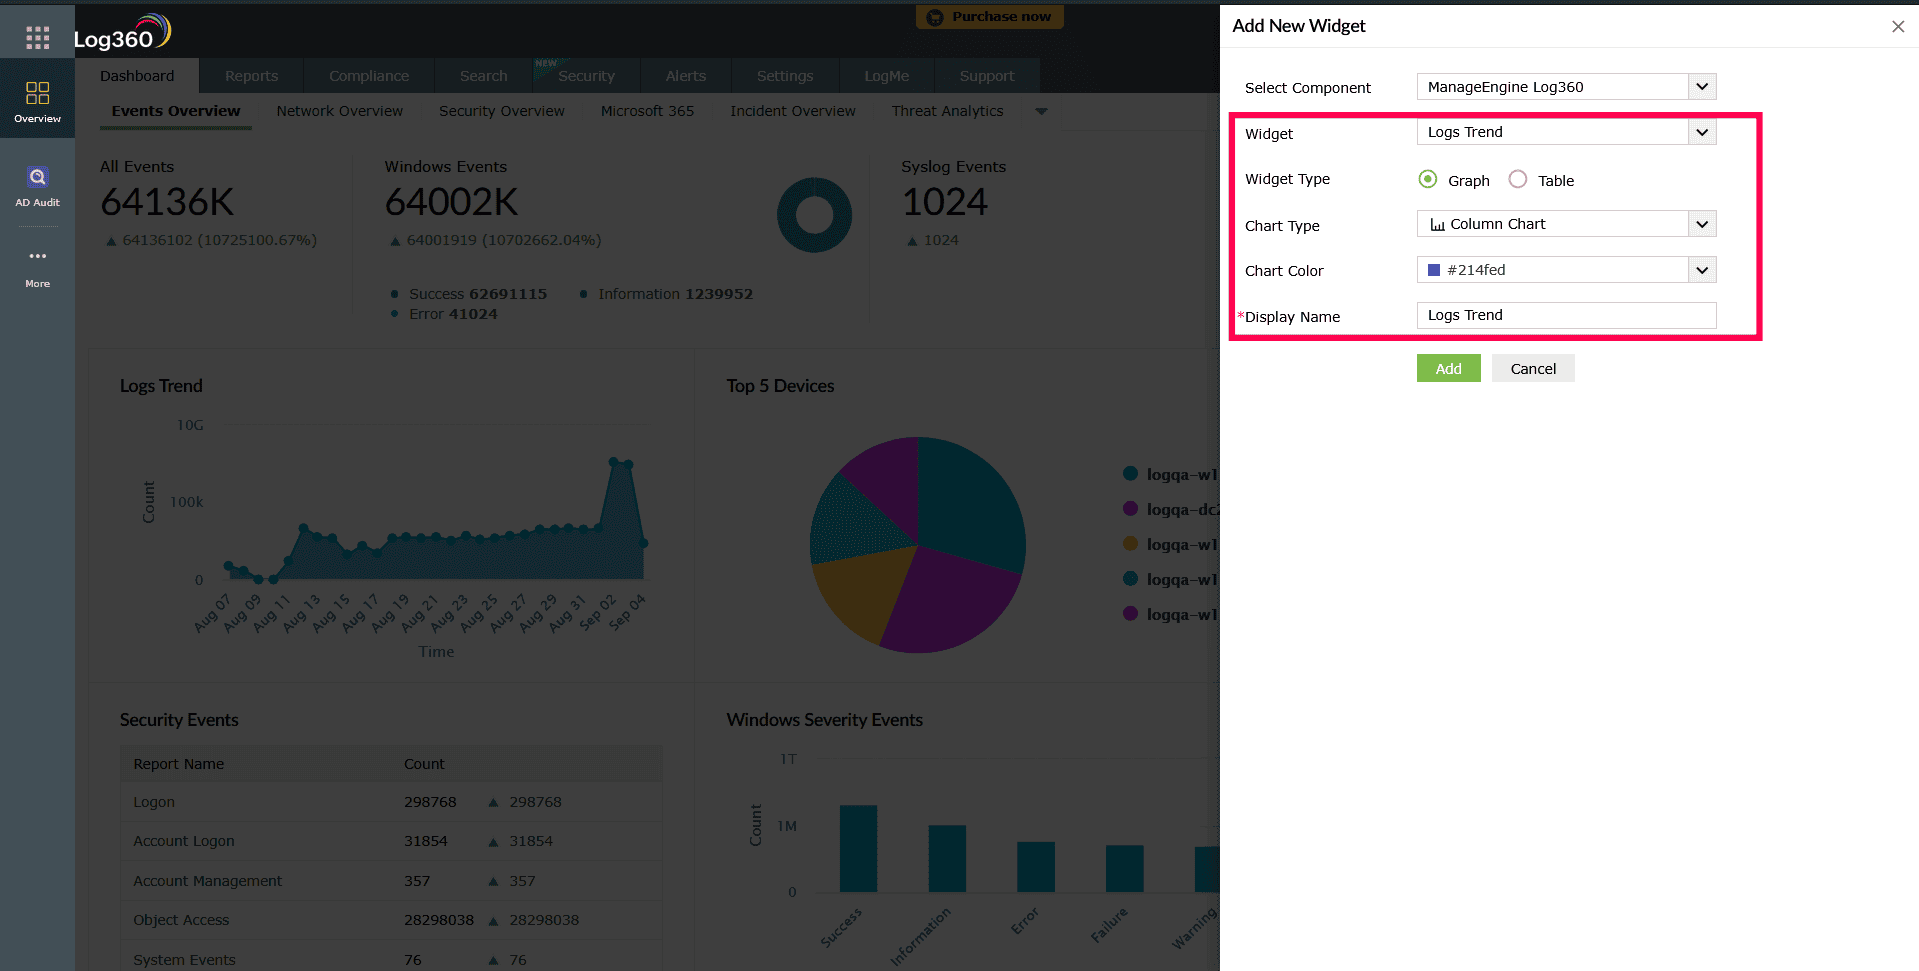
Figure 44: Configuring a New Widget in the dashboard - Once configured, select Add to save the widget.
Editing, deleting and reordering tabs
To delete tabs from the dashboard,
- In the dashboard, click the icon on the top-right corner and select Manage Tabs.
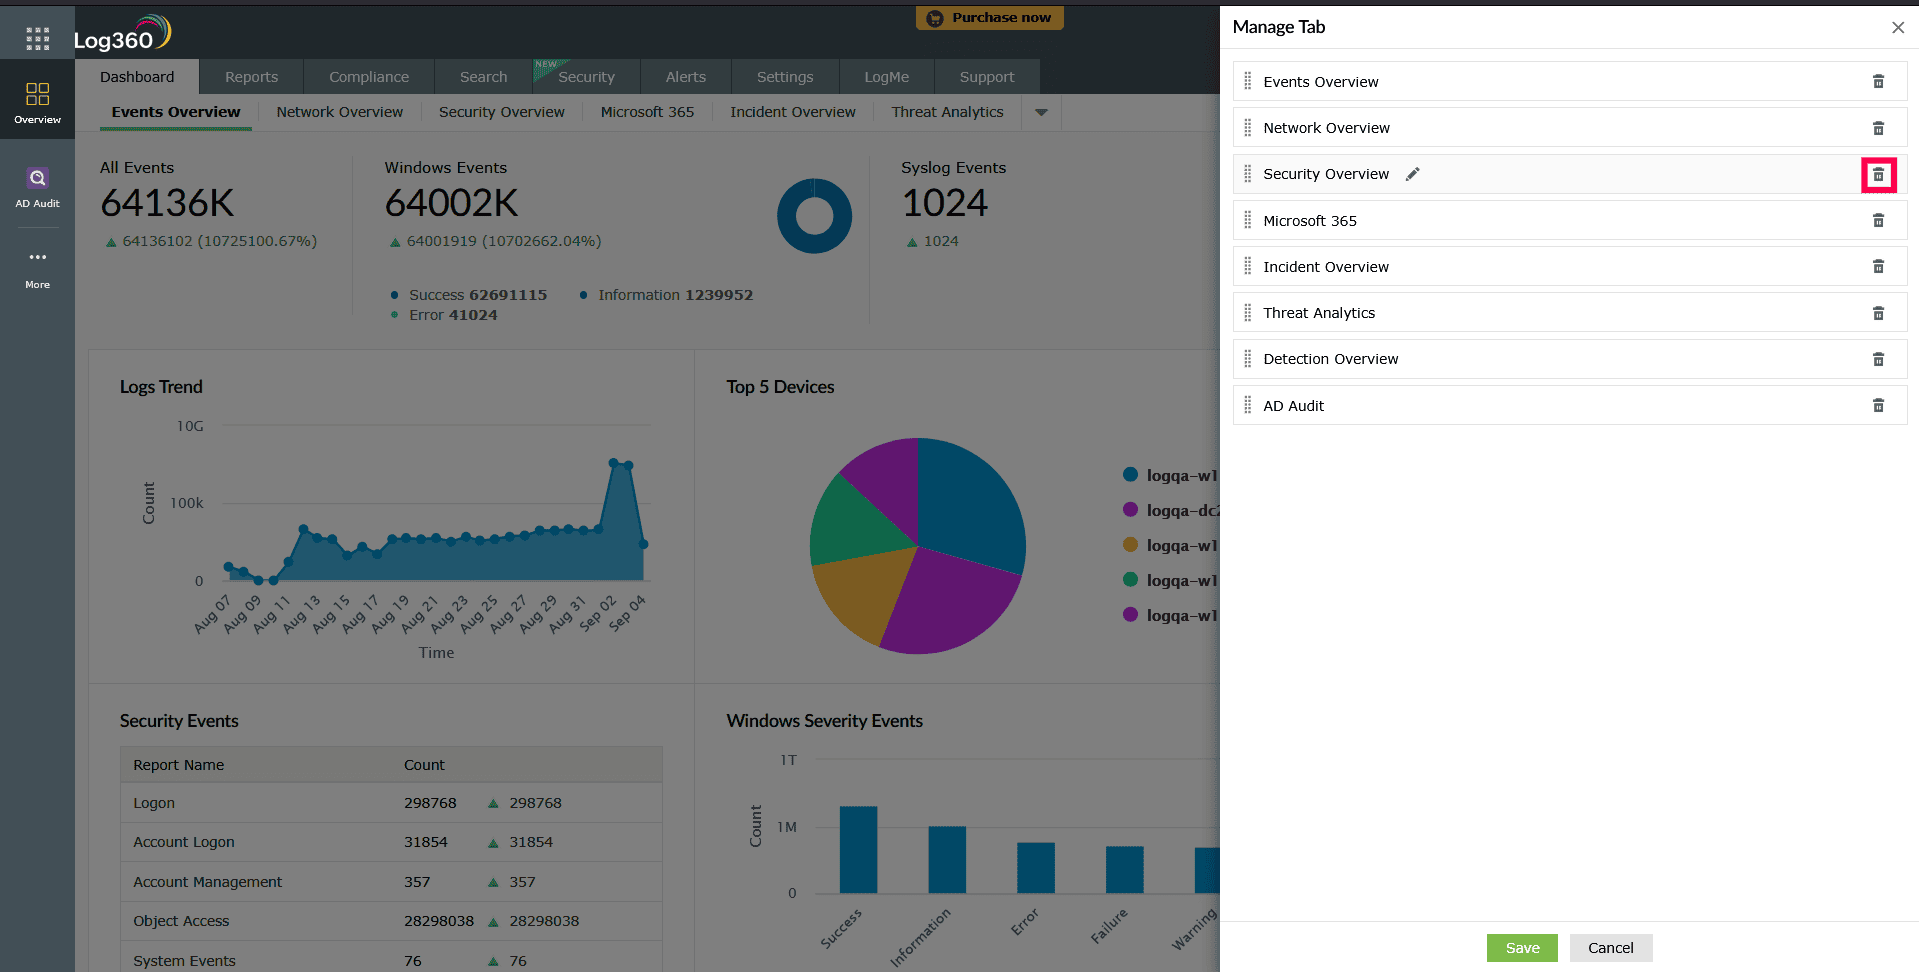
Figure 45: Deleting tabs in the dashboard - In the Manage Tab dialog box that appears, click the
 icon corresponding to that tab that you want to delete.
 - In the pop-up confirmation box, click Yes to confirm the deletion of the tab.
- Click Save to apply the changes to the dashboard.
To reorder the tabs in the dashboard,
- In the dashboard, click the icon on the top-right corner and select Manage Tabs.
- Click the
 icon and drag and drop the tabs in the order of your choice.
 - Click Save to apply the changes to the dashboard.
To edit a dashboard tab:
- In the dashboard, click the
icon on the top-right corner and select Manage Tabs.
- Hover over the tab you want to edit and click the edit icon.
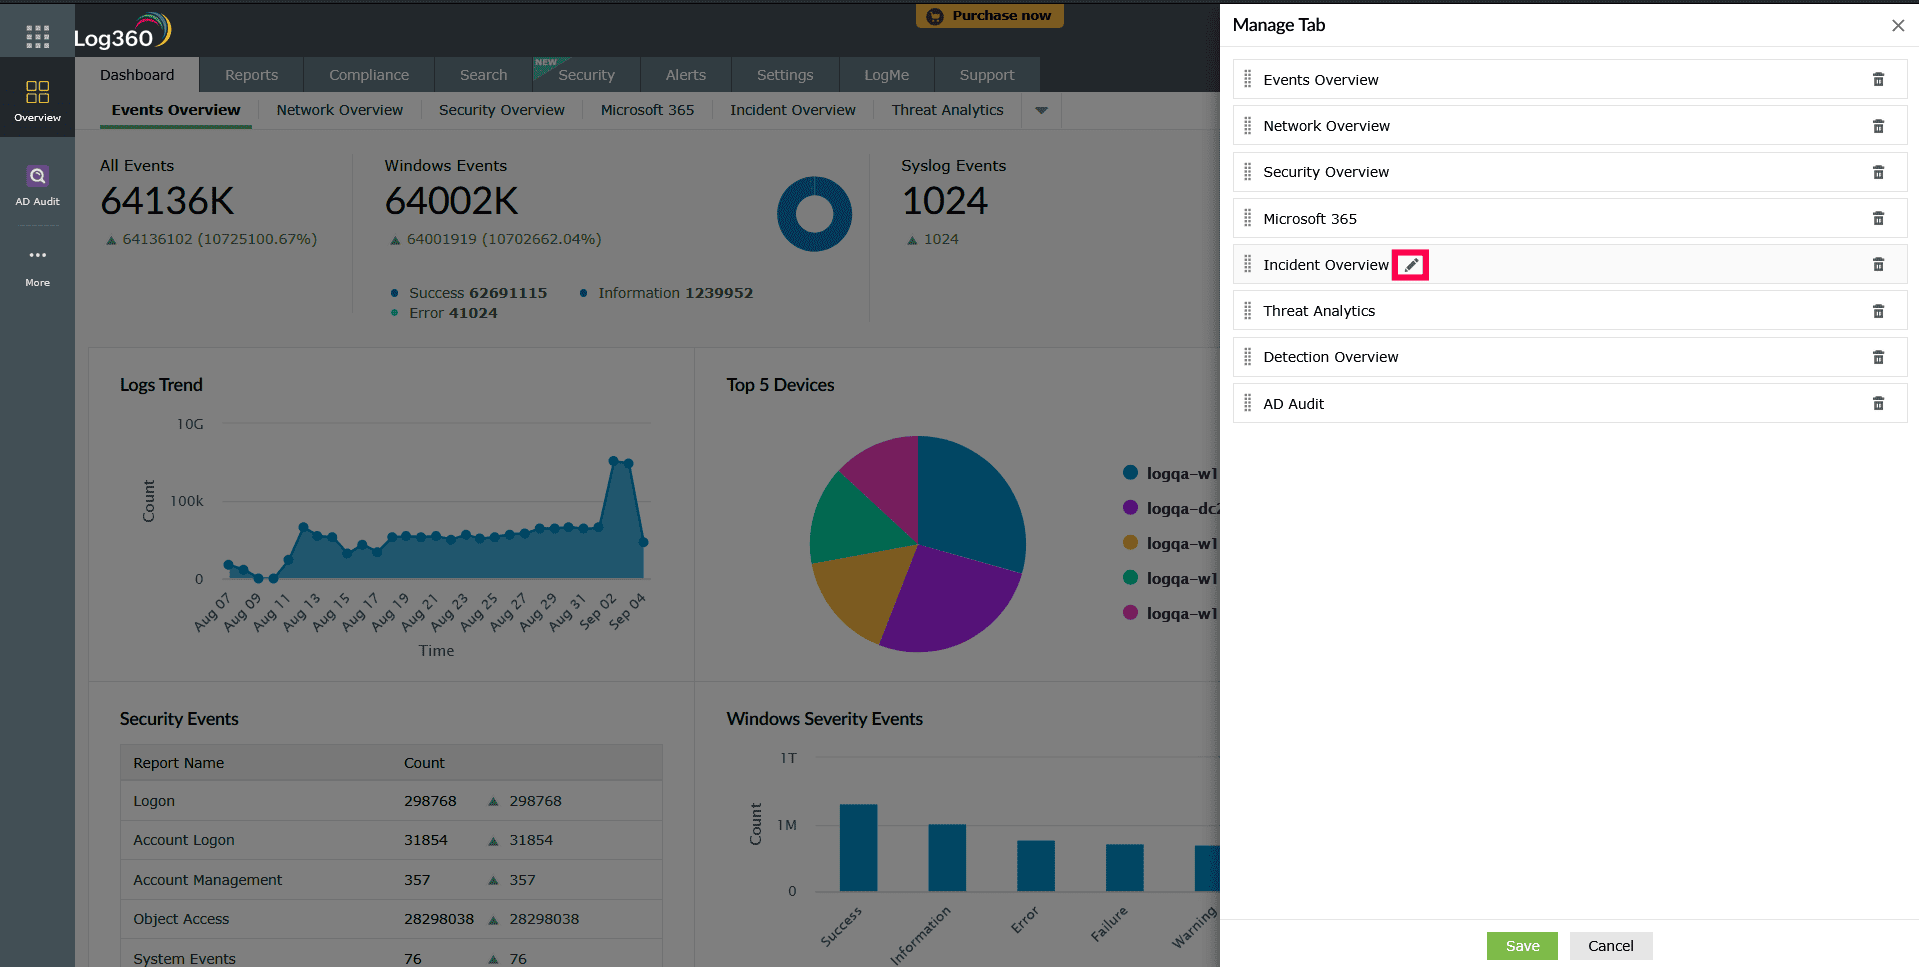
Figure 46: Editing a dashboard tab - Modify the tab name and click the
 icon to confirm.
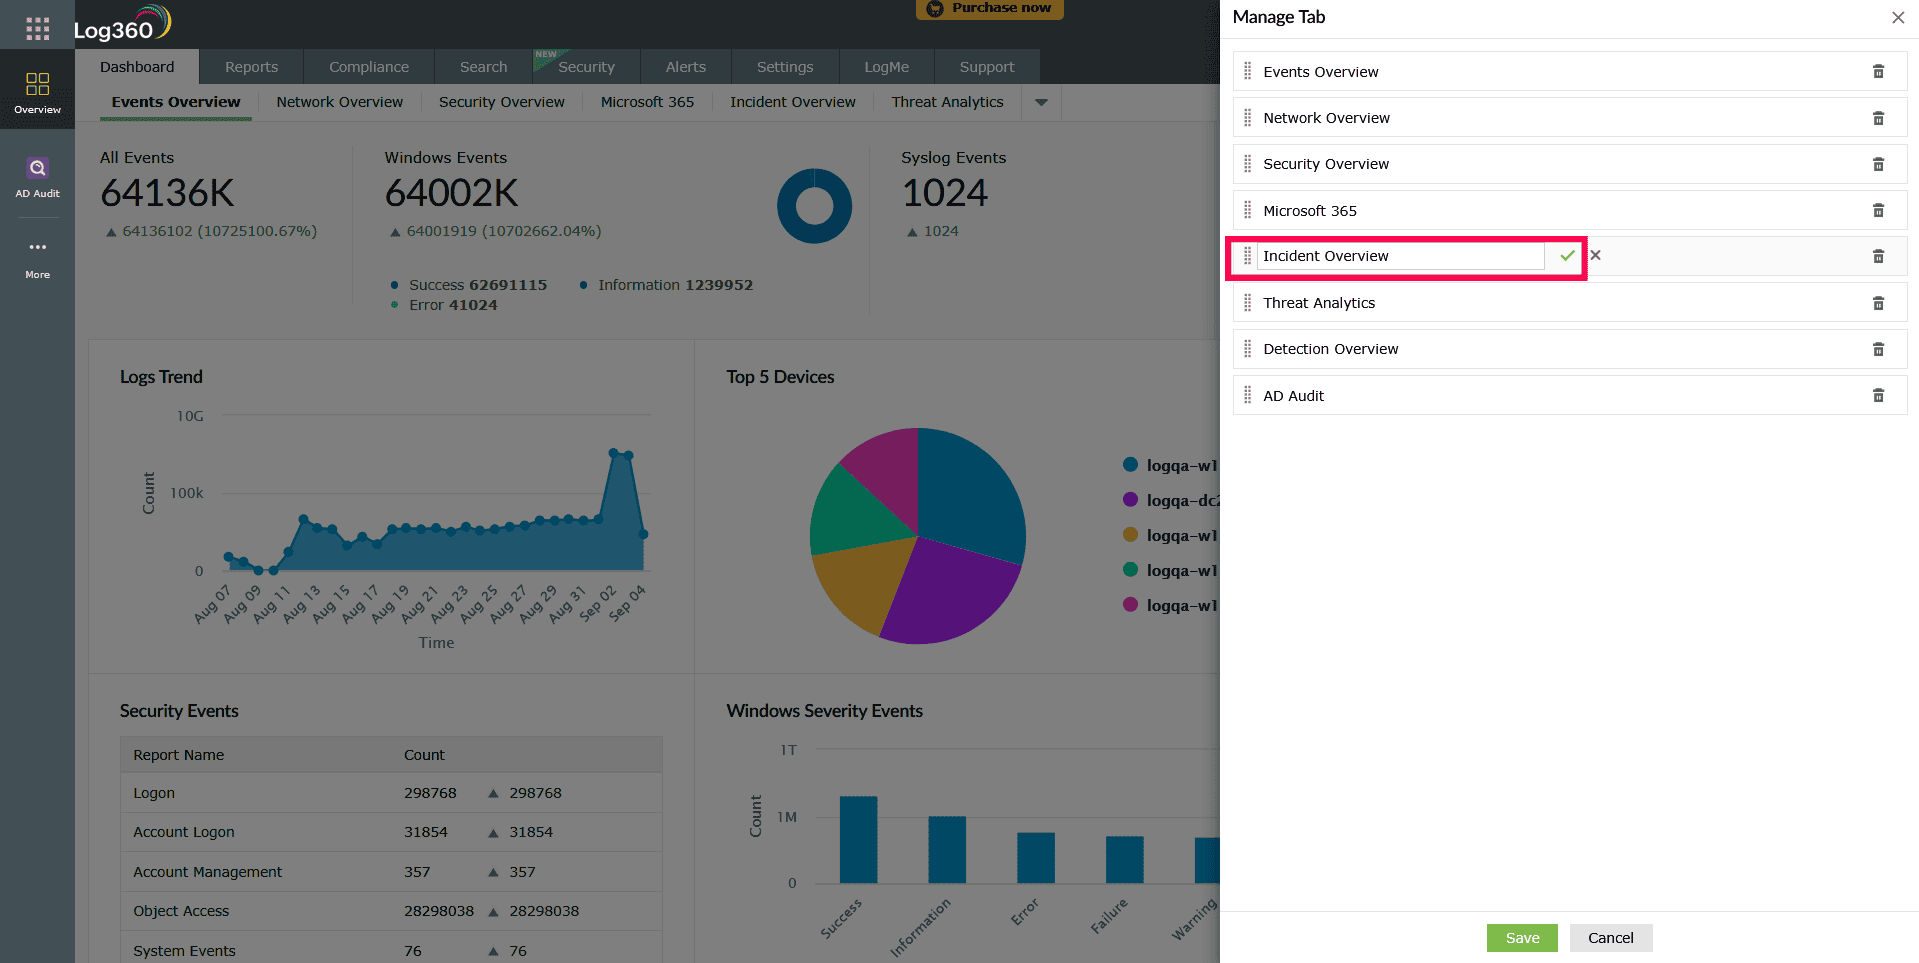
Figure 47: Modifying the tab name - Click Save to apply the changes to the dashboard.
Reordering and resizing widgets
To reorder the widgets in a tab,
- In the dashboard, go to the tab containing the widgets you want to reorder.
- Click the icon on the top-right corner and select Reorder Widgets.
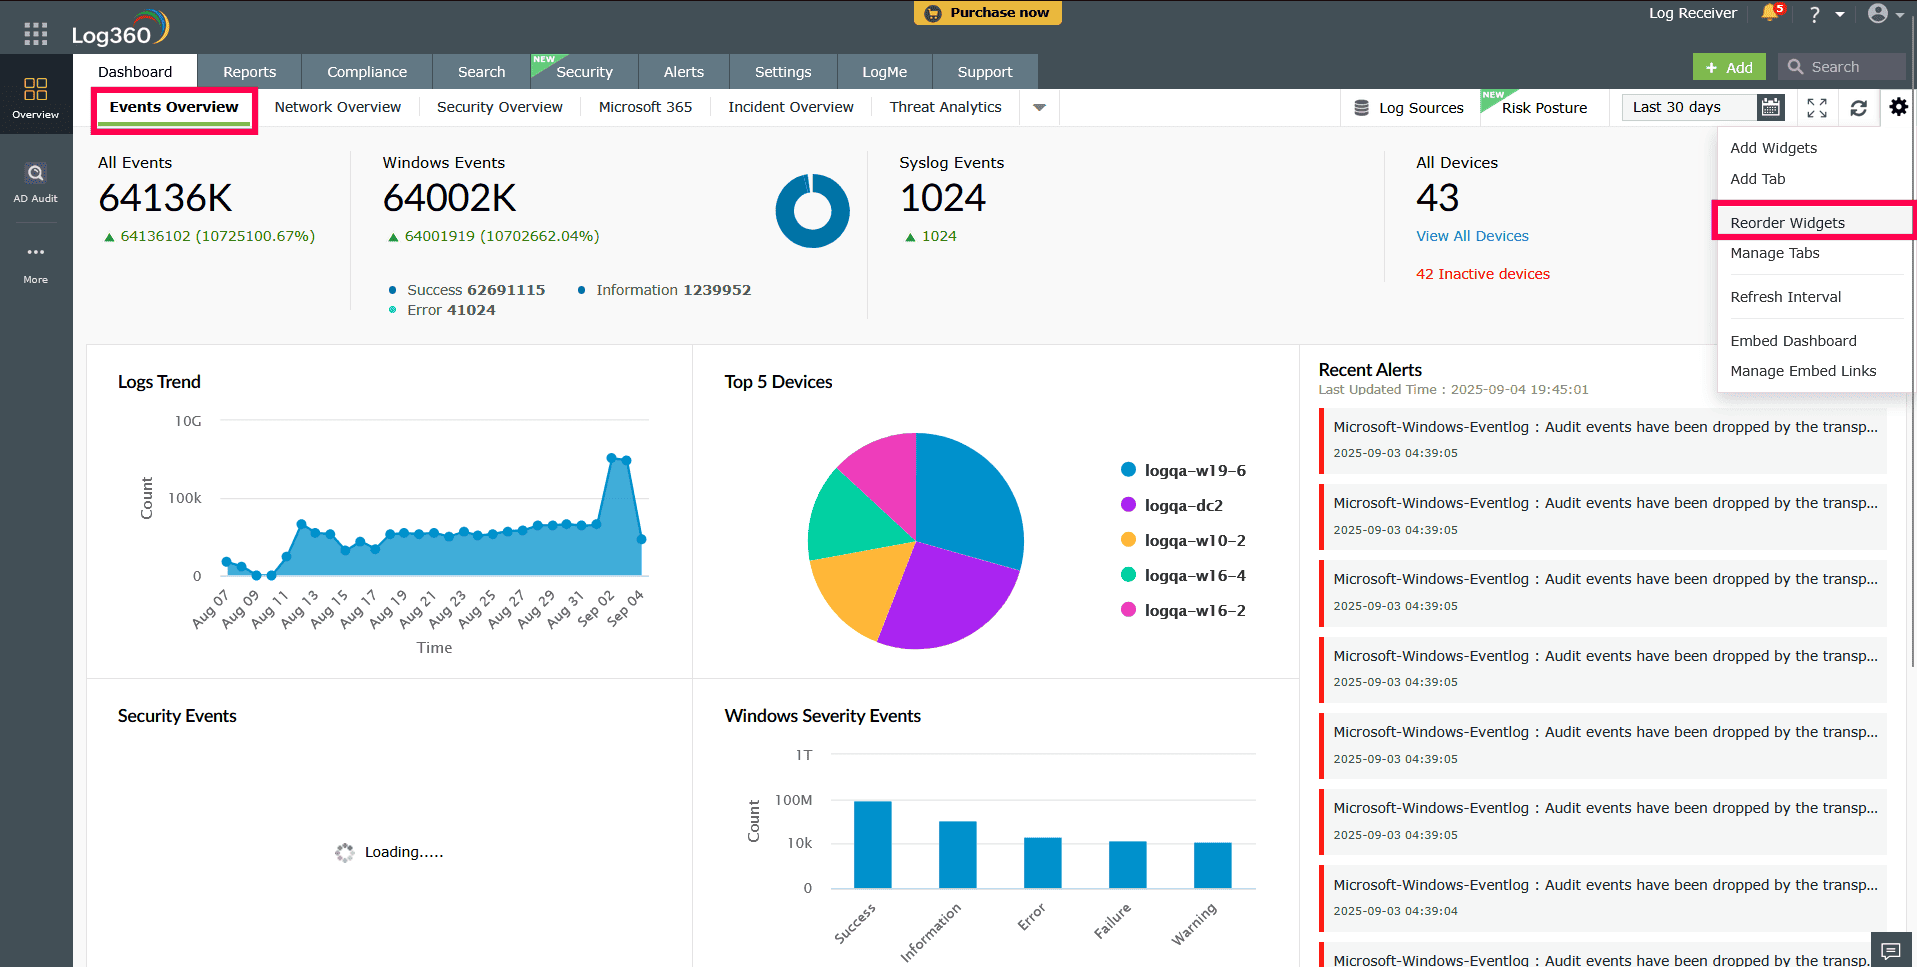
Figure 48: Reordering widgets in the dashboard - Click and drag the widgets to your desired positions.
- Click Save in the top-right corner to apply the changes to the dashboard.
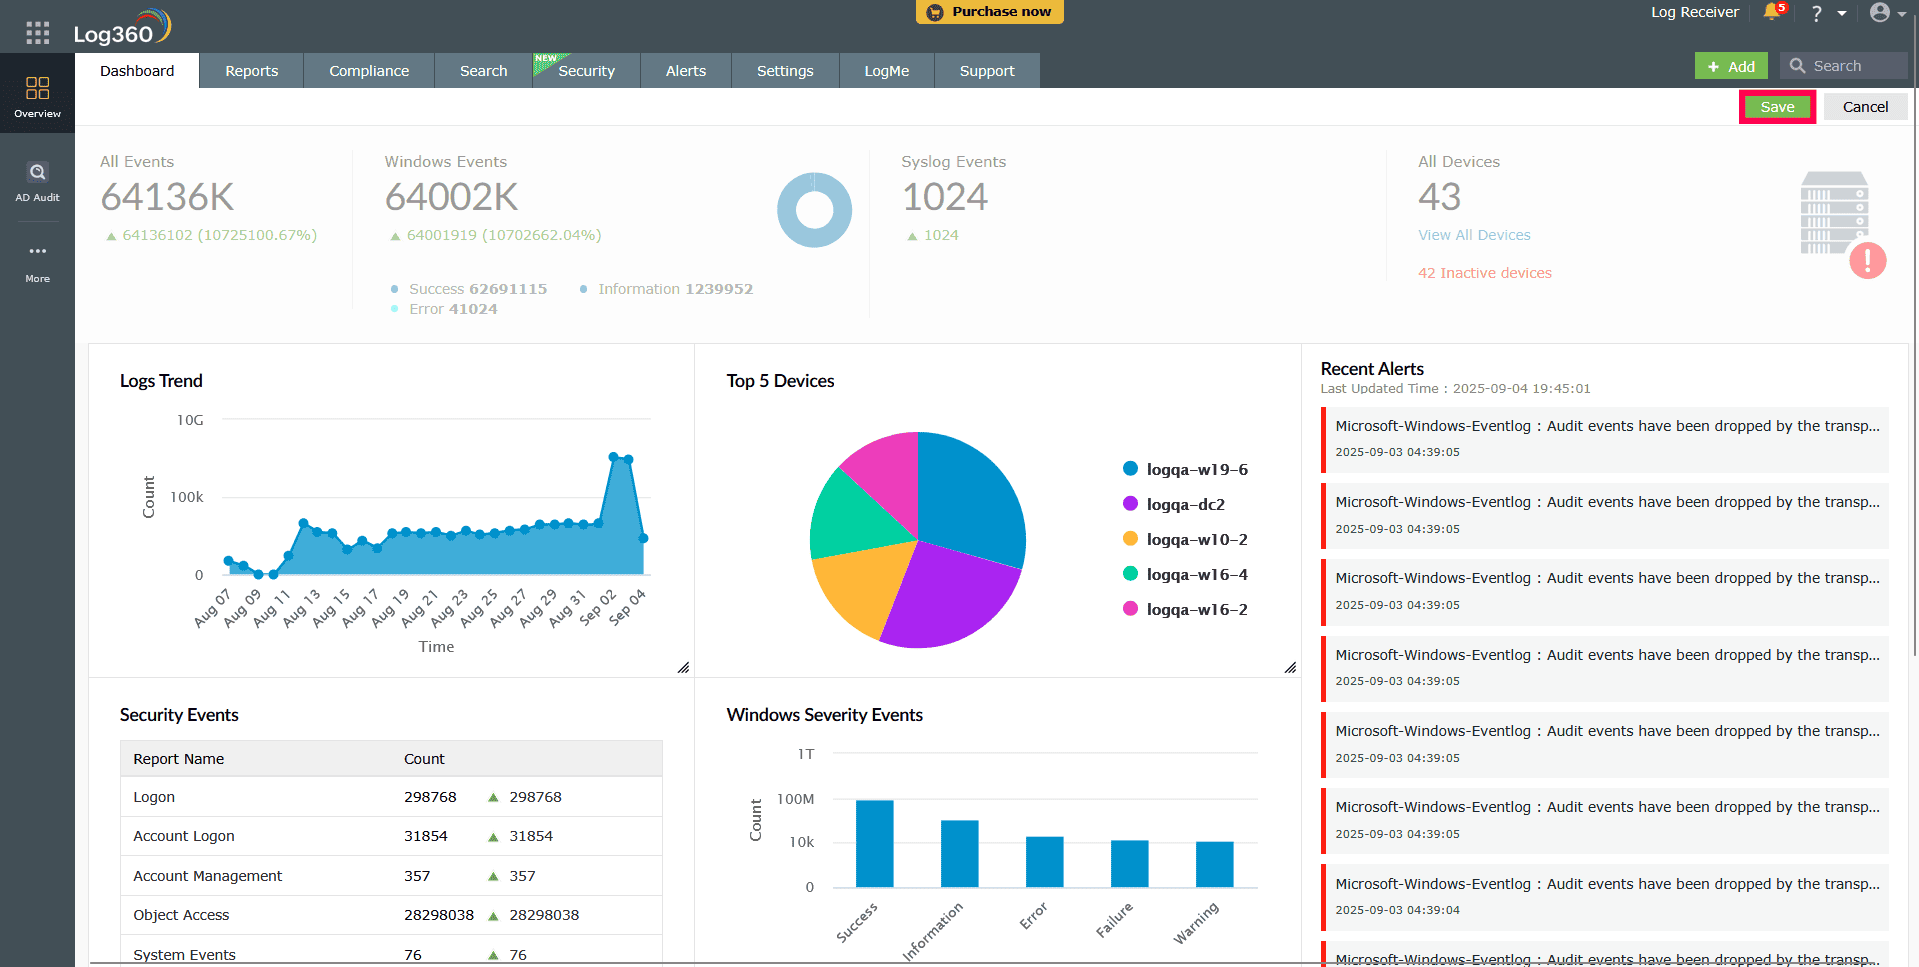
Figure 49: Saving changes to the dashboard
To resize the widgets in a tab,
- In the dashboard, navigate to the tab whose widgets you want to resize.
- Click the icon on the top-right corner and select Reorder Widgets.
- Hover over the widget you want to resize, click the
 icon, and drag from the bottom-right corner to adjust the size as needed.
 - Click Save in the top-right corner to apply the changes to the dashboard.
Editing and deleting widgets
To edit a widget in a tab,
- In the dashboard, click the
 icon and select Edit Widget corresponding to the widget that you want to edit.
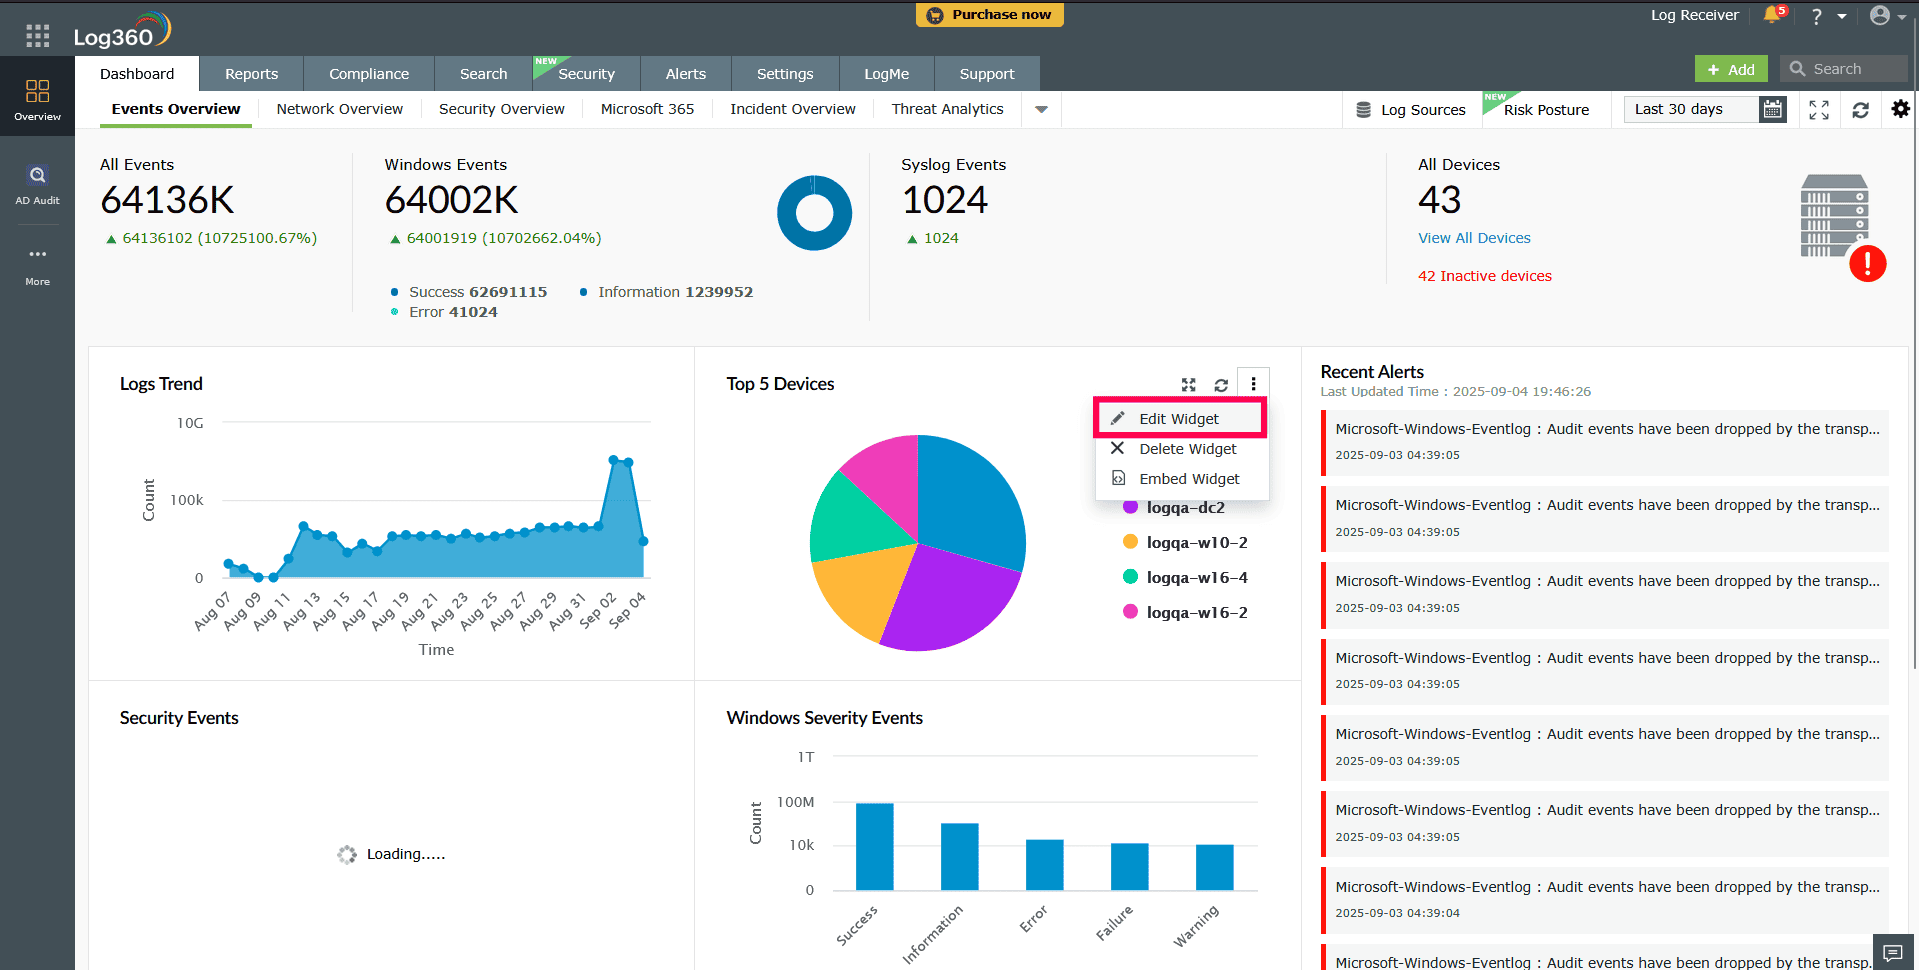
Figure 50: Editing a widget - Update the necessary information and click Update.
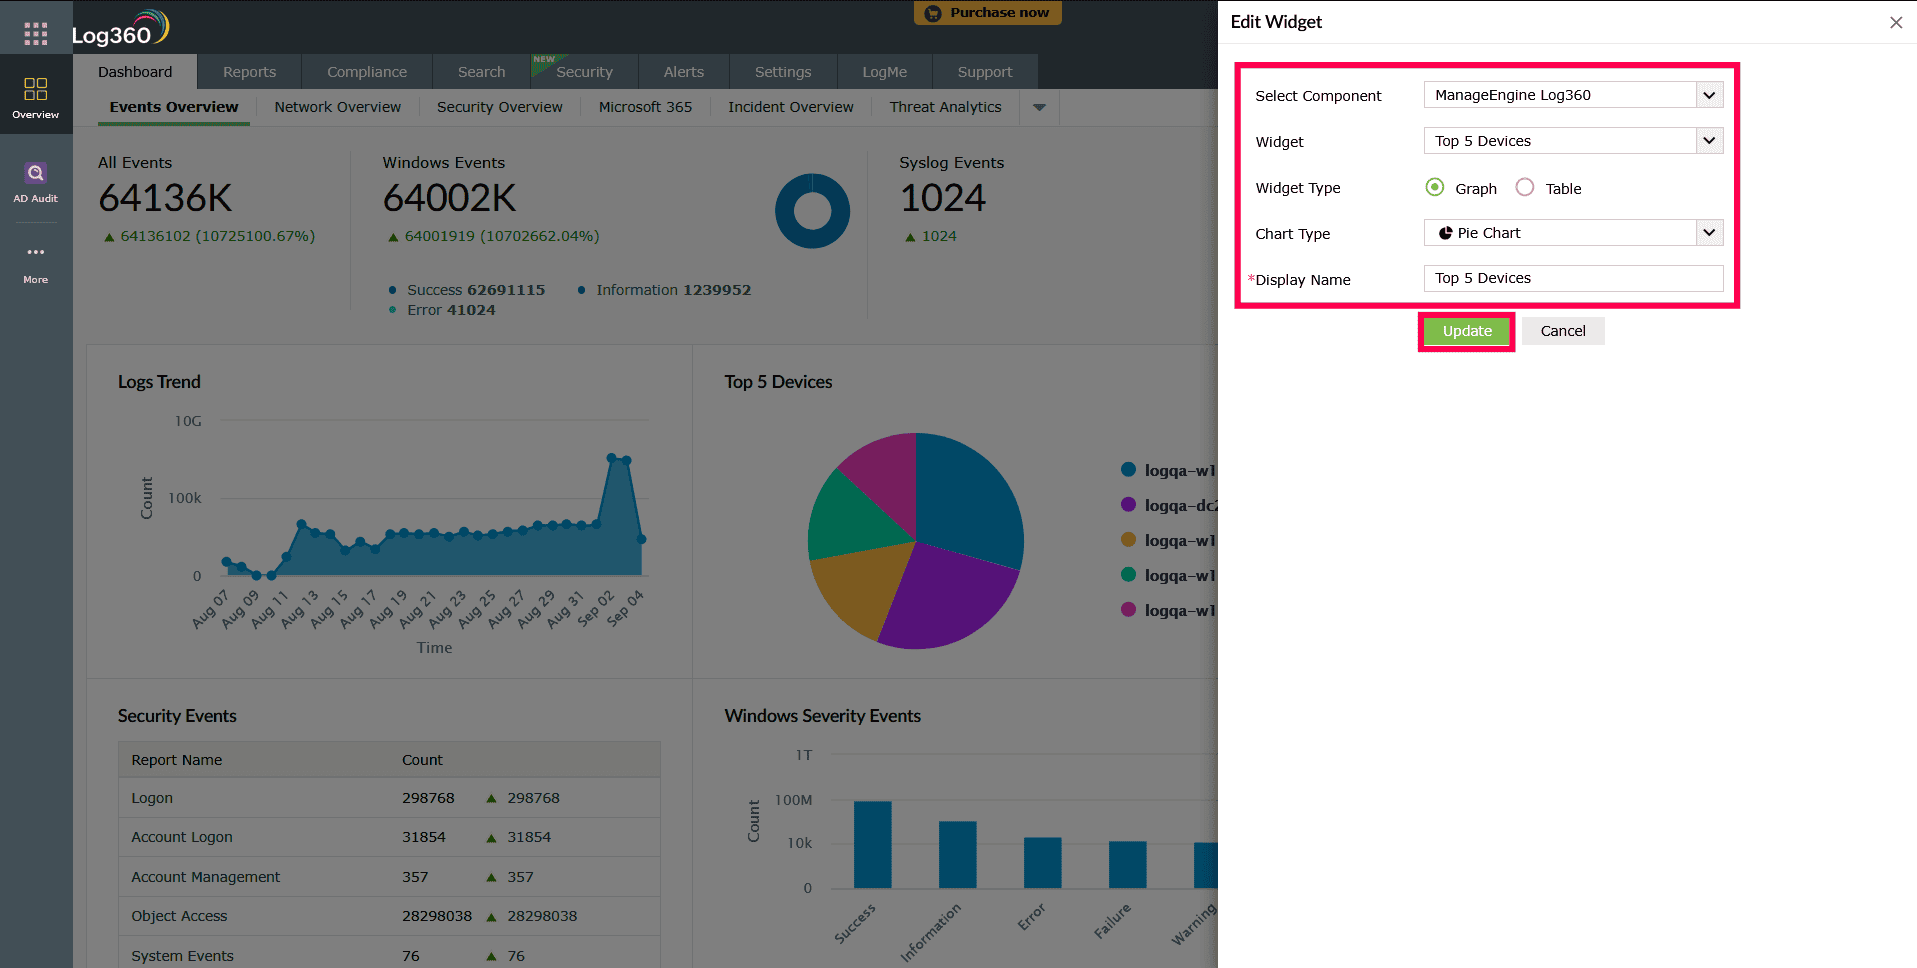
Figure 51: Editing a widget
To delete a widget from a tab,
- In the dashboard, click the icon corresponding to the widget that you want to delete.
- Select Delete Widget.
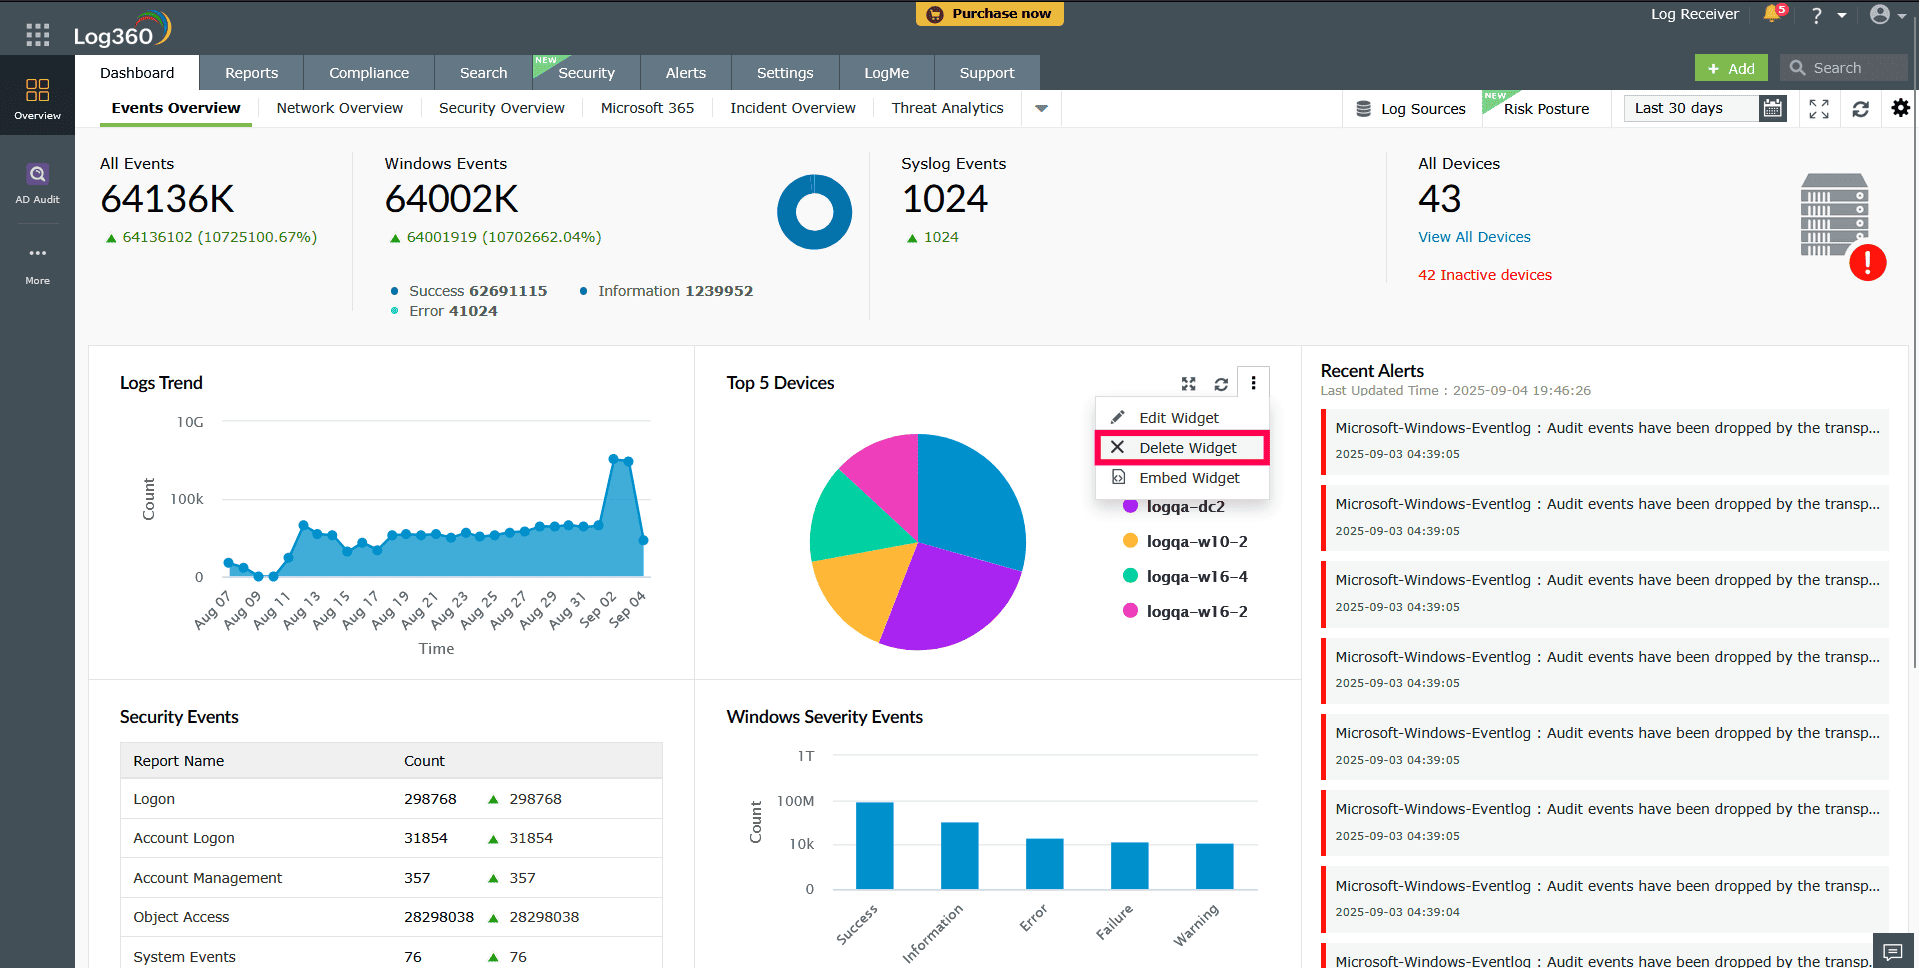
Figure 52: Deleting a widget - Click Yes in the pop-up box to complete the deletion.
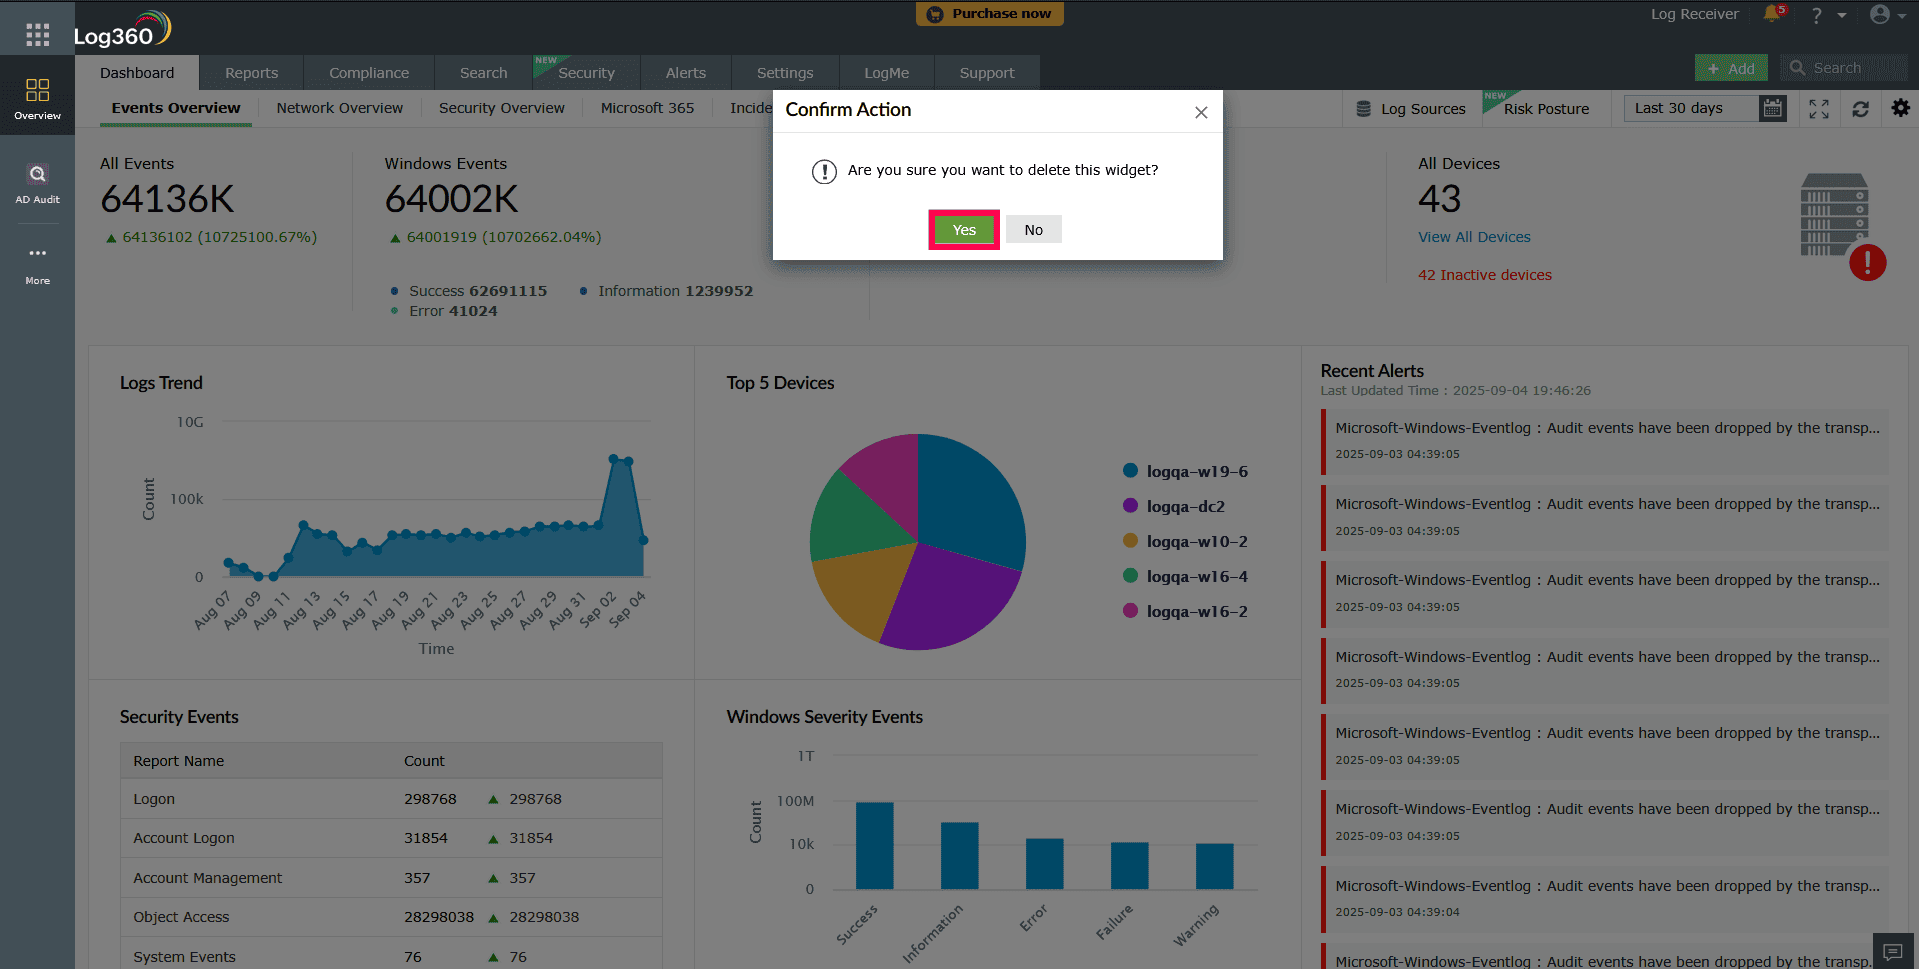
Figure 53: Confirming deletion of a widget
Viewing the dashboard in full screen mode
To view the dashboard in full screen,
- In the dashboard, click the
 icon on the top-right corner.
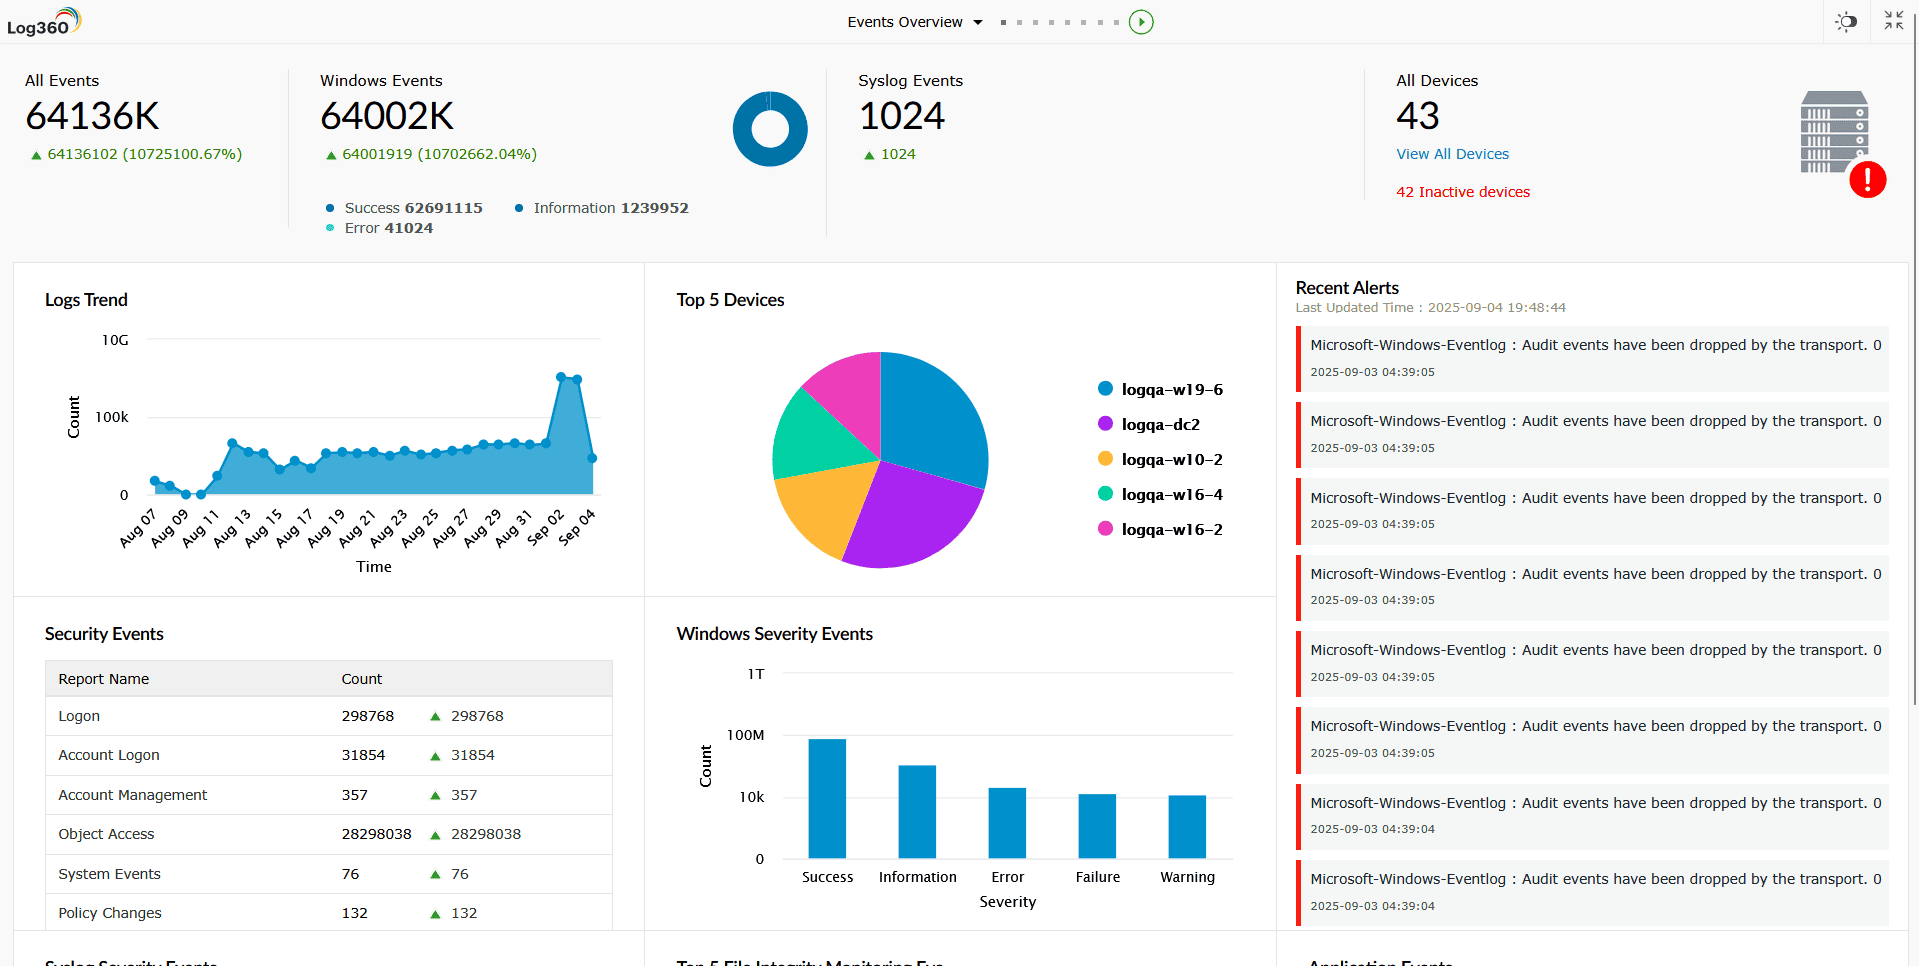
Figure 54: Viewing the dashboard in full screen mode - To start a slideshow of the tabs, click the play icon
 at the top of the screen.
 - To switch between tabs, click the drop-down button
 at the top of the screen.
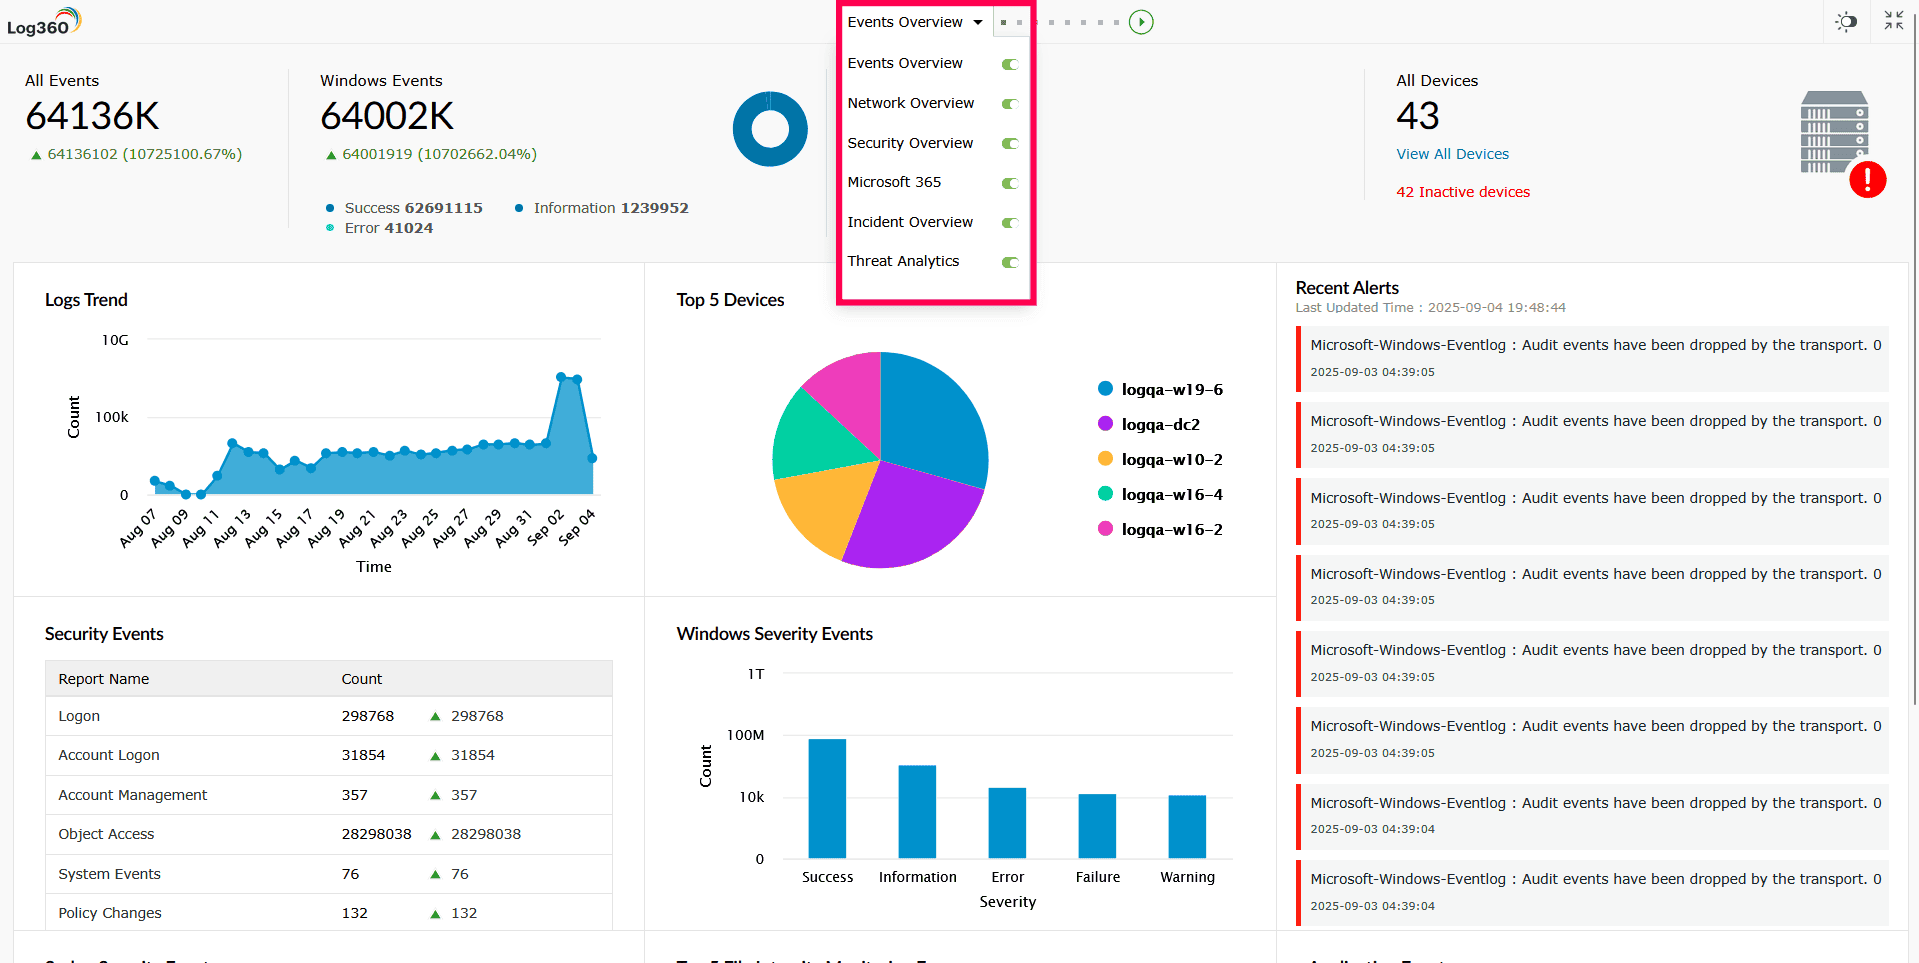
Figure 55: Switching between tabs - To remove a particular tab from the slideshow, click the toggle button
 next to the tab name in the drop-down list.
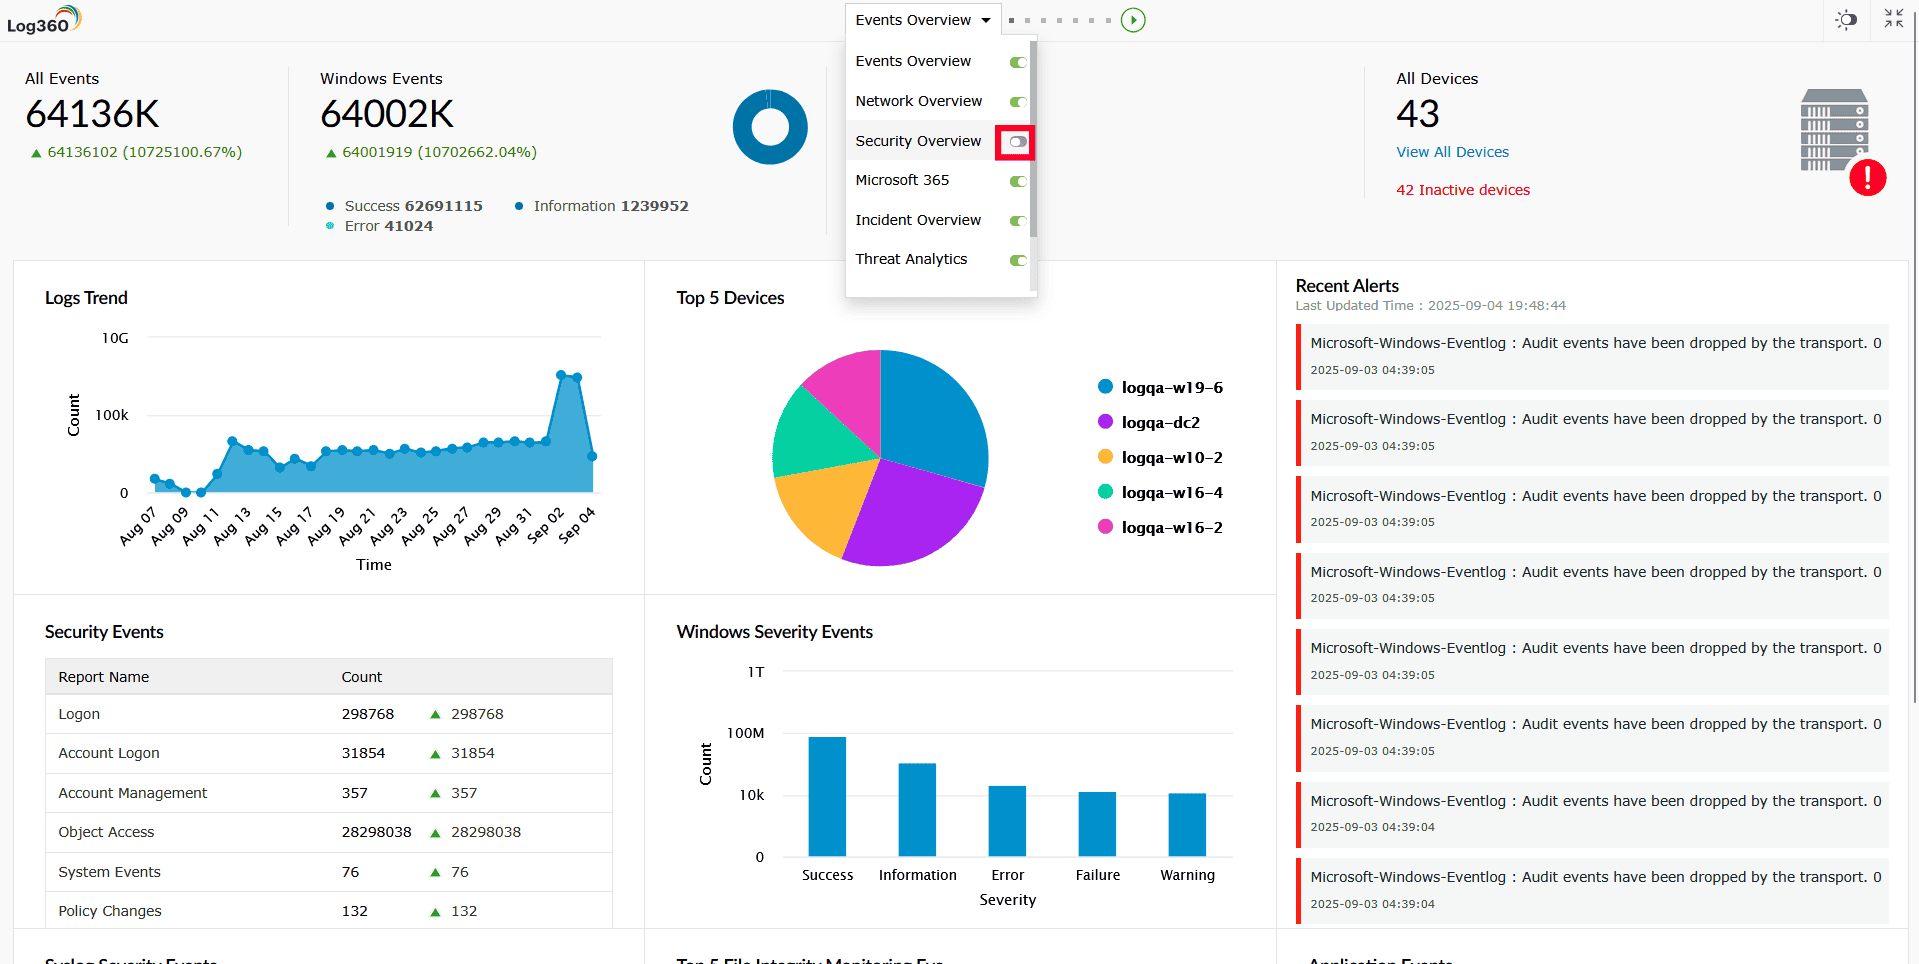
Figure 56: Removing a tab from the slideshow - To switch to dark mode, click the toggle button
 at the top-right corner of the screen.
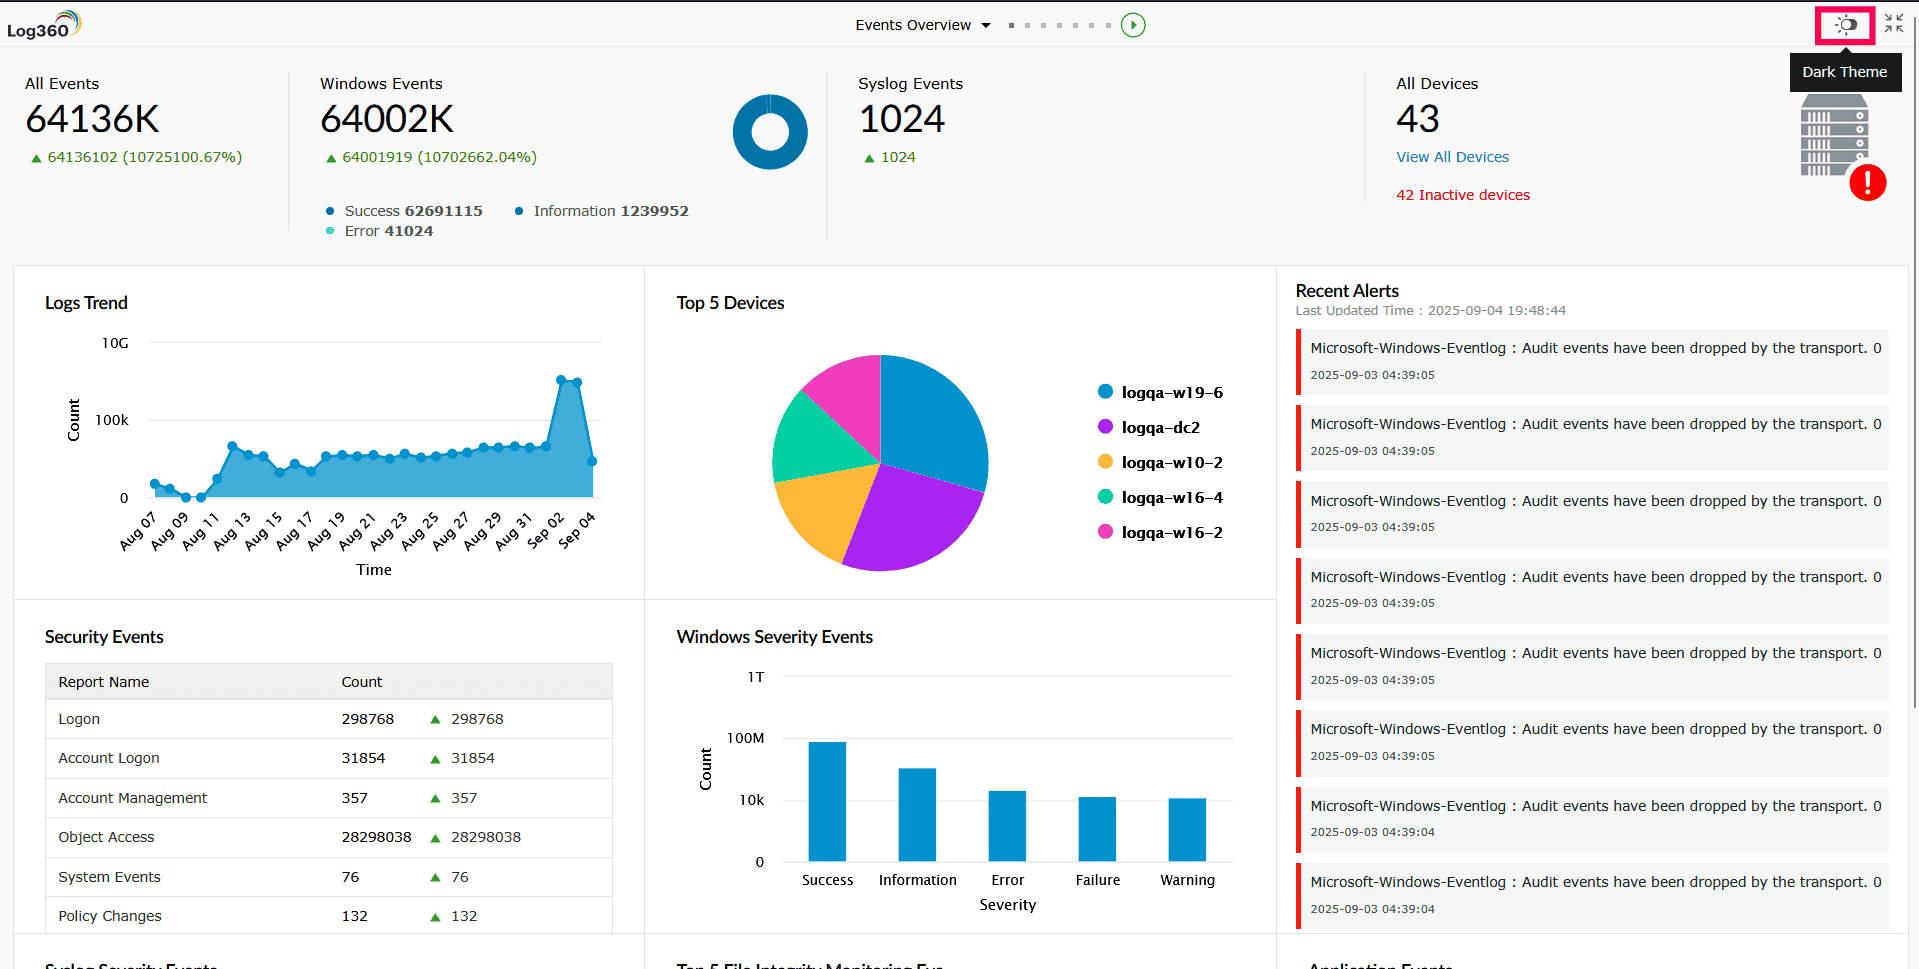
Figure 57: Switching to dark mode - To exit full screen mode, click the
 icon.
icon.
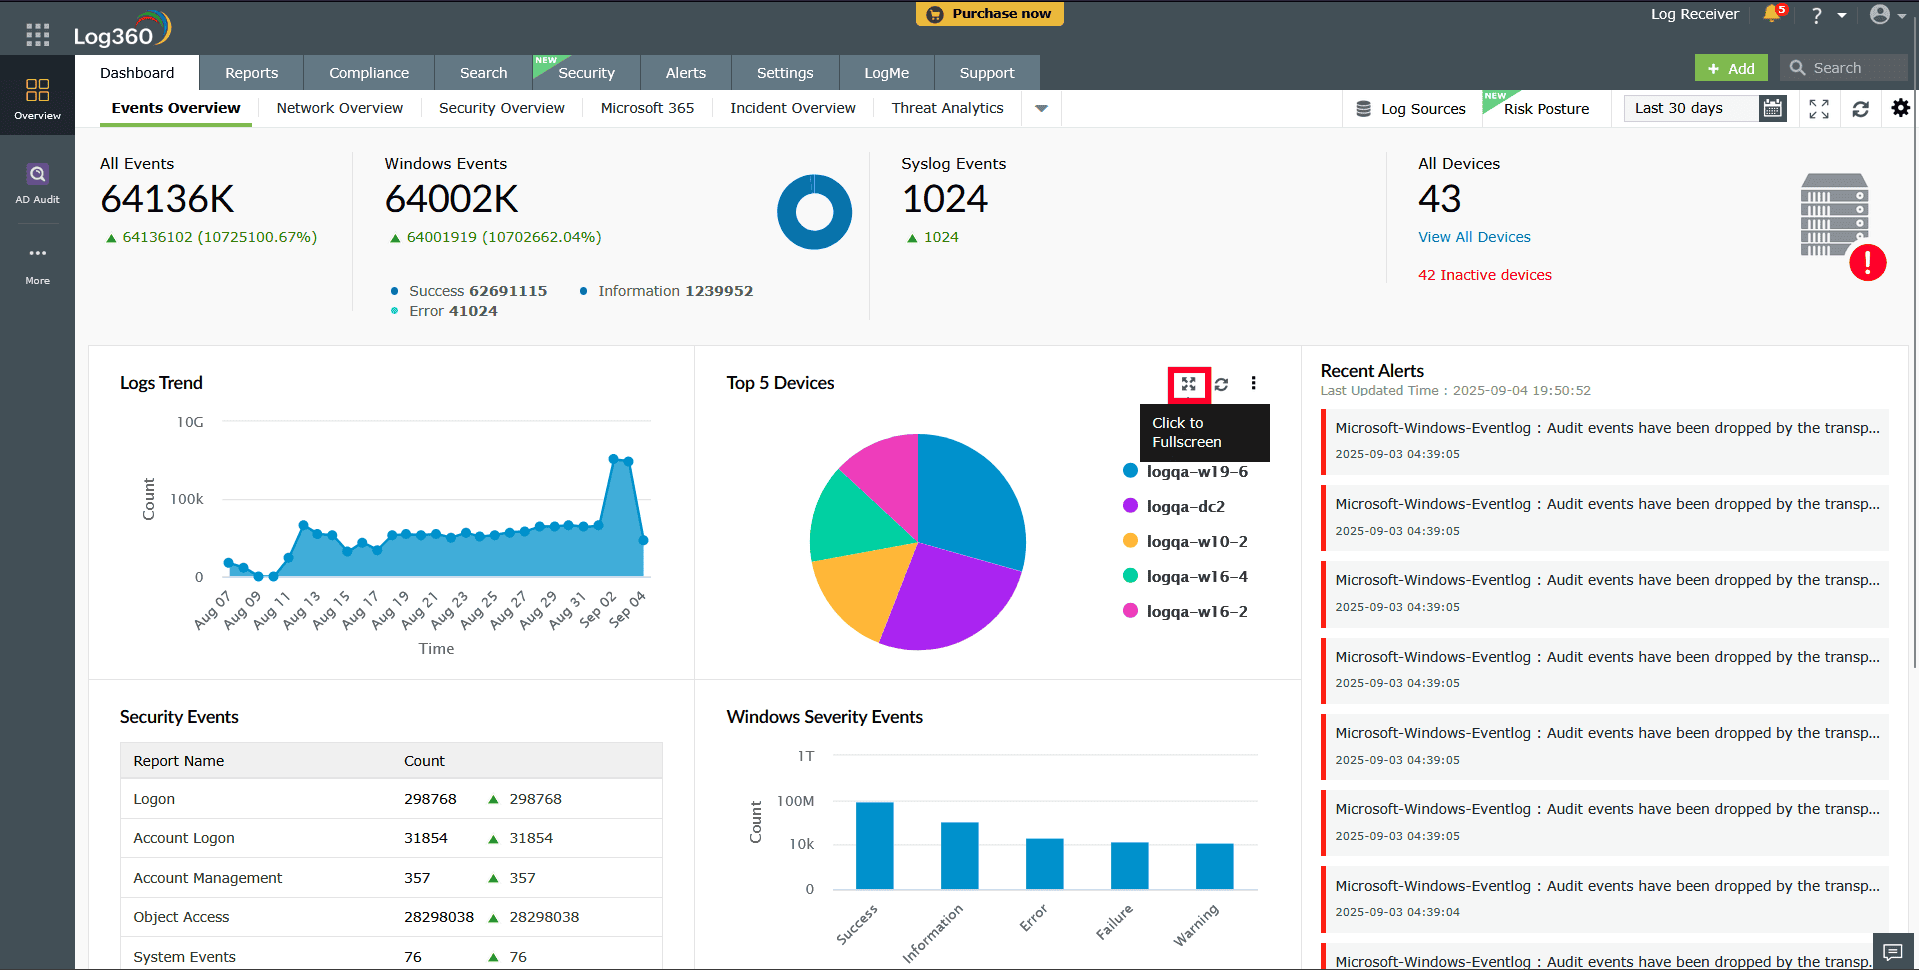
Viewing a widget in full screen mode
To view a widget in full screen, in the dashboard, click the ![]() icon on the top-right corner of the widget you want to view.
icon on the top-right corner of the widget you want to view.
Refreshing the dashboard and widgets
To refresh the entire dashboard,
- In the dashboard, click the icon on the top-right corner of the screen.
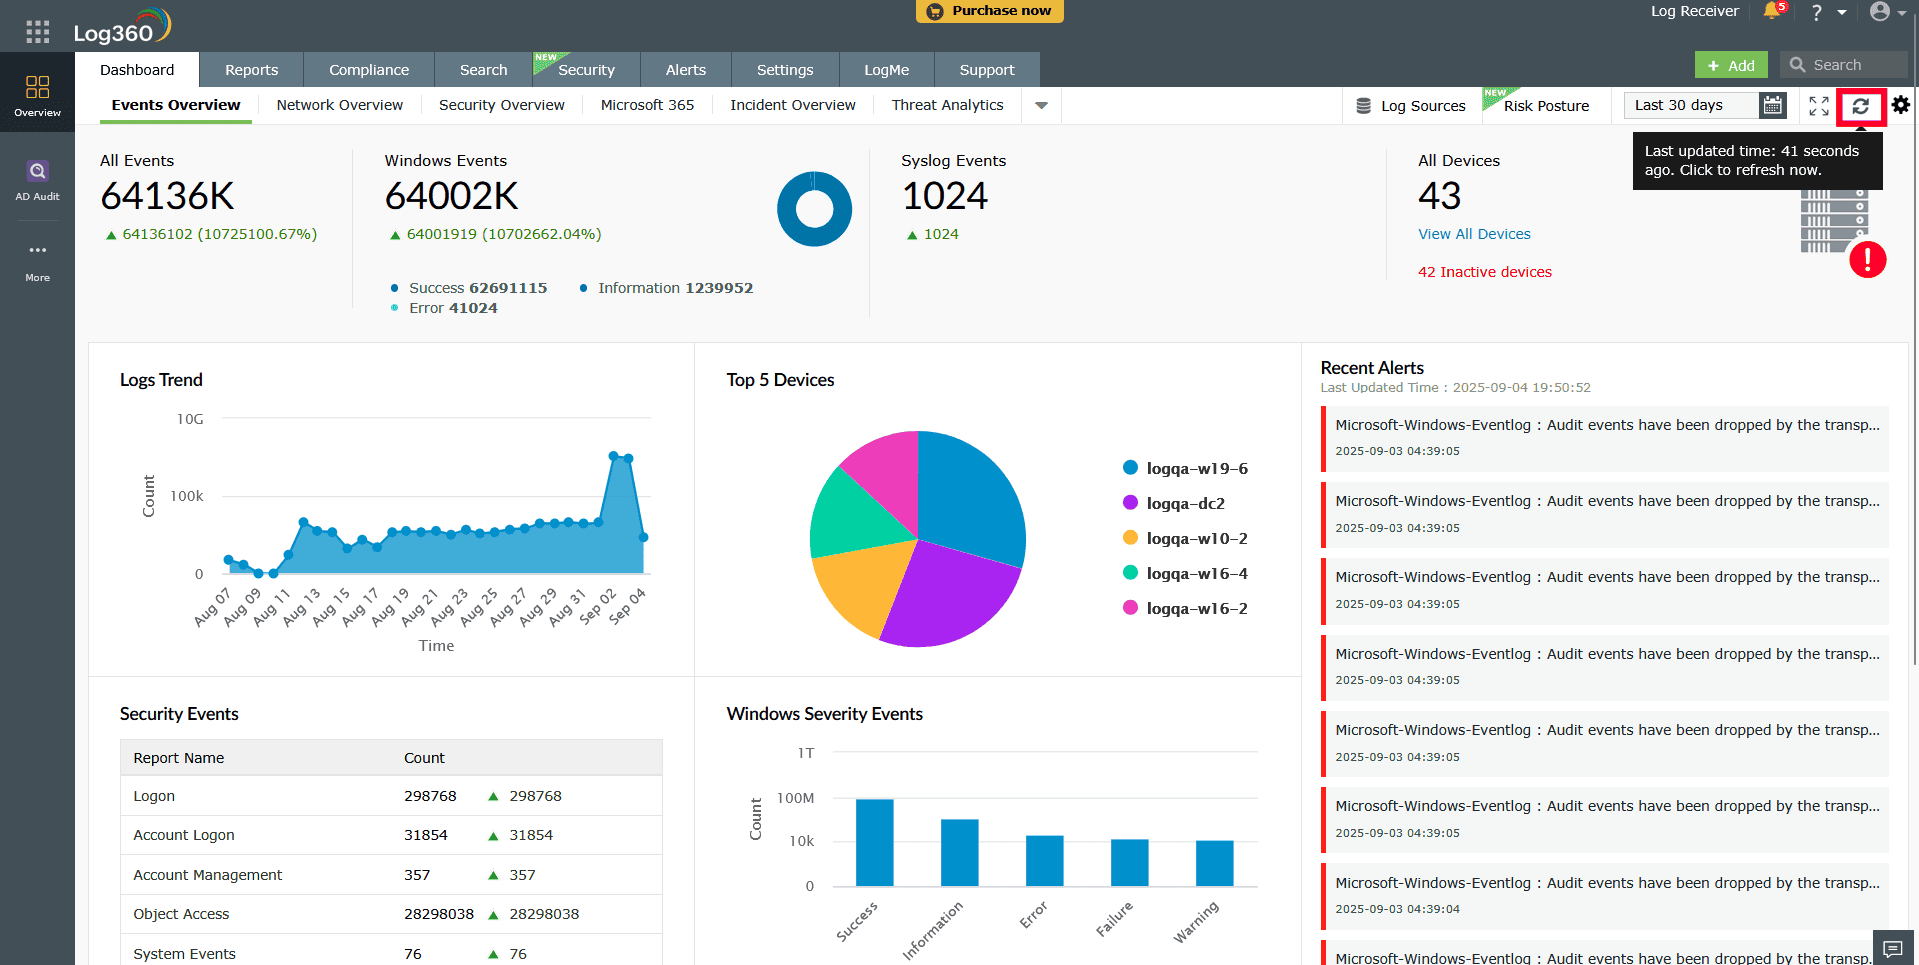
Figure 59: Refreshing the dashboard
To refresh a particular widget,
- In the dashboard, click the icon on the top-right corner of the specific widget.
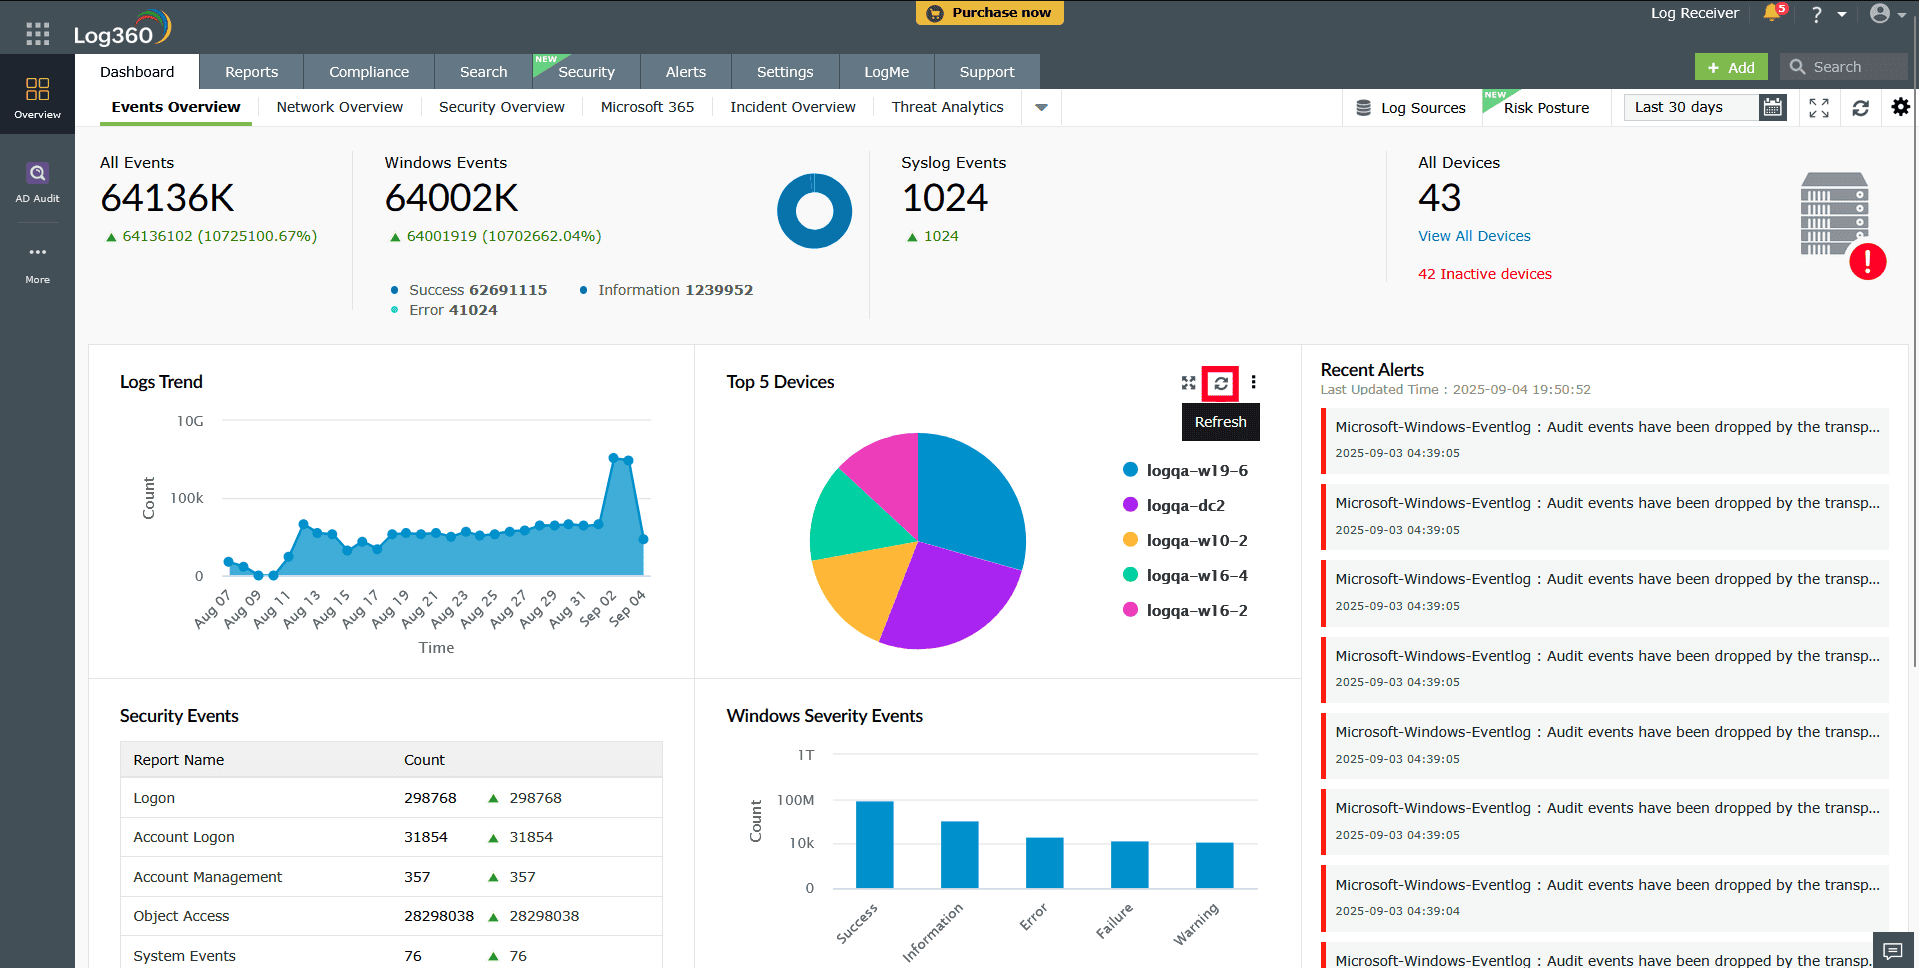
Figure 60: Refreshing a widget
Changing refresh interval
To change the time interval for the automatic refreshing of the dashboard,
- In the dashboard, click the icon on the top-right corner and select Refresh Interval.
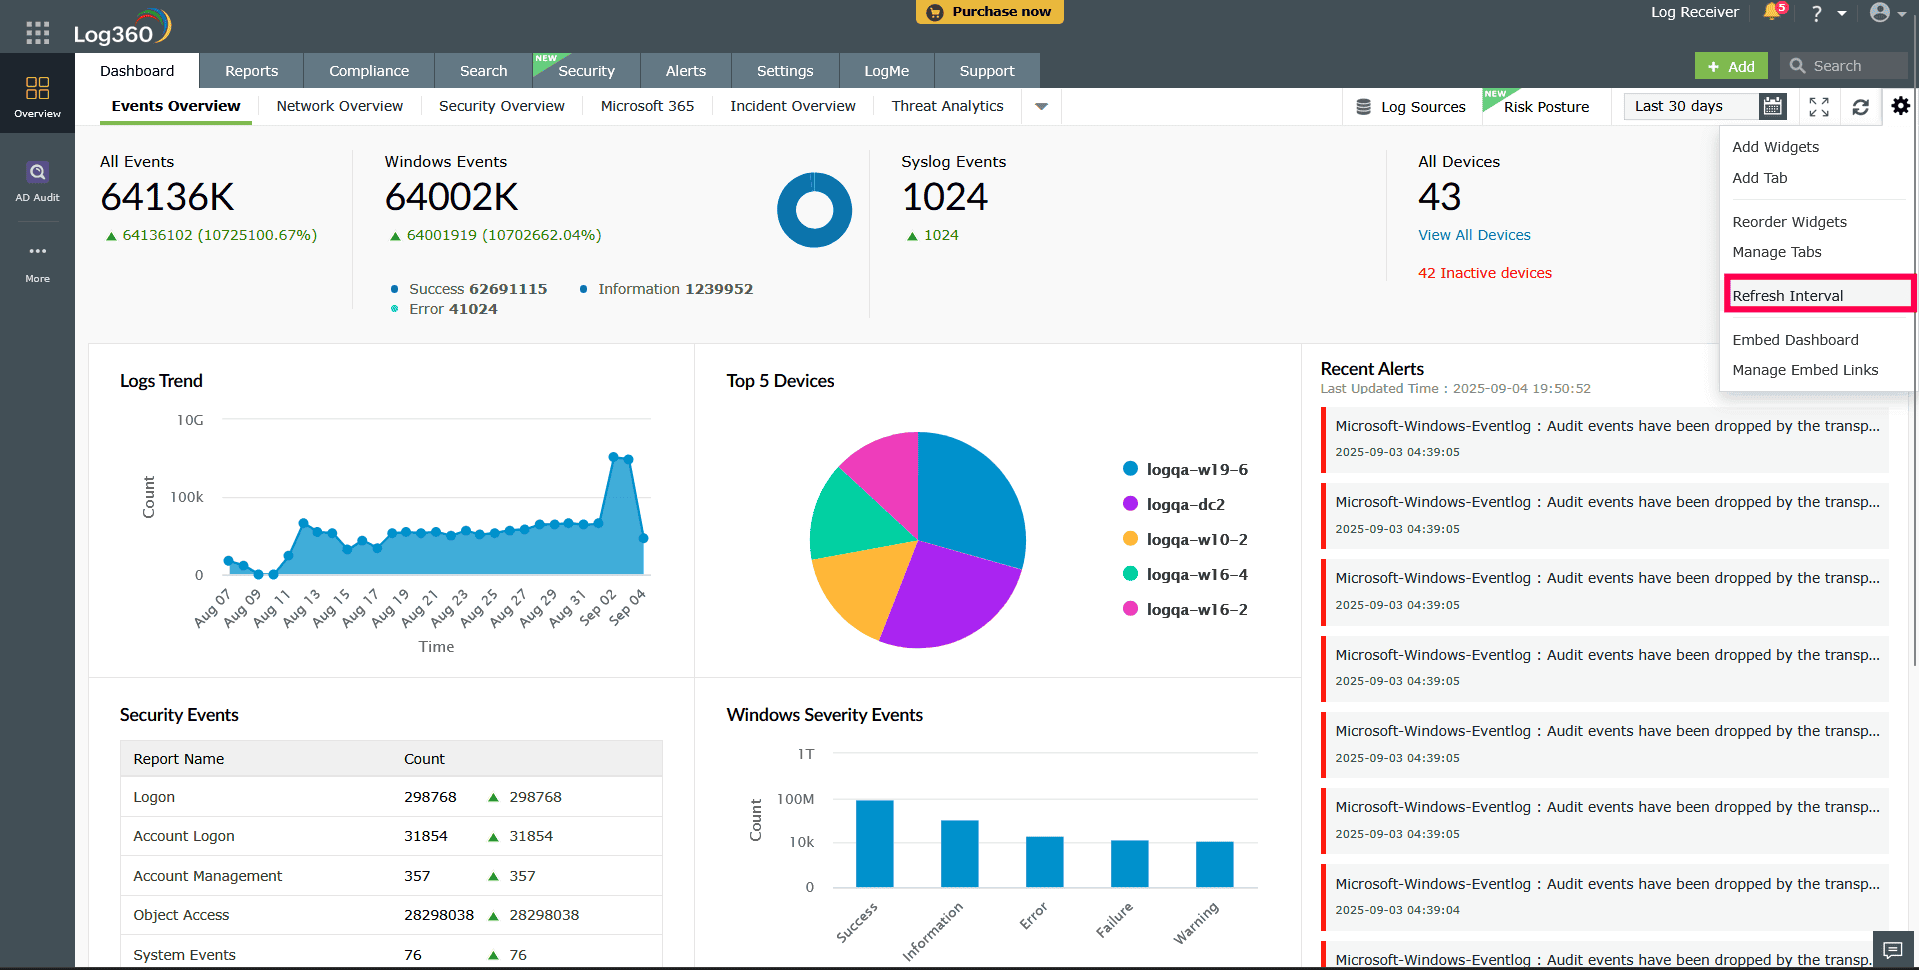
Figure 61: Configuring Refresh Interval in the dashboard - In the Dashboard Refresh window, select the refresh interval: Never, 30 seconds, 1 minute, 5 minutes, 10 minutes, or 1 hour.
NOTE: If you select Never, the dashboard will not refresh automatically. You will need to refresh it manually.
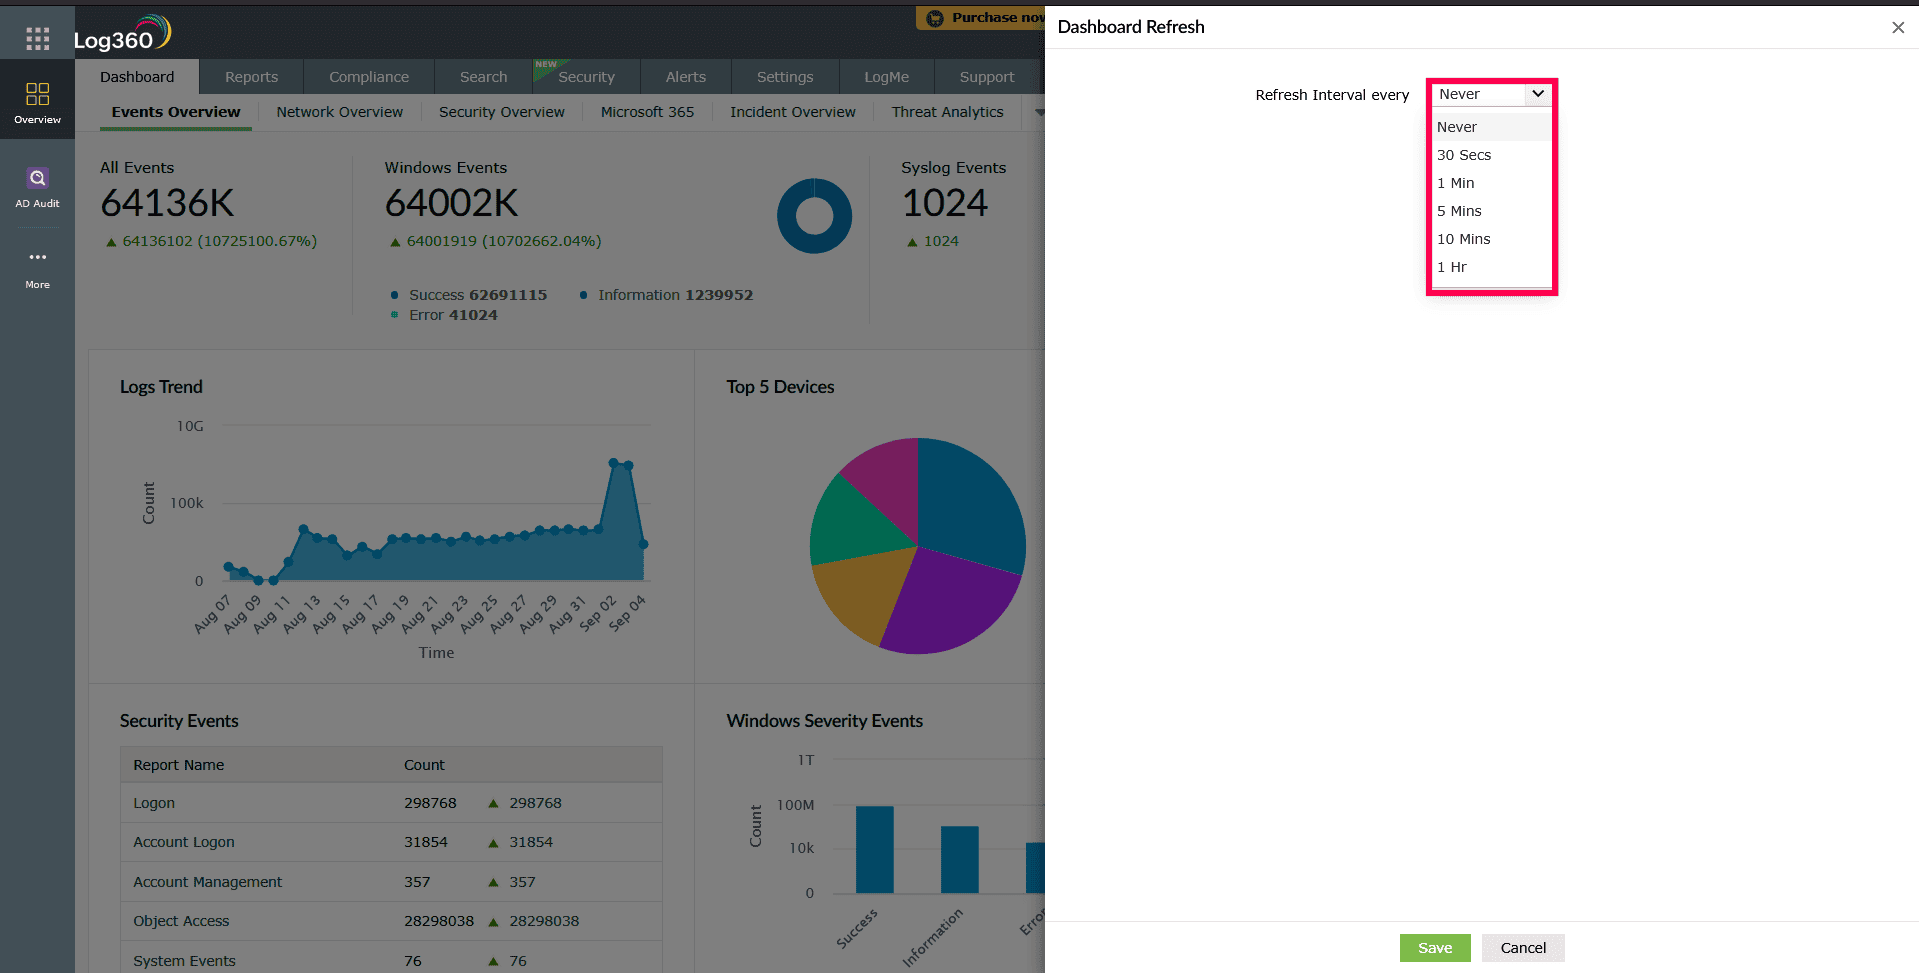
Figure 62: Changing the refresh interva - Click Save to apply the changes to the dashboard.
Configuring Embed link for dashboard and widgets
The Embed link enhances data sharing by allowing the creation of external share links for specific tabs or widgets. This enables precise and targeted access to dashboard data, supporting collaboration and visibility across platforms.
To embed a dashboard,
- In the dashboard, navigate to the tab you want to embed.
- In the top-right corner, click the icon and select Embed Dashboard.
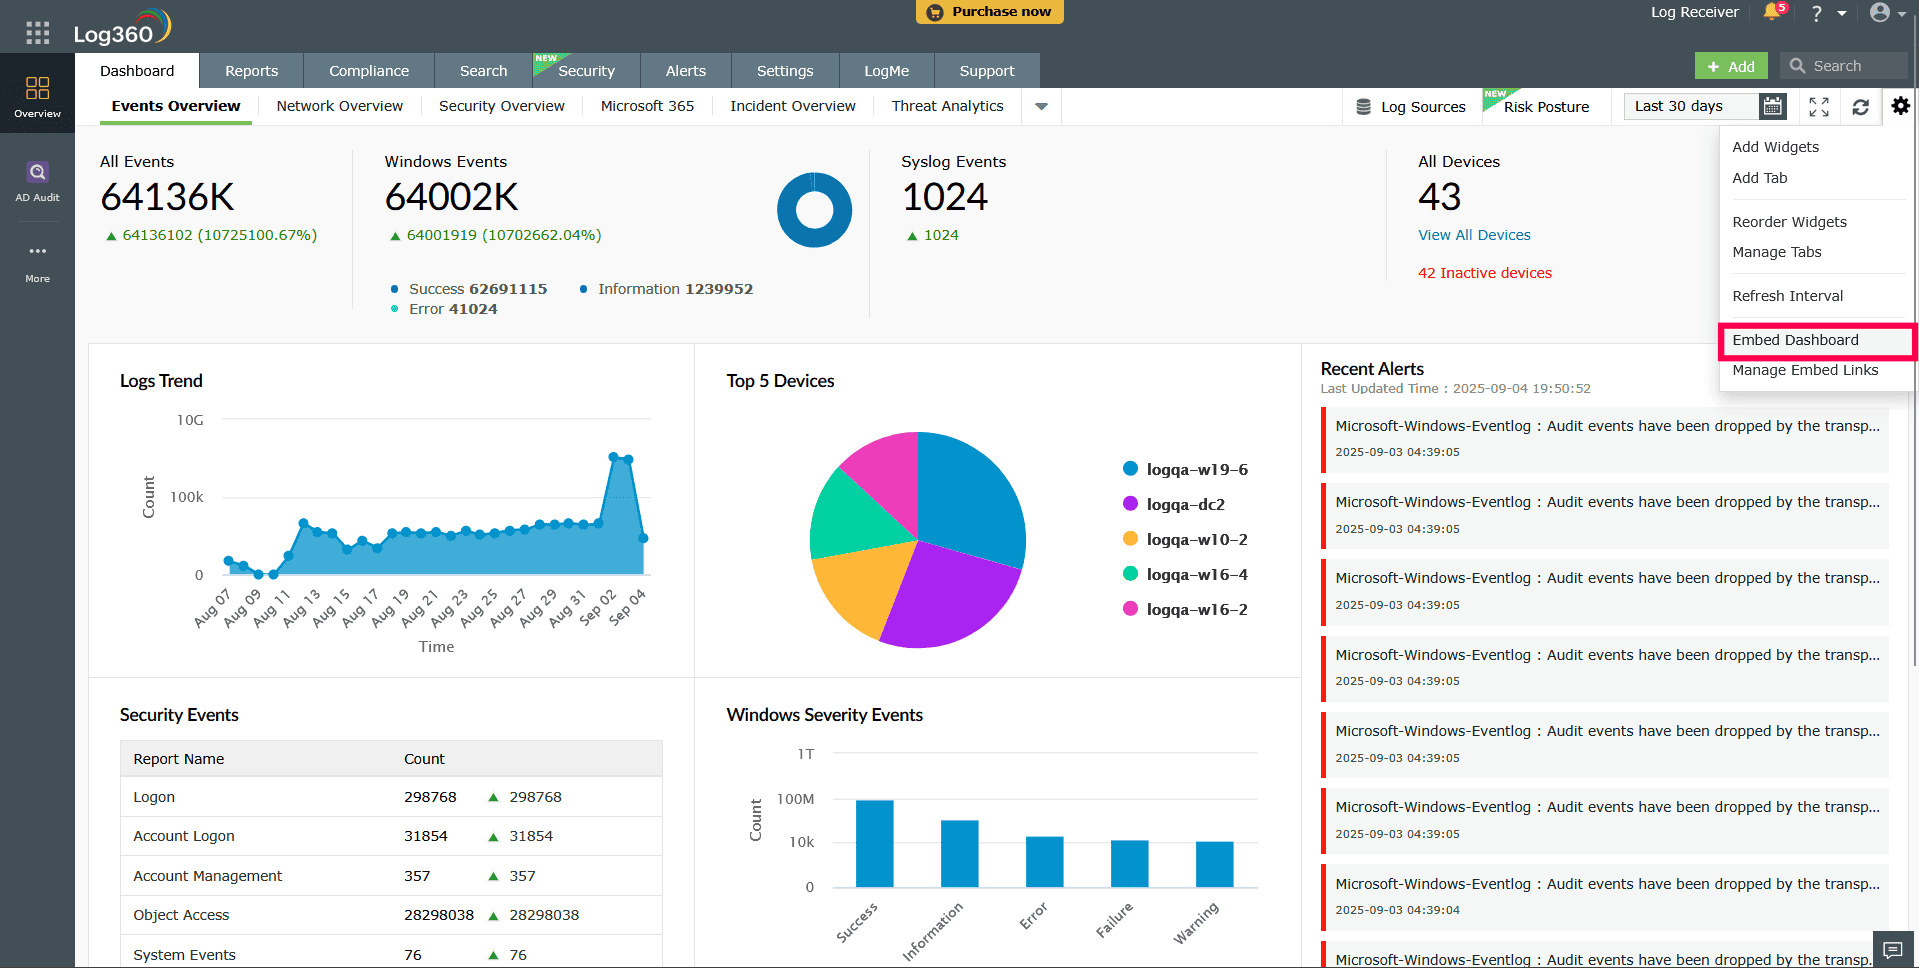
Figure 63: Navigating to Embed Dashboard - Provide a unique Link Name.
- Select the desired Time Range from the drop-down menu.
- Configure the Refresh Time (60 - 1440 minutes) and Expiry (1 - 365 days) using the drop-down options.
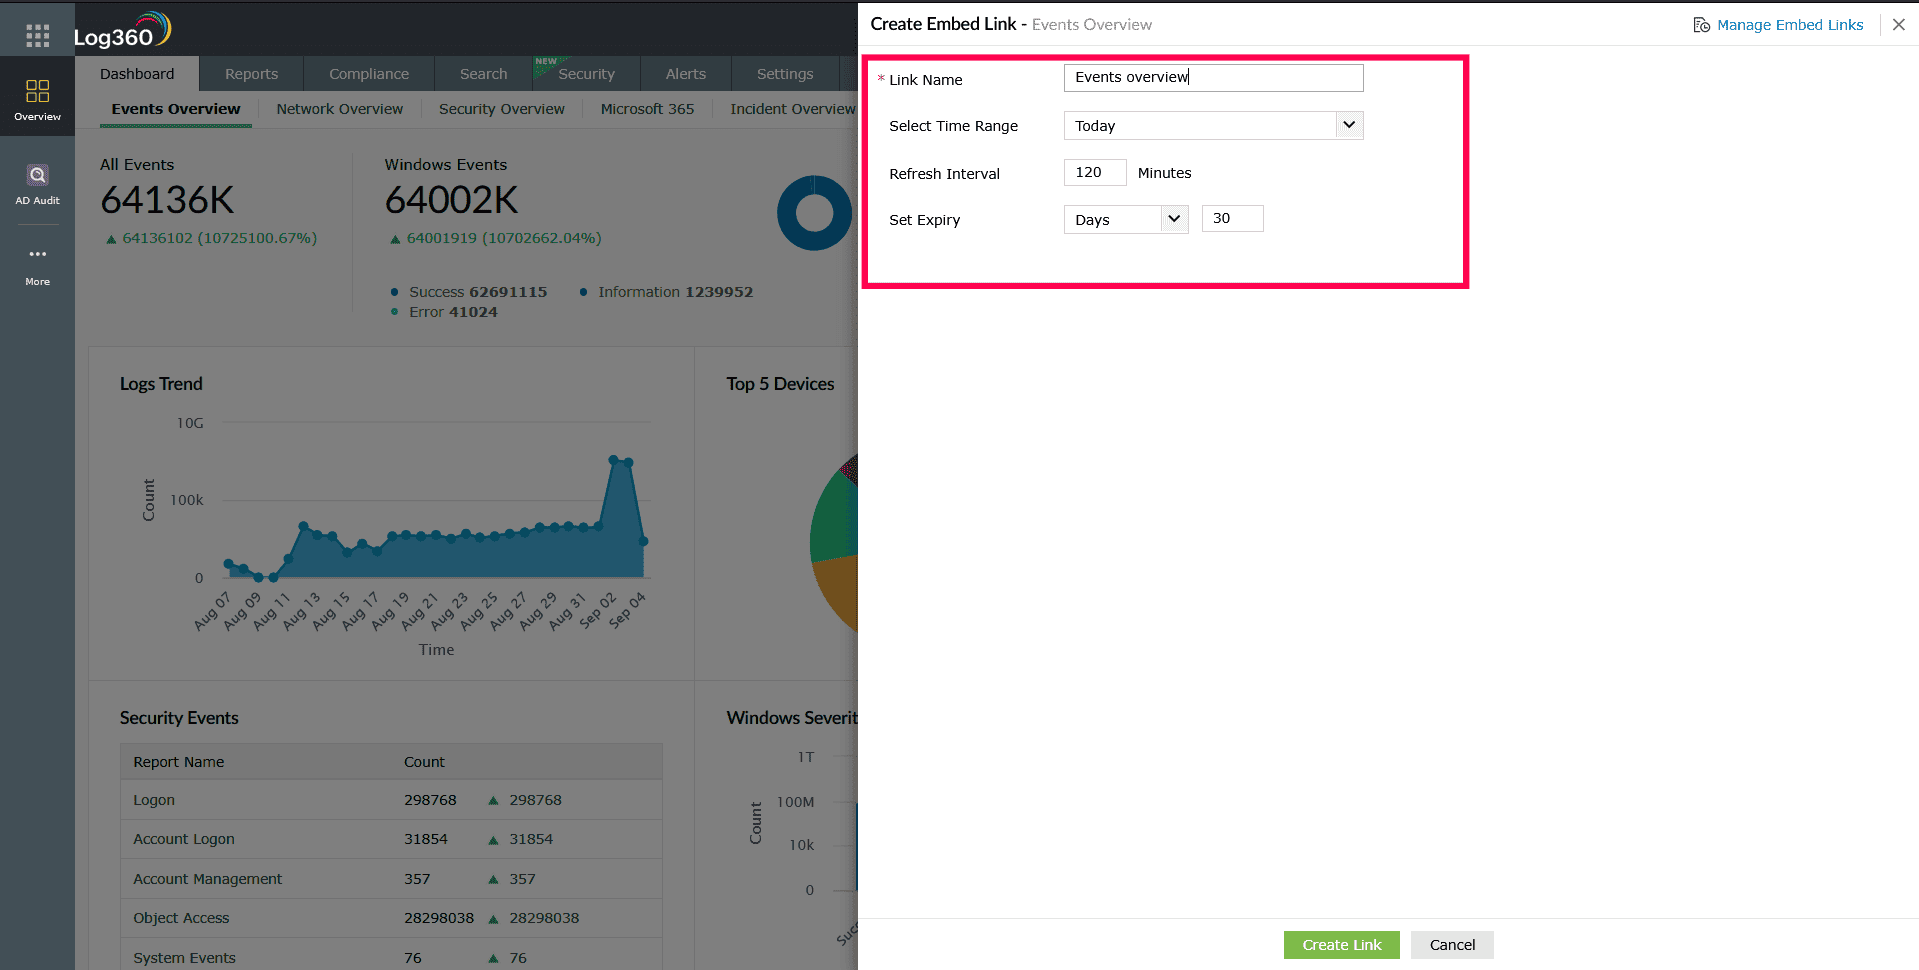
Figure 64: Creating an embed link - Click Create Link to generate the embed link for the dashboard.
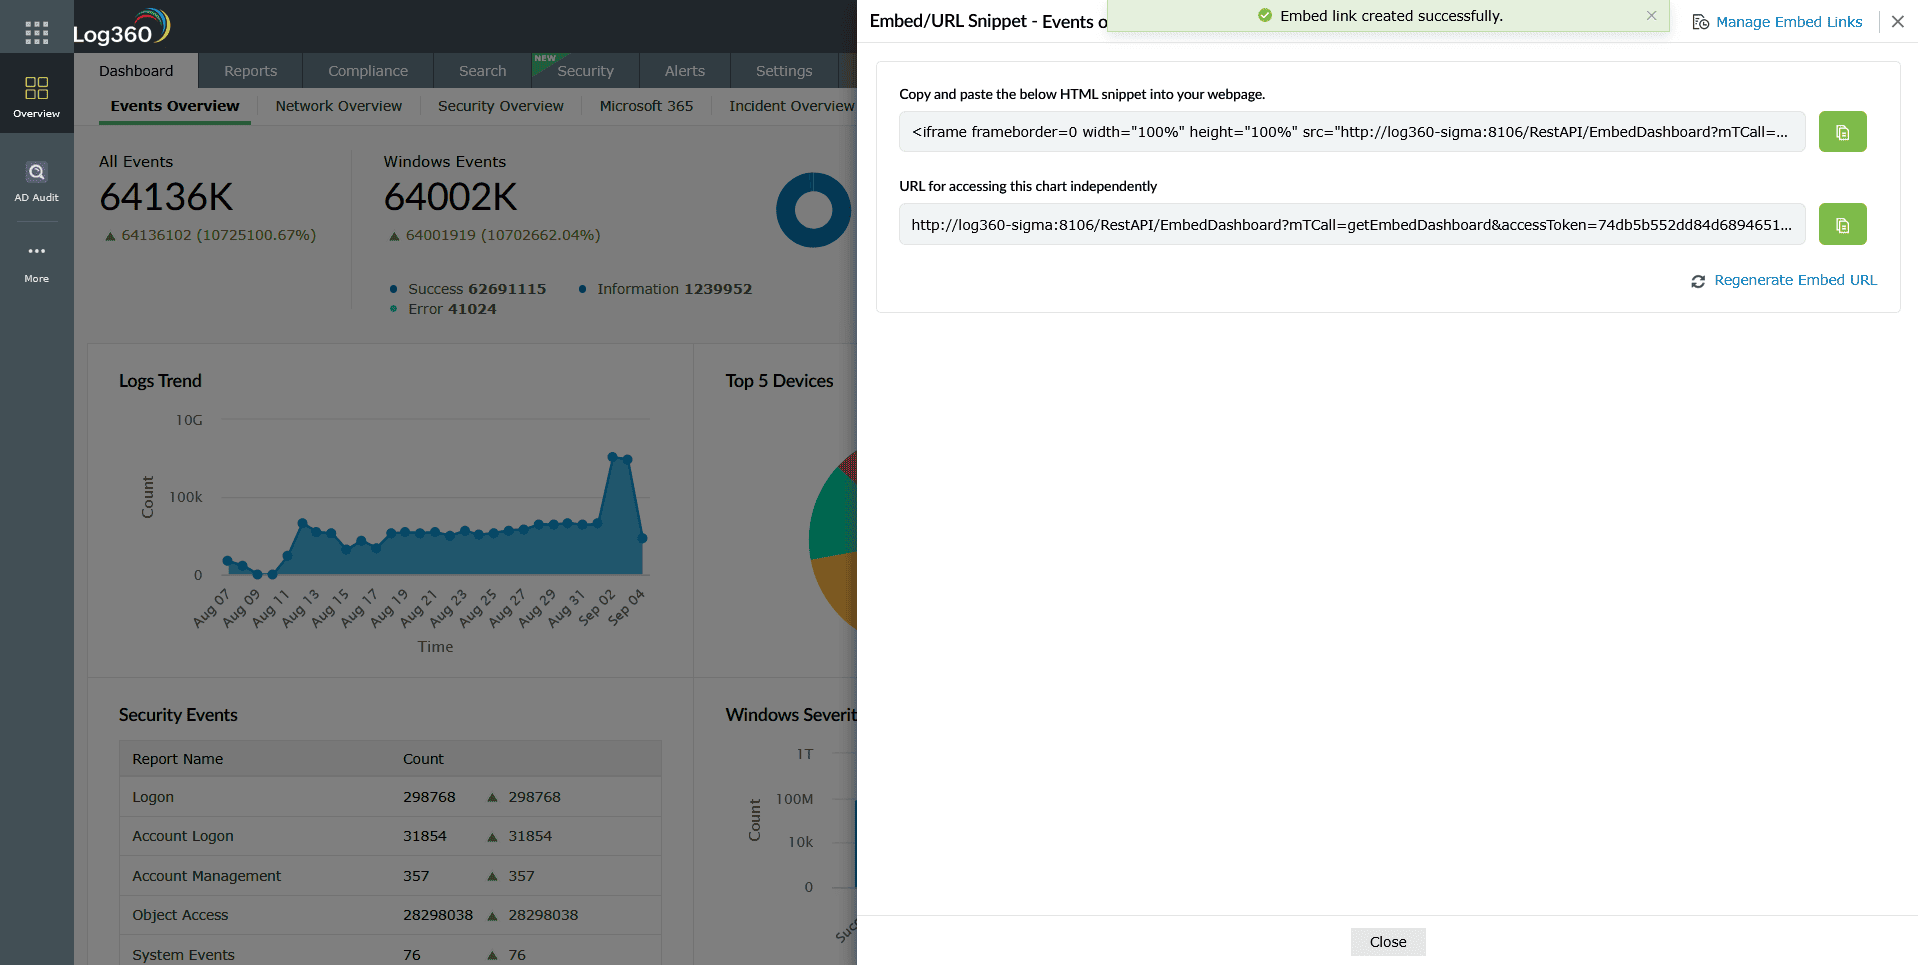
Figure 65: Creating an embed link - To regenerate the link, click Regenerate Embed URL.
To embed a widget,
- In the dashboard, click the icon and select Embed Widget corresponding to the widget that you want to embed.
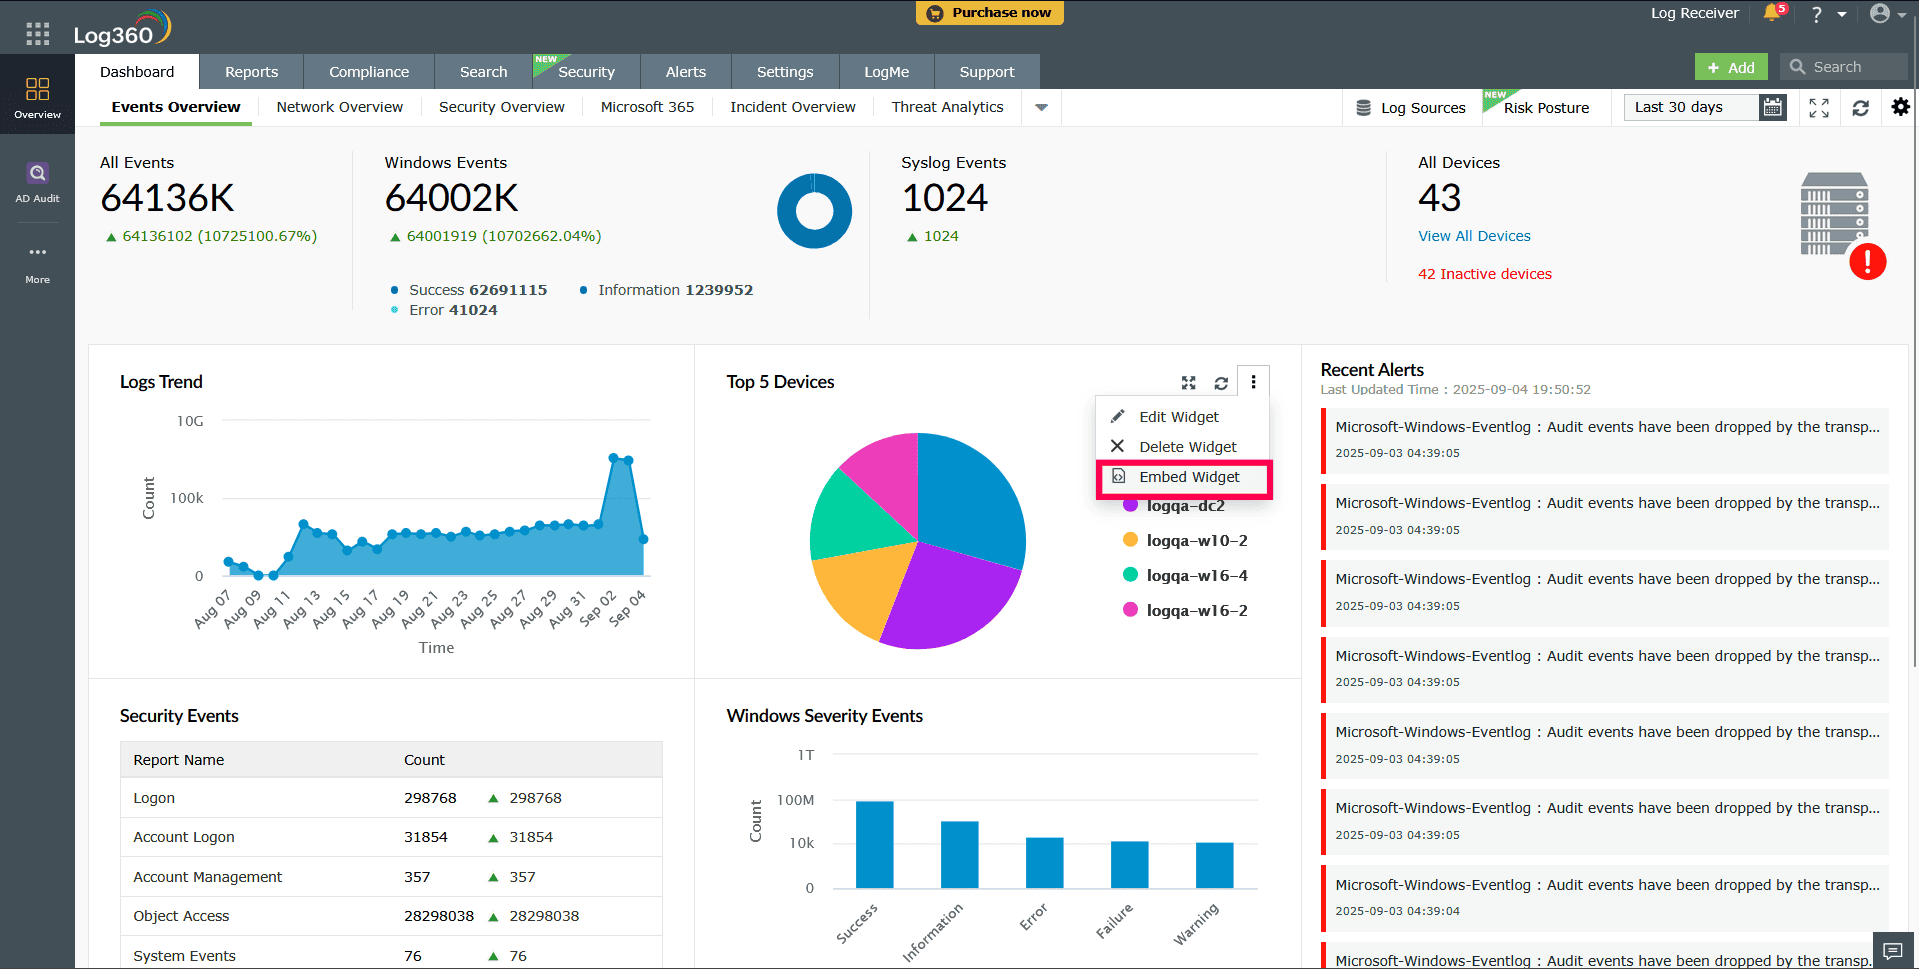
Figure 66: Embedding a widget in the dashboard - Provide a unique Link Name.
- Select the desired Time Range from the drop-down menu.
- Configure the Refresh Time (60 - 1440 minutes) and Expiry (1- 365 days) using the drop-down options.
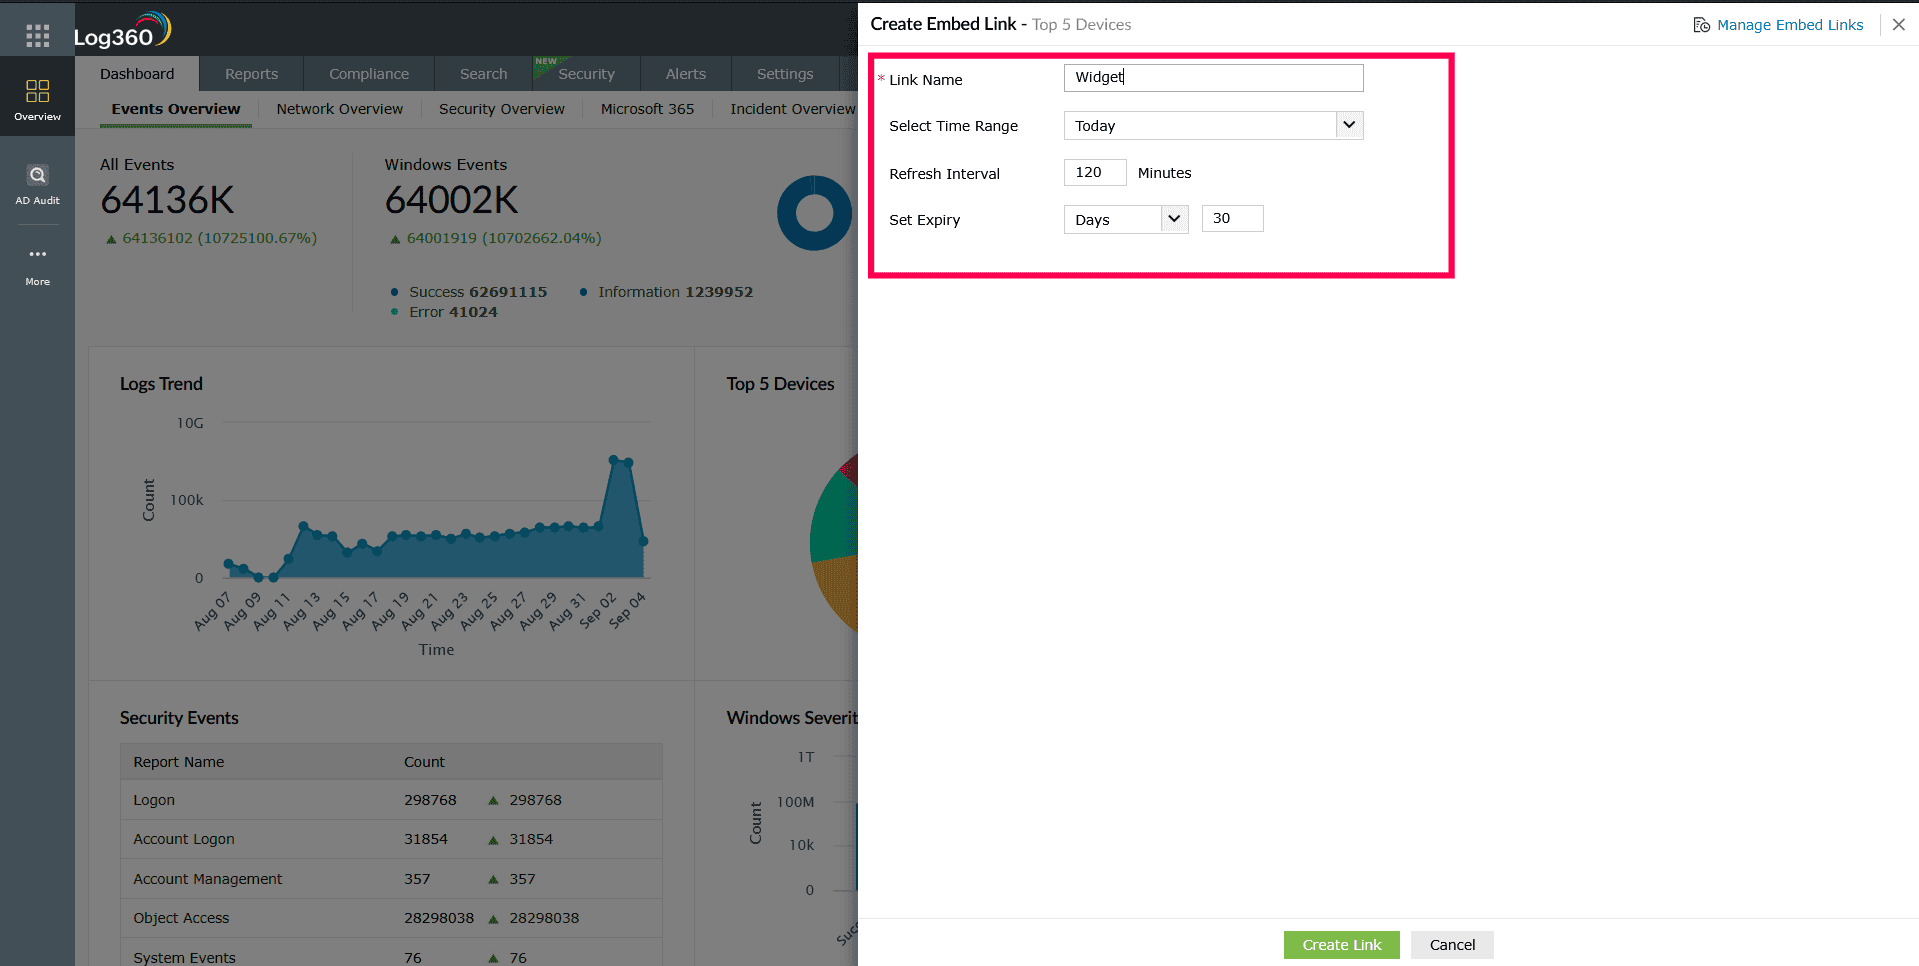
Figure 67: Configuring an Embed widget link - Click Create Link to generate the embed widget link.
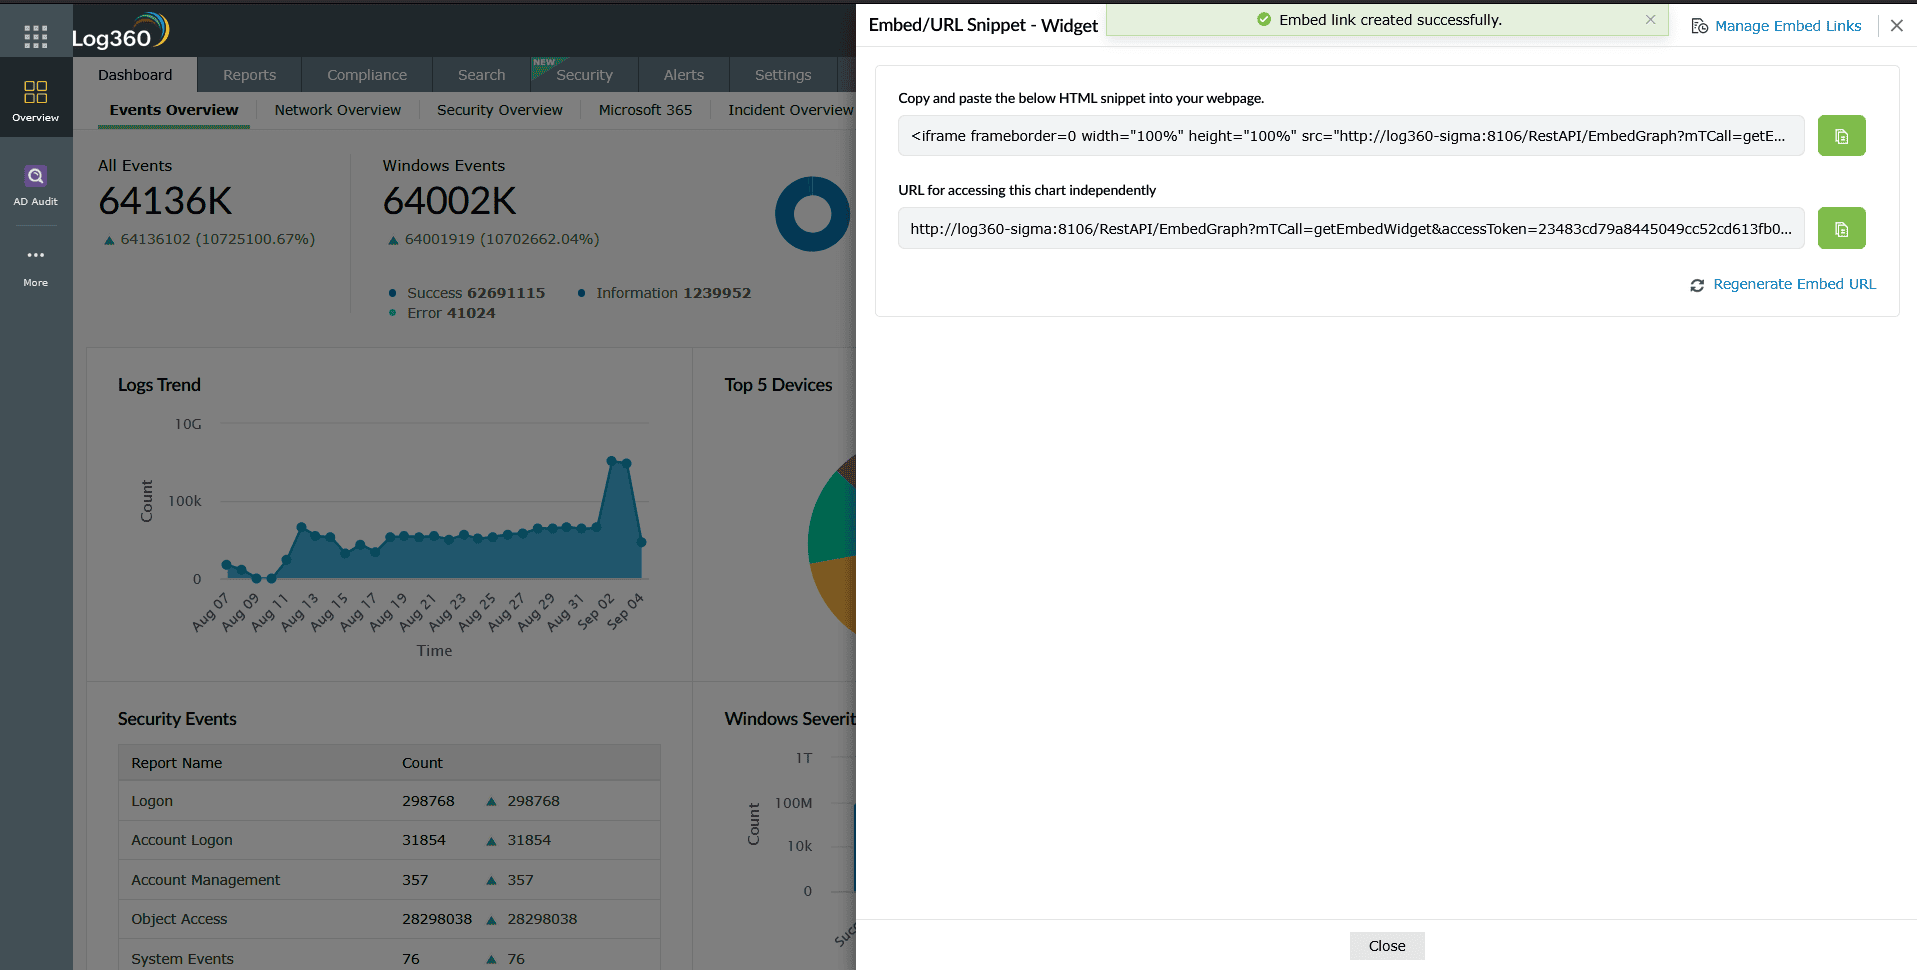
Figure 68: Creating Embed widget links - To regenerate the link, click Regenerate Embed URL.
- The embedded widget will refresh automatically at the specified interval.
- The generated external share link will remain valid only until the specified expiry date.
Managing embed links
To manage embed dashboard links,
- In the dashboard, click the icon on the top-right corner and select Manage Embed Links.
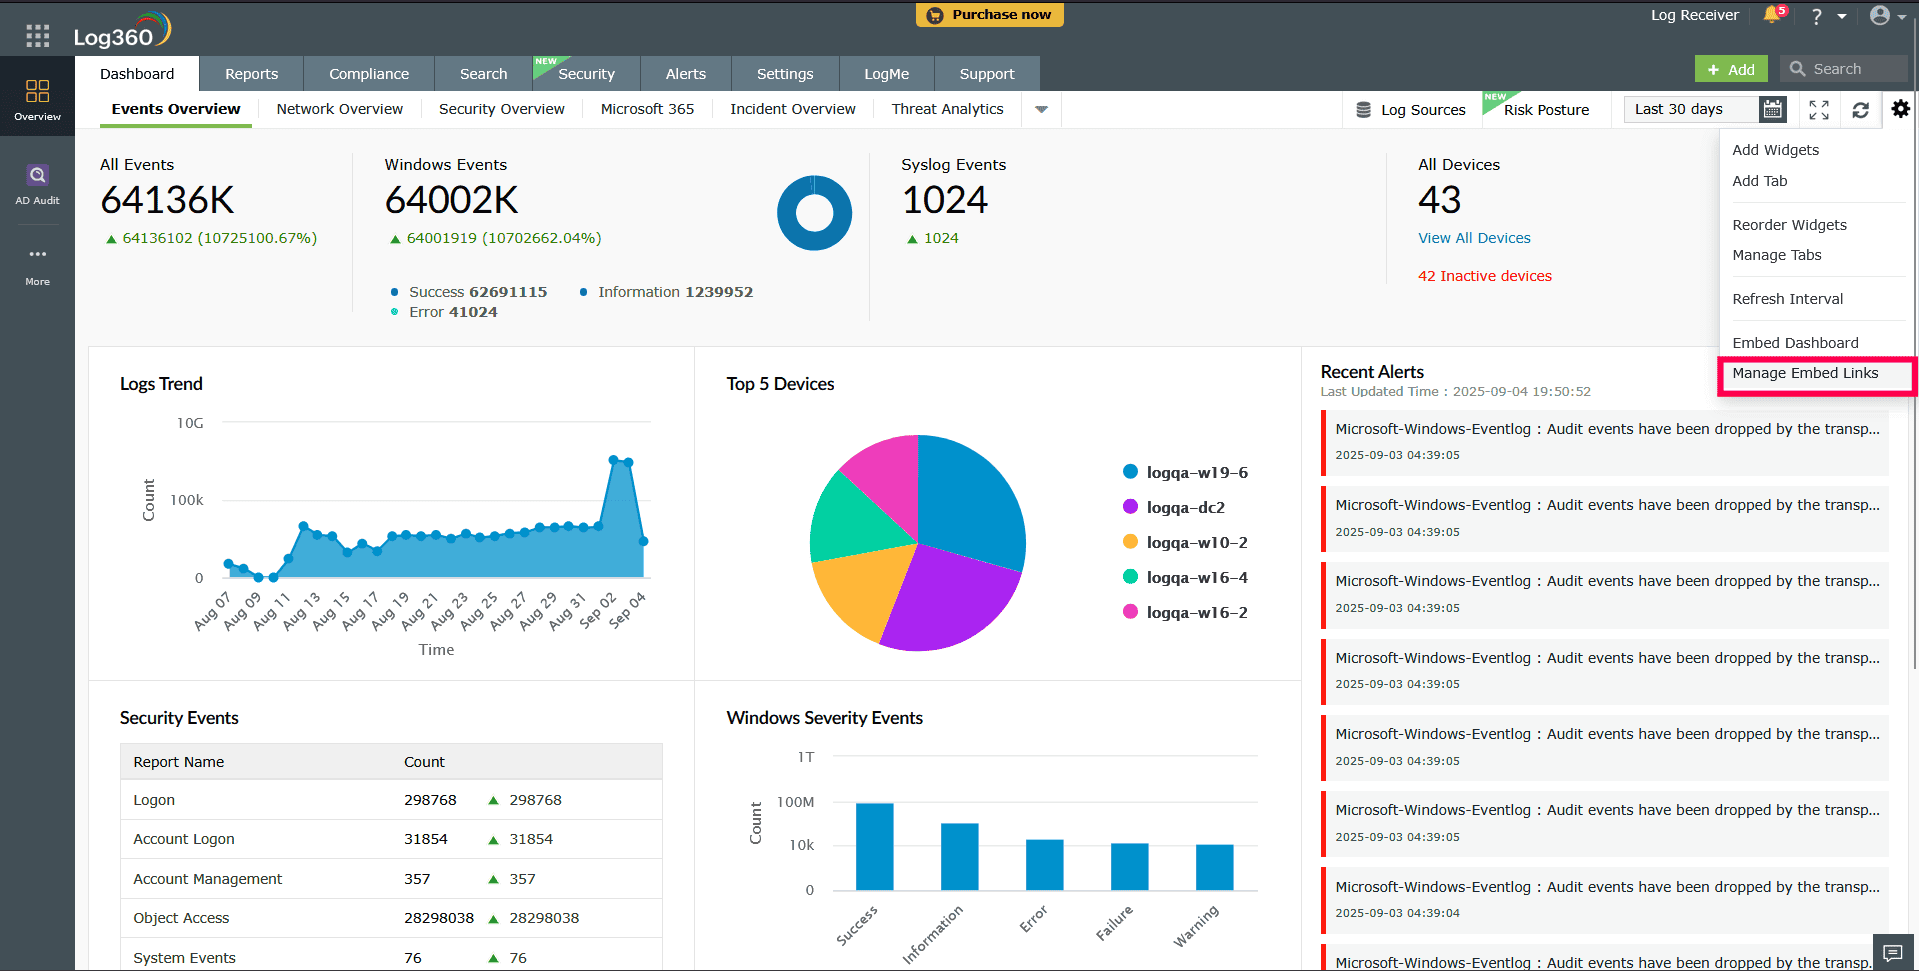
Figure 69: Accessing Manage Embed Links - A table will appear displaying all the Active Dashboard Links. Go to Embed Dashboard Links.
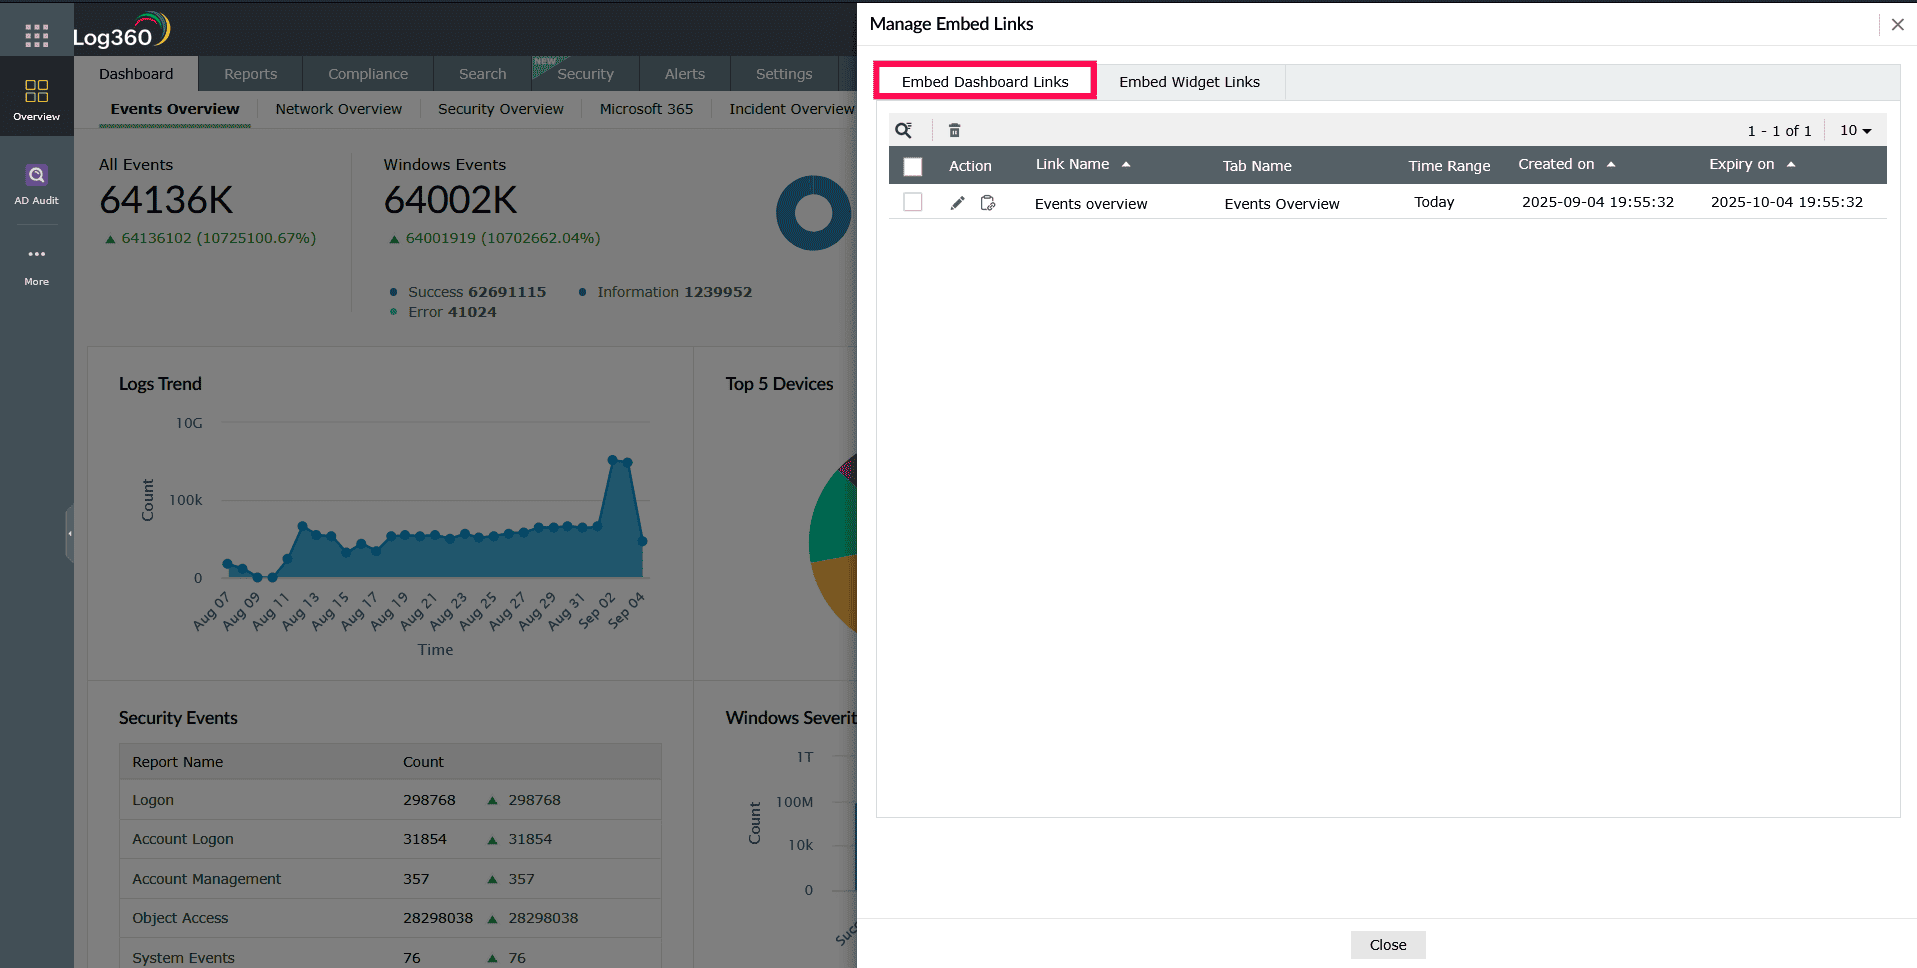
Figure 70: Viewing Active Dashboard Links - To edit a specific link, locate the desired entry and click the Edit option next to it.
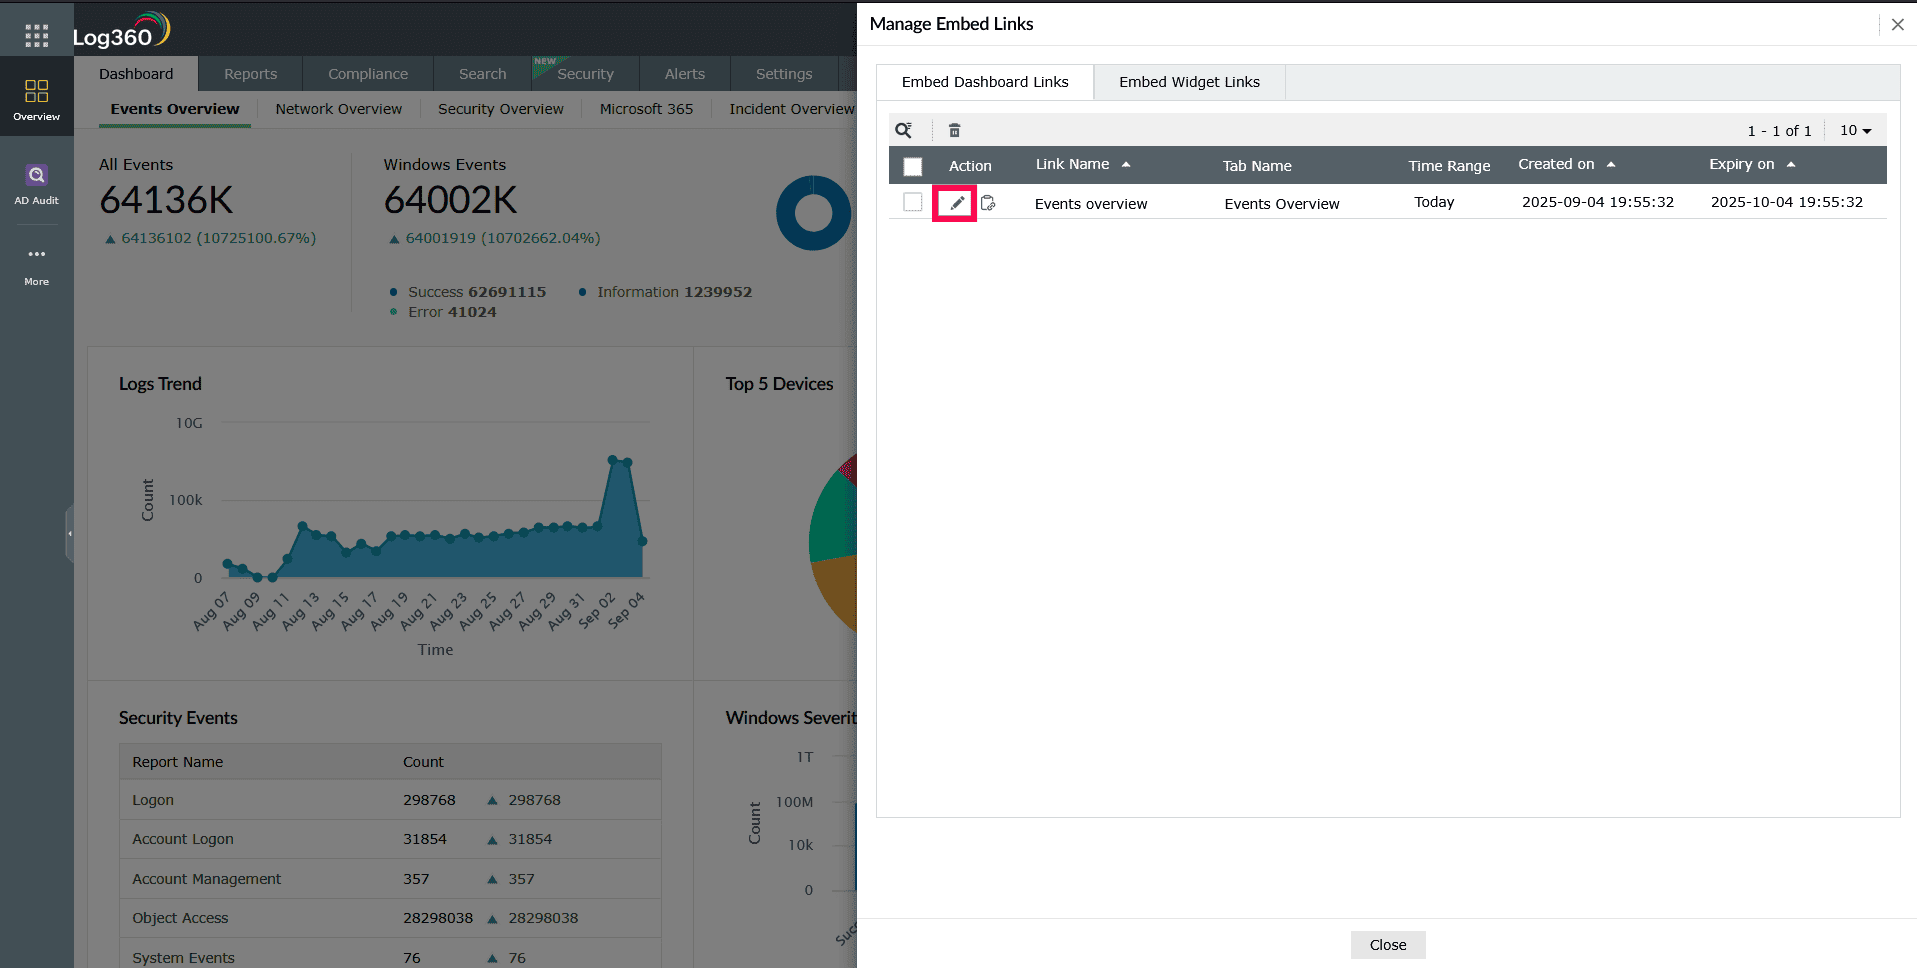
Figure 71: Editing Embed Widget Links - A window will appear allowing you to modify the properties of the chosen link. Make the necessary changes.
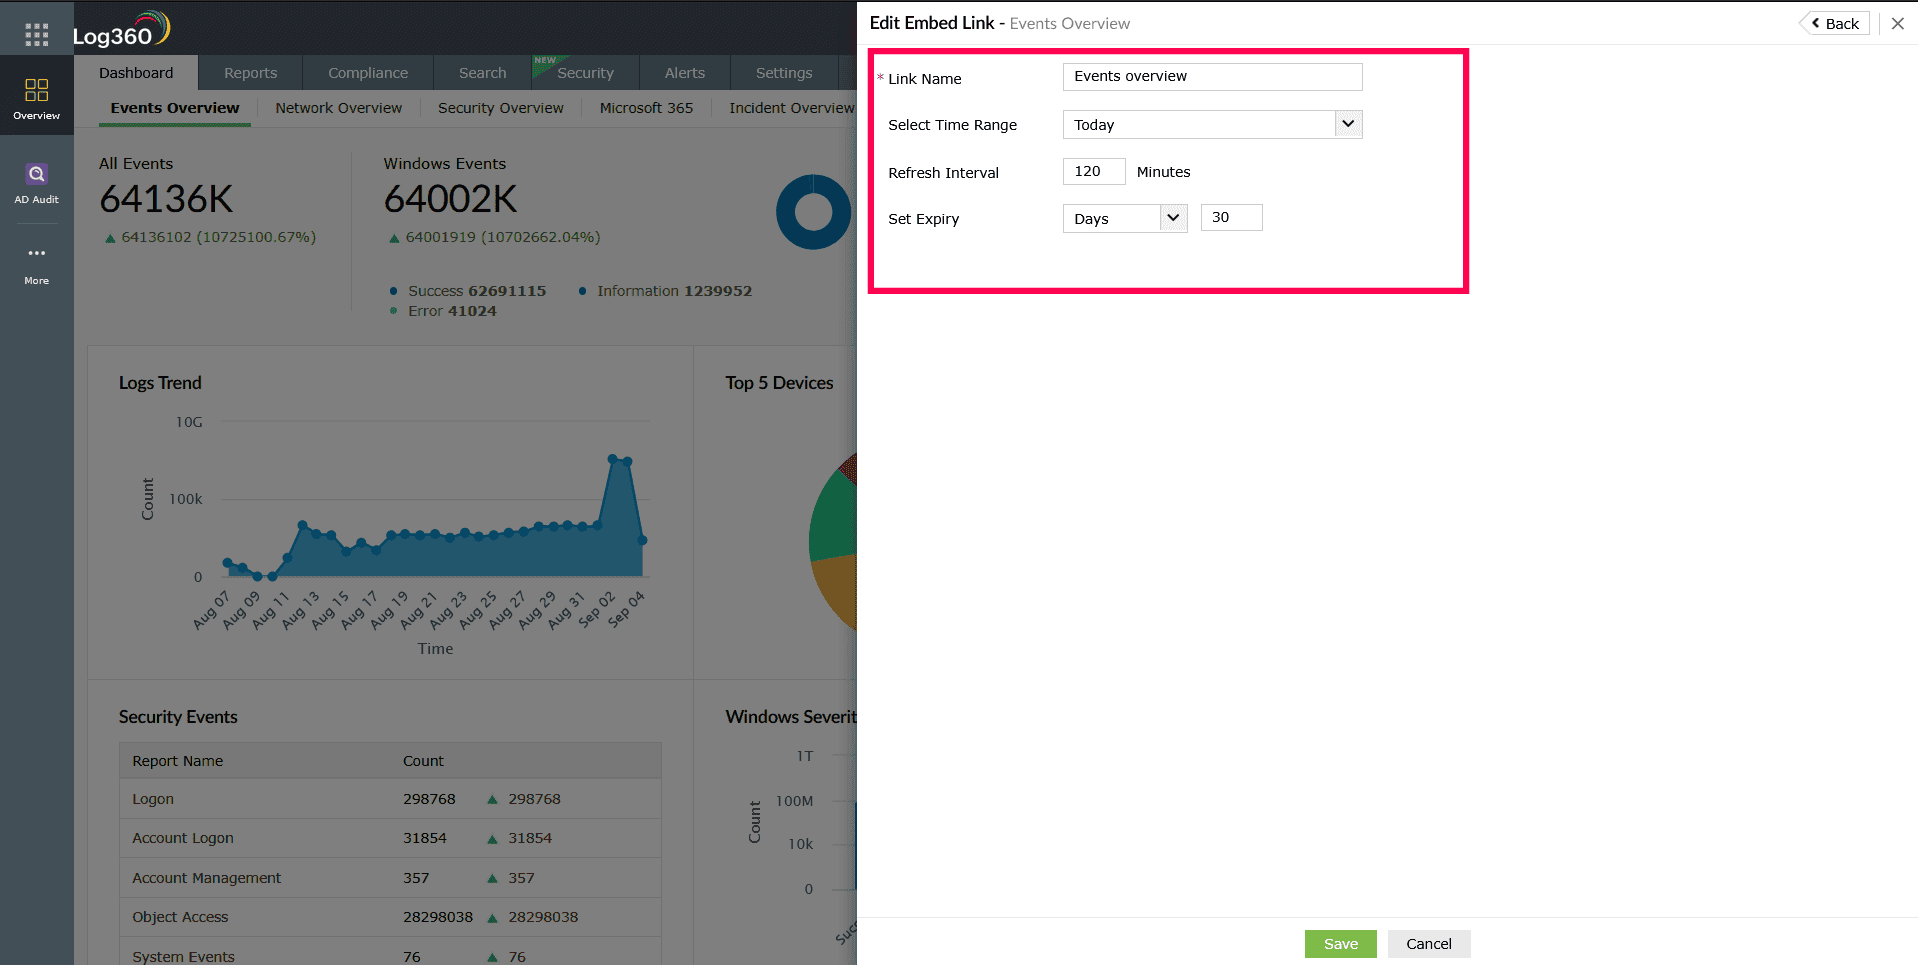
Figure 72: Configuring Edit Embed Link - Once done, click Save to apply the updates to the Active Dashboard Link.
- To delete, select the checkbox next to the entry you want to remove and click the icon.
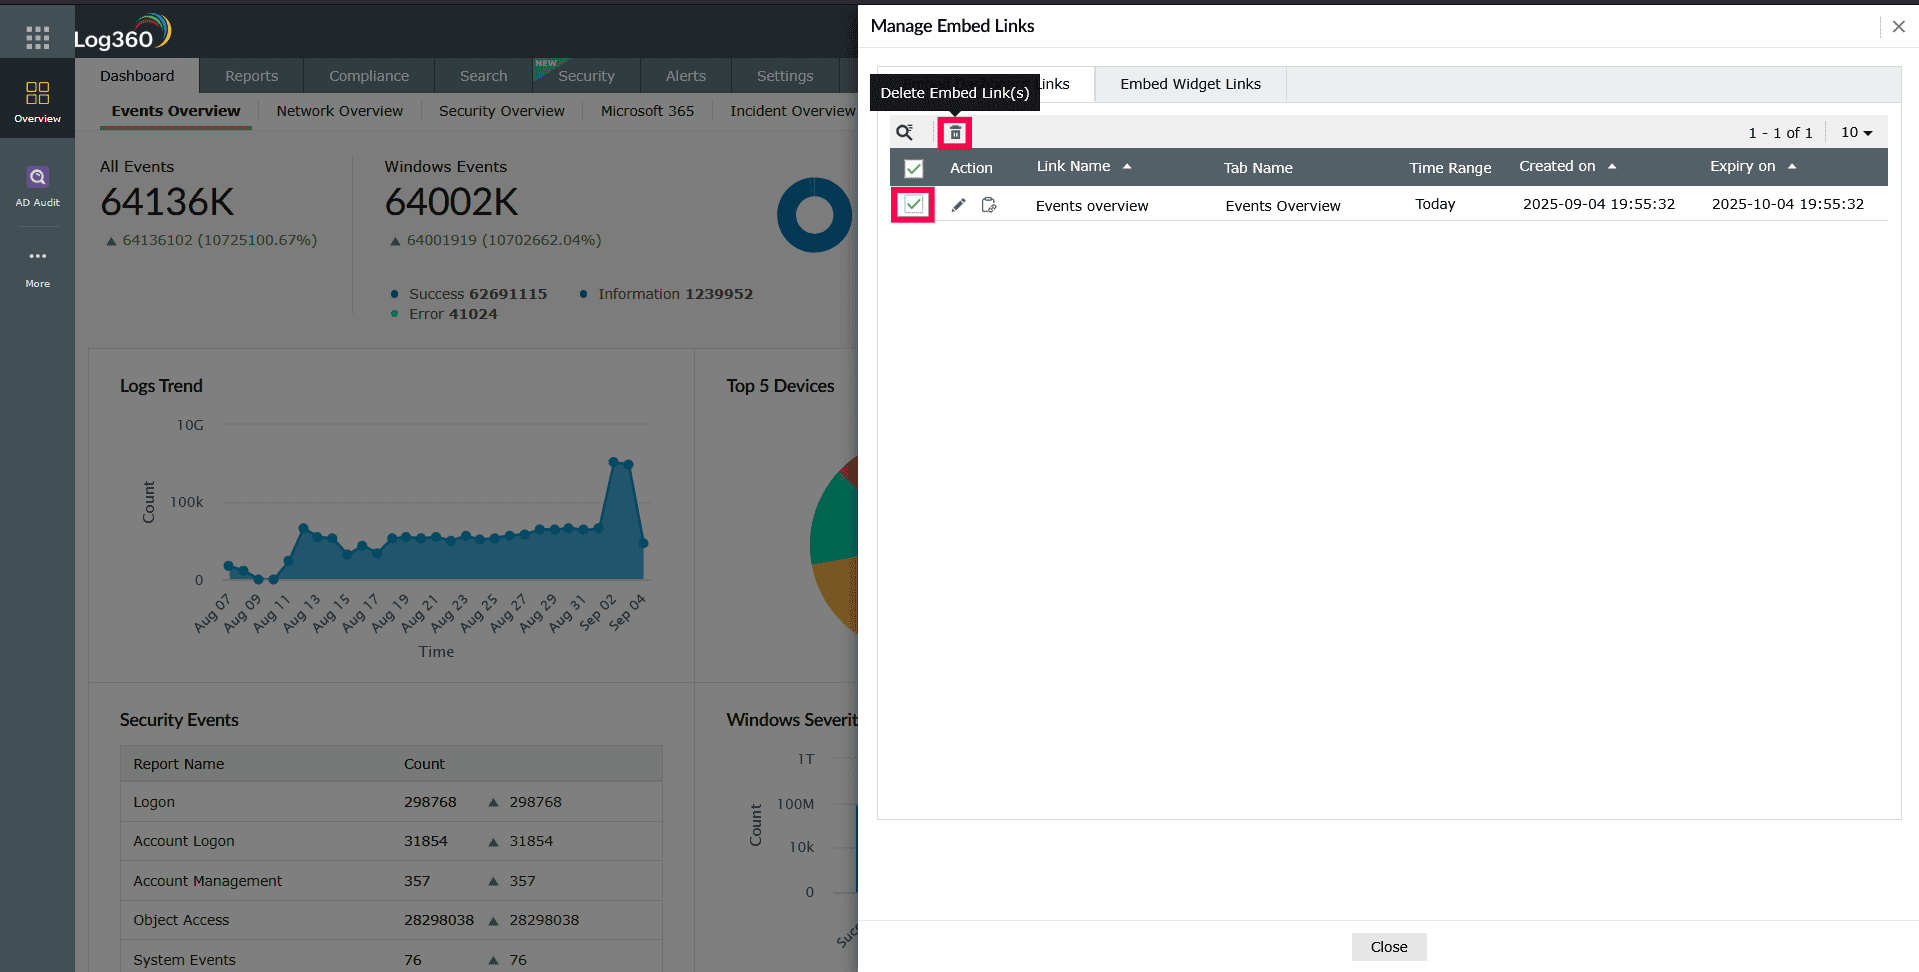
Figure 73: Deleting an embed link - In the confirmation pop-up, click Yes to delete the embed link from the list permanently.
- To regenerate the link, select the
 icon. In the window that opens, click Regenerate Embed URL to generate a new embed URL while retaining the existing configuration.
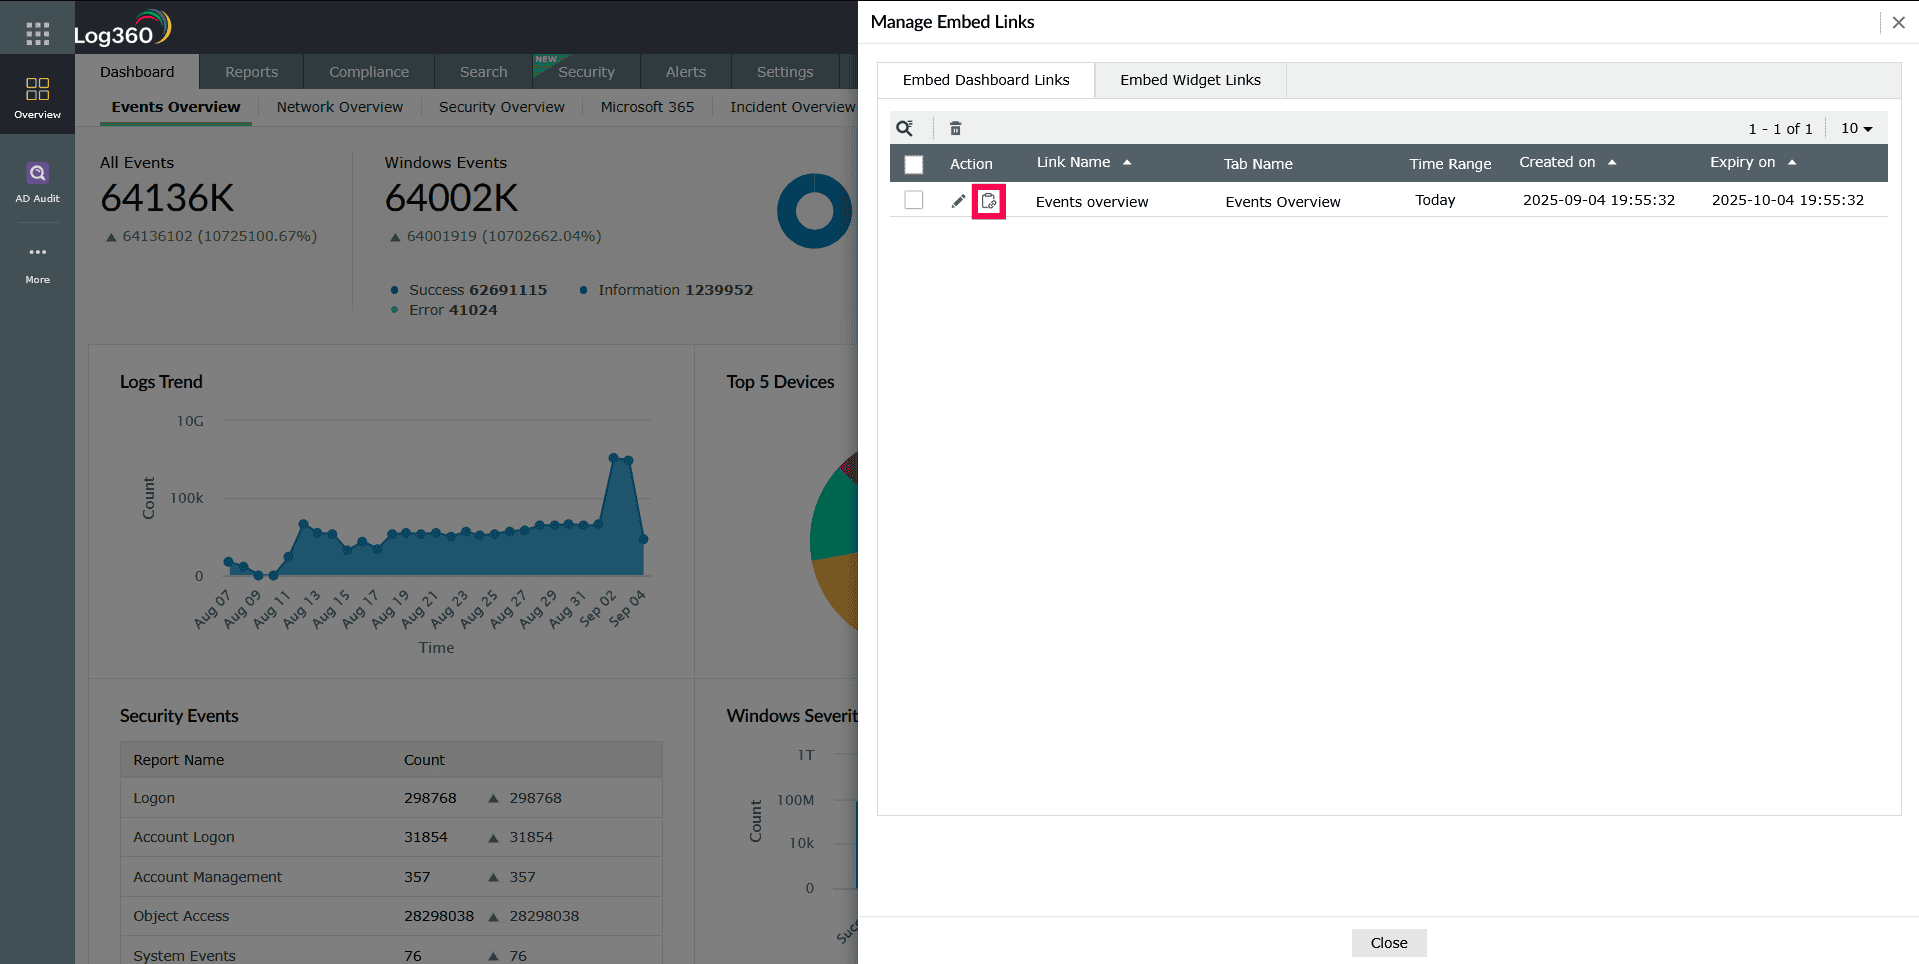
Figure 74: Regenerating Embed URL
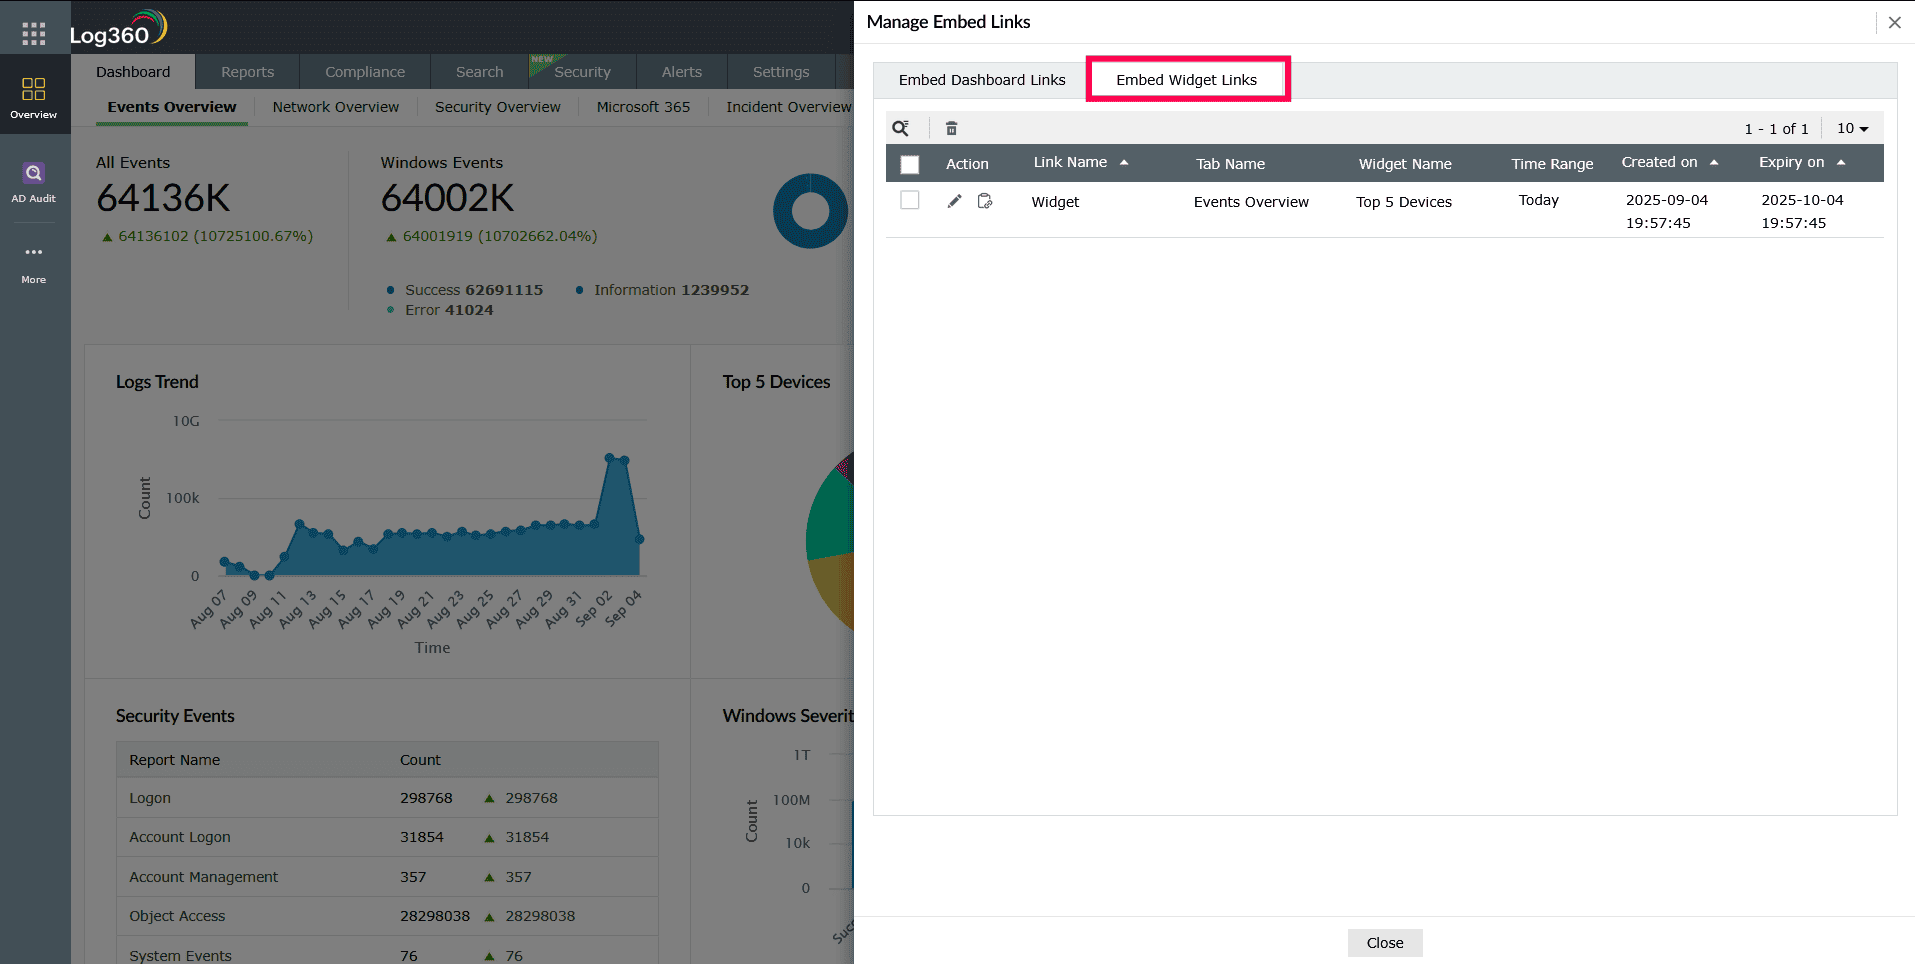
To manage embed widget links,
- In the dashboard, click the icon on the top-right corner and select Manage Embed Links.

Figure 75: Accessing Manage Embed Links - A table will appear displaying all the Active Dashboard Links. Go to Embed Widget Links.
Read alsoThis page explained about customizing the Log360 dashboard to tailor tabs and widgets. To learn more about predefined dashboard views and widget management, refer to the following documents: