Monitoring Windows Event Logs
Event logs are used to monitor the windows servers in your network. The logs help you monitor the program, security, and system events occurring in Windows devices. For example, you can identify performance issues like a process failure or security events like unauthorized login requests.
- Monitoring Windows Events in a Device
- Creating an Event Log Monitor
- Monitoring Custom Event Logs
- Configure event log monitoring for multiple devices
- Automate event log monitor association during discovery
- Receive notifications on events
How to monitor event logs on a device
In a Windows machine, there is a default event viewer that helps you to view the events on that machine. But, manually checking the events through this method is not feasible if you want to monitor an enterprise network. OpManager supports event log monitoring and helps you easily identify critical events with the help of alerts.
Prerequisite: OpManager uses WMI to fetch the details of these logs from a Windows device.
So please ensure to provide the user login credentials with administrative privileges to access the end device. If you are a non-admin user (visit this KB article to know more). To monitor Windows events, you need to associate the event log monitors with the device.
Once you have ensured you have the necessary permissions, follow the steps given below:
- Navigate to Inventory → Devices and then click on a device.
- Click Monitors -> EventLog Monitors -> Add Monitor.
- Select the event logs to be monitored on the device.
- Click Associate to add the selected monitors to the device.
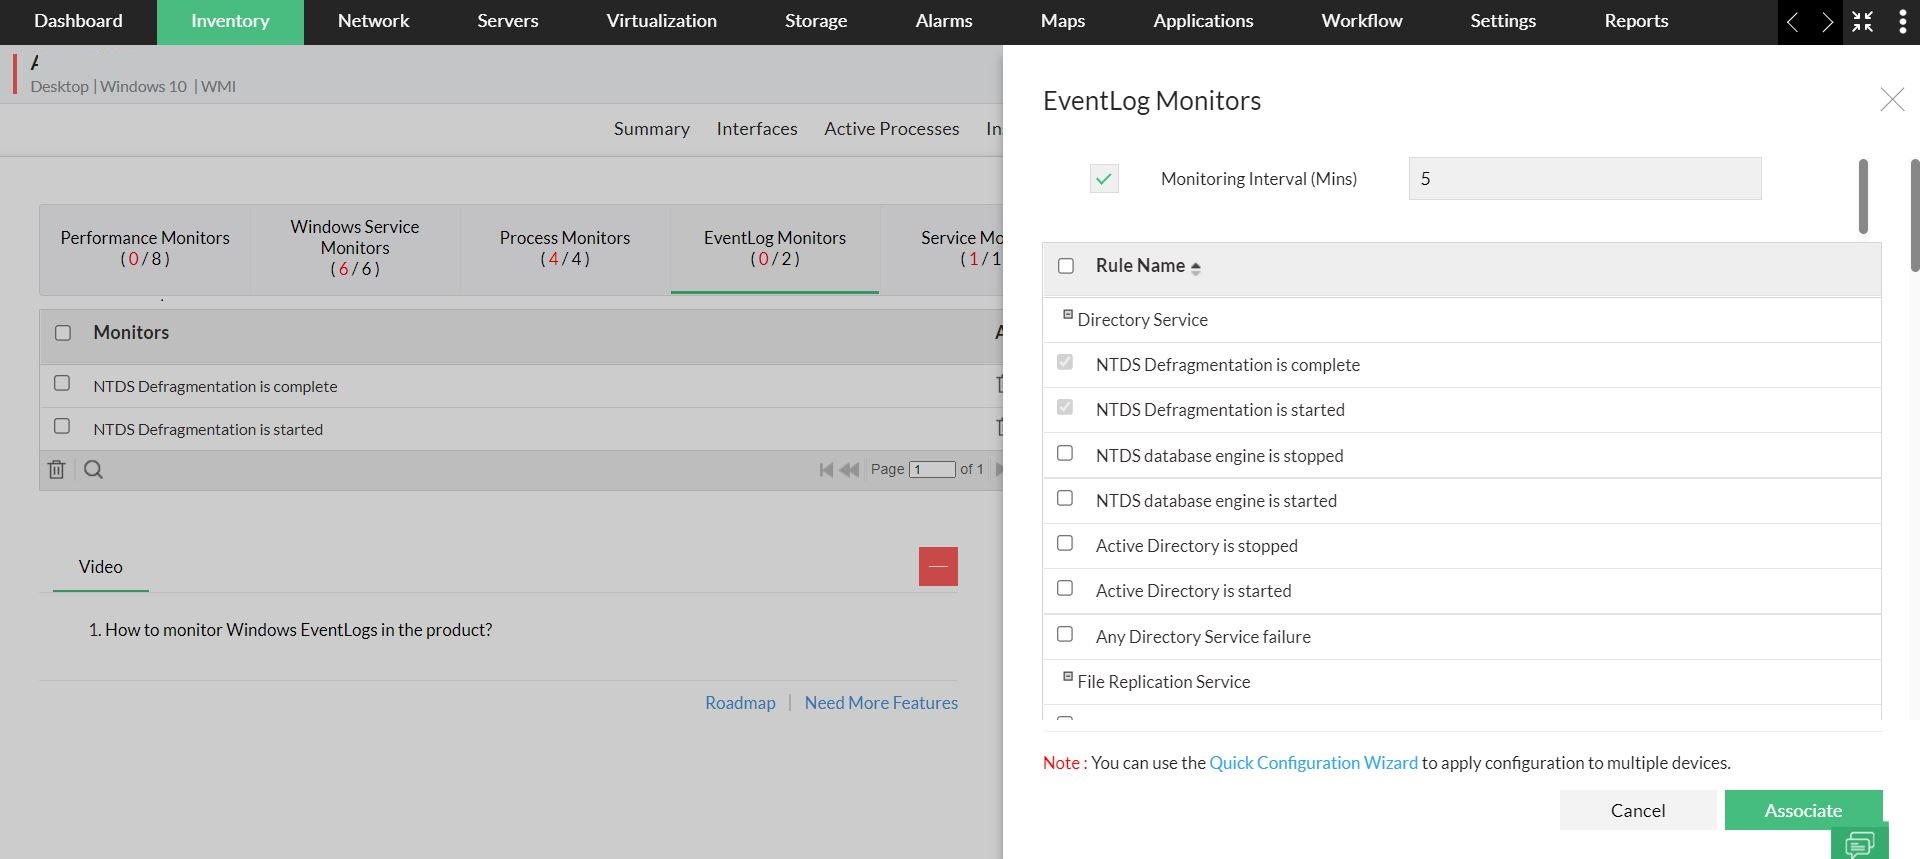
Creating an Event Log Monitor
To create an event log monitor, follow the steps given below:
Go to Settings > Monitoring > Event Log Rules
In this page, you can see the default rules supported by OpManager. They are categorized into Applications, Security, System, DNS Server, File Replication Service, and Directory Service.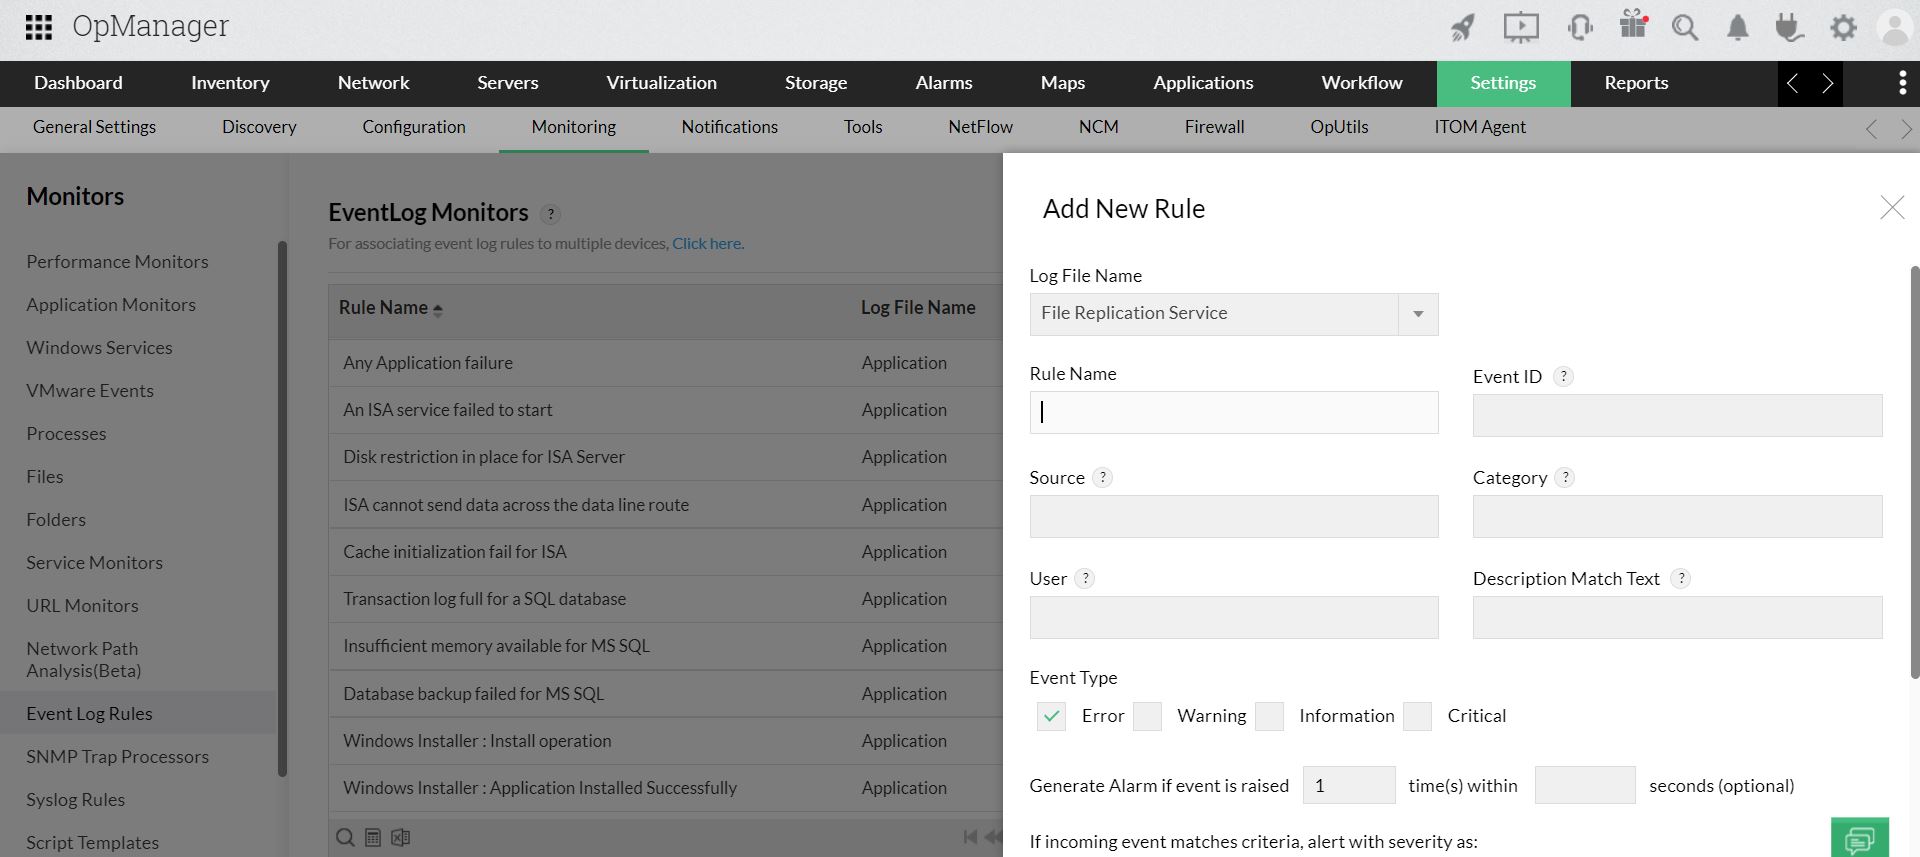
- To add a new rule, click on Add.
Note:: Entries to all the fields except Rule Name are optional. The details you input in the fields are required to filter the event. For example, when you mention the source and event ID, all events with the given ID from the mentioned source will be monitored. In another instance, if you mention only the category such as error, all events with error category will be monitored.- Select the Log File Name.
- Type a unique Rule Name.
- Enter the Event ID to be monitored. This is the unique identifier for the event logs.
- Enter the event Source. This is the source that logs the event, it can be an application or a sub-component of an application. For example: DesktopCentral, Microsoft Windows security
- Enter the event Category. Each event source defines its own categories such as data write error, data read error and so on and will fall under one of these categories.
- Type the User name to filter the event log based on the user who has logged on when the event occurred.
Choose the Event Types to filter the event logs based on their type. This will typically be one among Error, Warning, Information, Security audit success and Security audit failure.
Description Match Text : Enter the string to be compared with the log message. This will filter the events that contain this string in the log message.
You can also use Regular Expressions (RegEx) to specify the match criteria for this field. For example, consider an Eventlog description that reads "Check whether any firewall is blocking". Below are some examples of how you can form RegEx patterns for this message:
Condition Logic used RegEx pattern Actual RegEx Contains both "Check" and "any" AND (?=.*XXX)(?=.*YYY) (?=.*Check)(?=.*any) Contains either "blocking" or "firewall" OR (XXX)|(YYY) (blocking)|(firewall) Not contains "firewall" NOT ^(?!.*XXX).*$ ^(?!.*firewall).*$ - Generate Alarm if event is raised: By default OpManager raises an alarm if the event occurs. However, you can configure the no. of consecutive times the event can occur within the specified no. of seconds, to raise an alarm.
- Choose a severity for the alarm generated in OpManager for this event. For example, for security events you can assign the severity as critical. The severity levels available are Critical, Trouble, Attention, Clear and Ignore event. (The ignore event option is used to avoid raising an alert for an event)
- Click OK to save the event log rule.
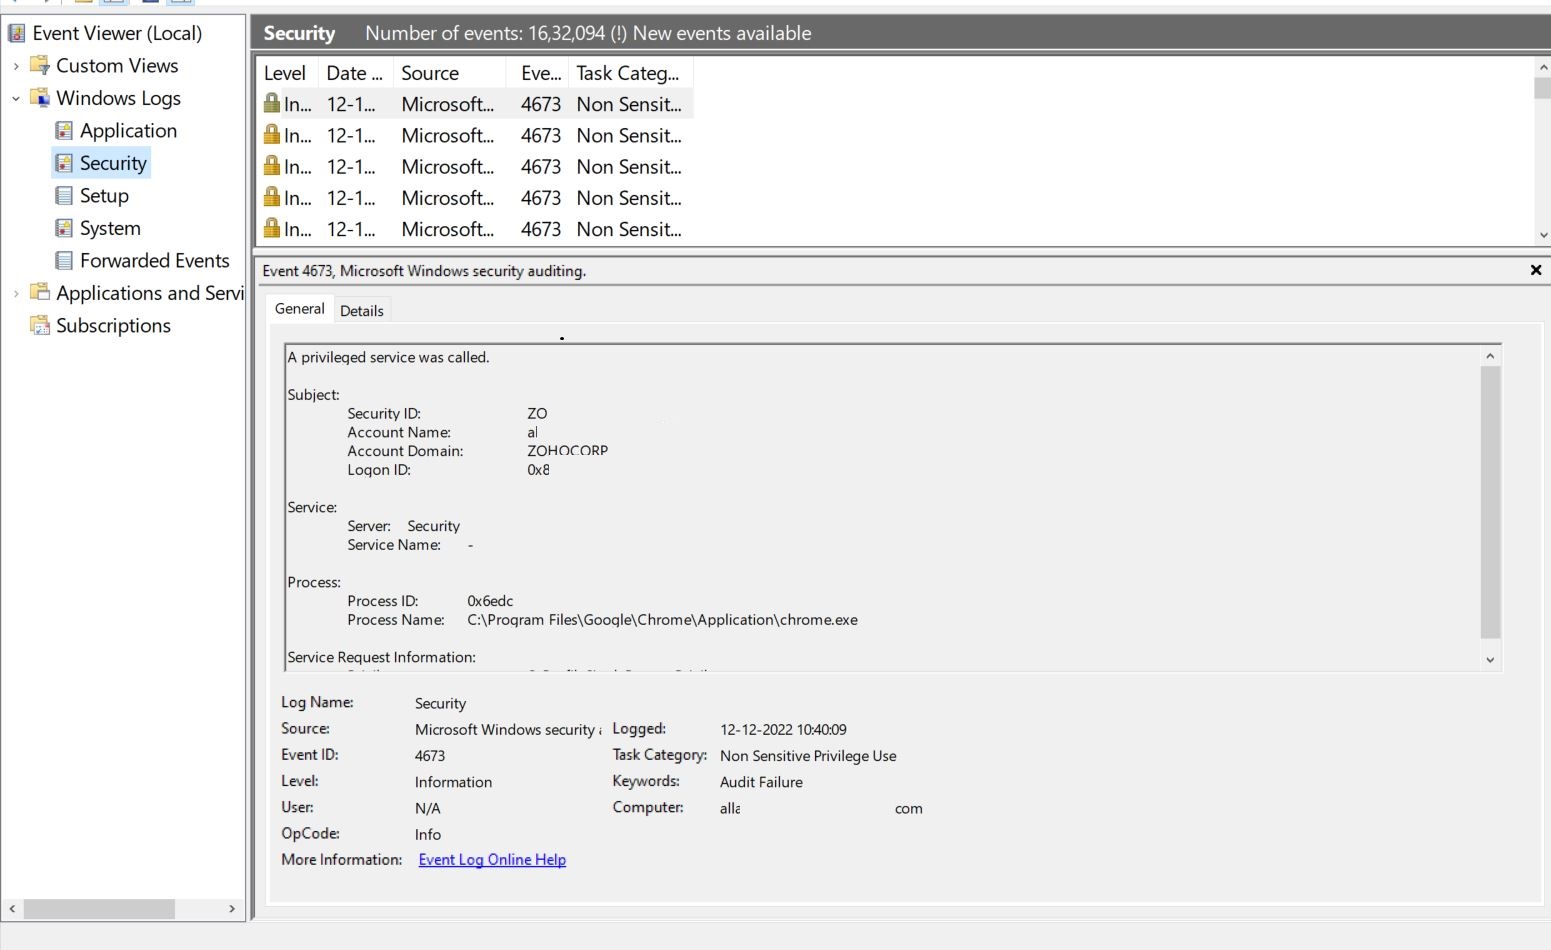
The above image shows an example of a security event. From the event viewer you can take the necessary details, specify them in OpManager and monitor the event.
Monitoring custom event logs
You can monitor event logs under a custom category too. Some applications log the events in a new category other than the default System/Applications/Security category. You can now configure rules in OpManager to parse the events in such custom categories and trigger corresponding alerts in OpManager. Here are the steps:
- Go to Settings > Monitoring > Event Log Rules
- Click Add Custom Event log
- Select a device from the drop-down on which you can query for the event categories.
- Provide the WMI details User Name and Password of the device.
- List logs that were created in last: Configure the time to list the logs and Click Query Device.
- The custom logs in the selected device are listed. Select a log from Discovered Log Files and click OK
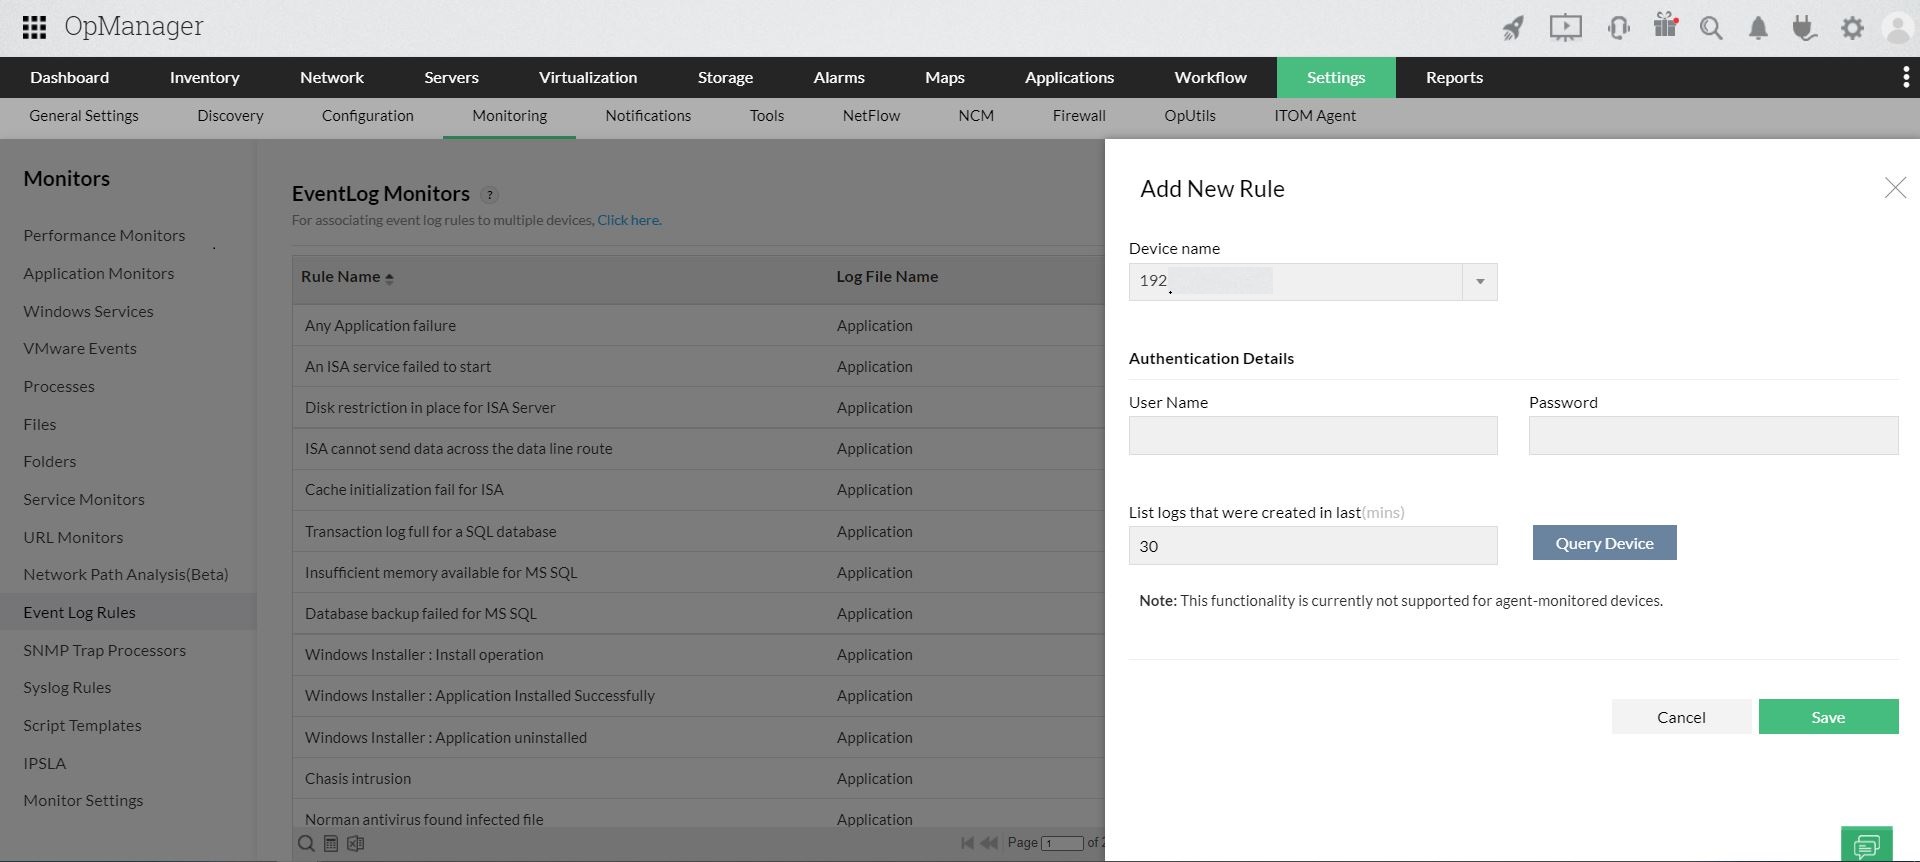
How to configure event log monitors for multiple devices in bulk
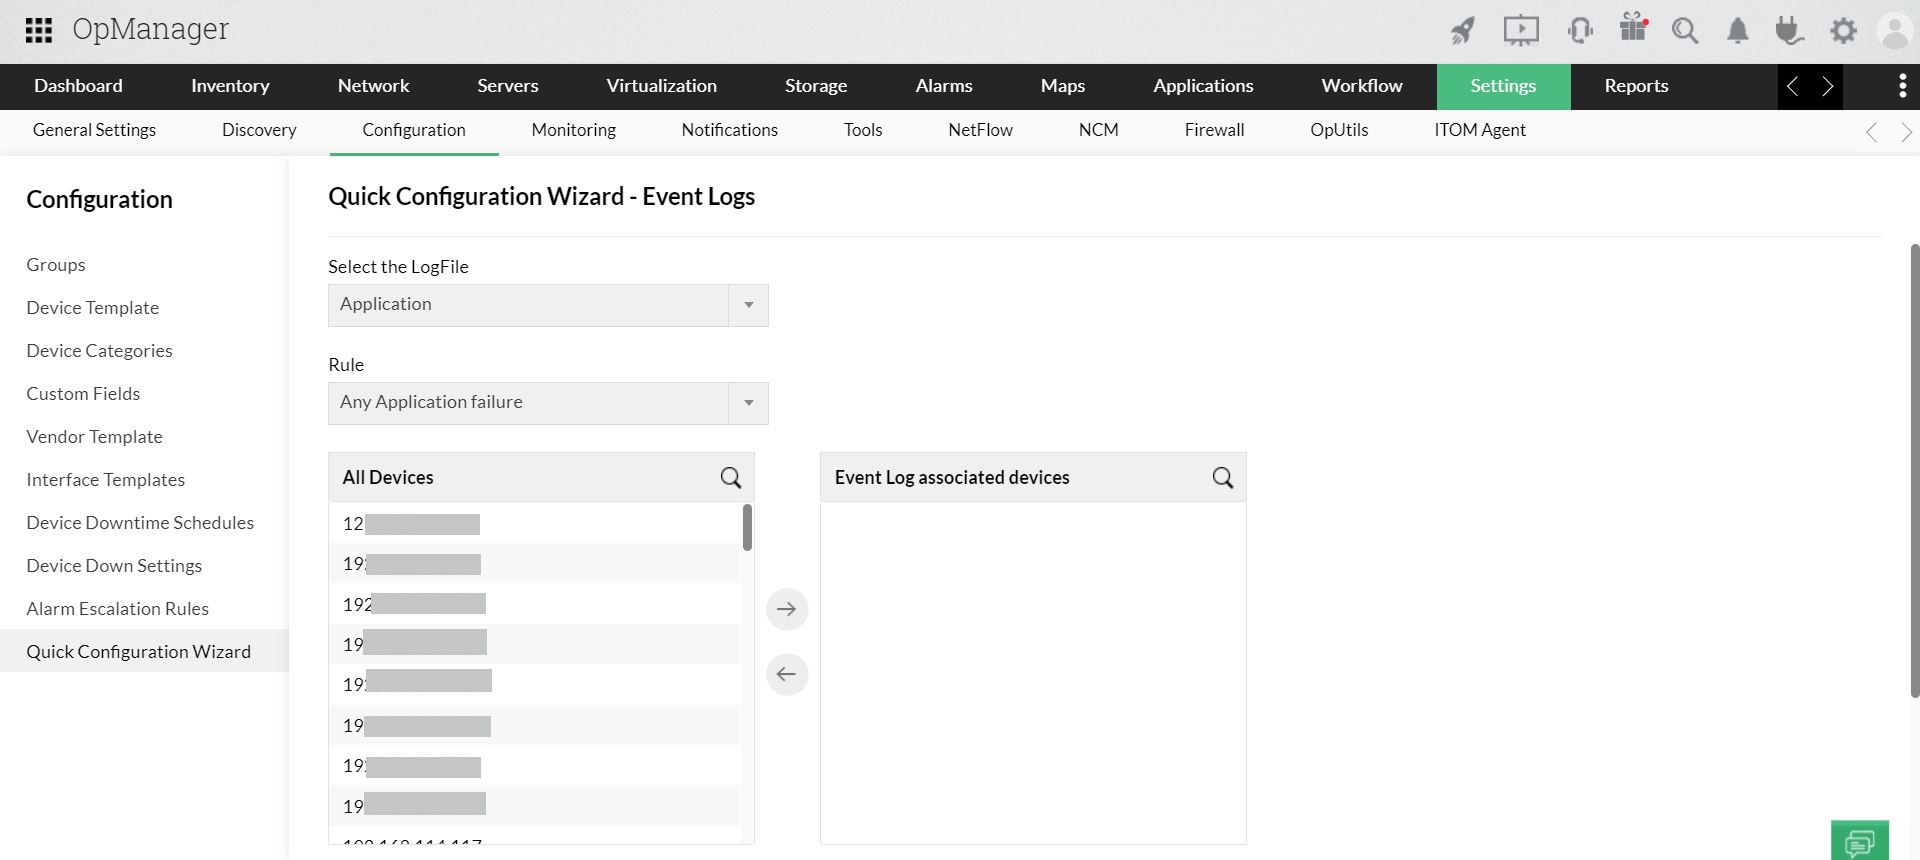
Associating event log monitors to multiple devices is made simple in OpManager with the Quick Configuration Wizard option.
- Navigate to Settings > Configuration > Quick Configuration Wizard.
- Click on Event log rules.
- Select the log file. E.g. Application, Security
- Choose the event you want to monitor under the Rule drop-down menu and associate the rule.
- Select the devices from the All Devices column, push them to the Selected Devices column.
- Click on Save. The monitors will be associated to all the selected devices in your network.
Automate event log rule association to devices
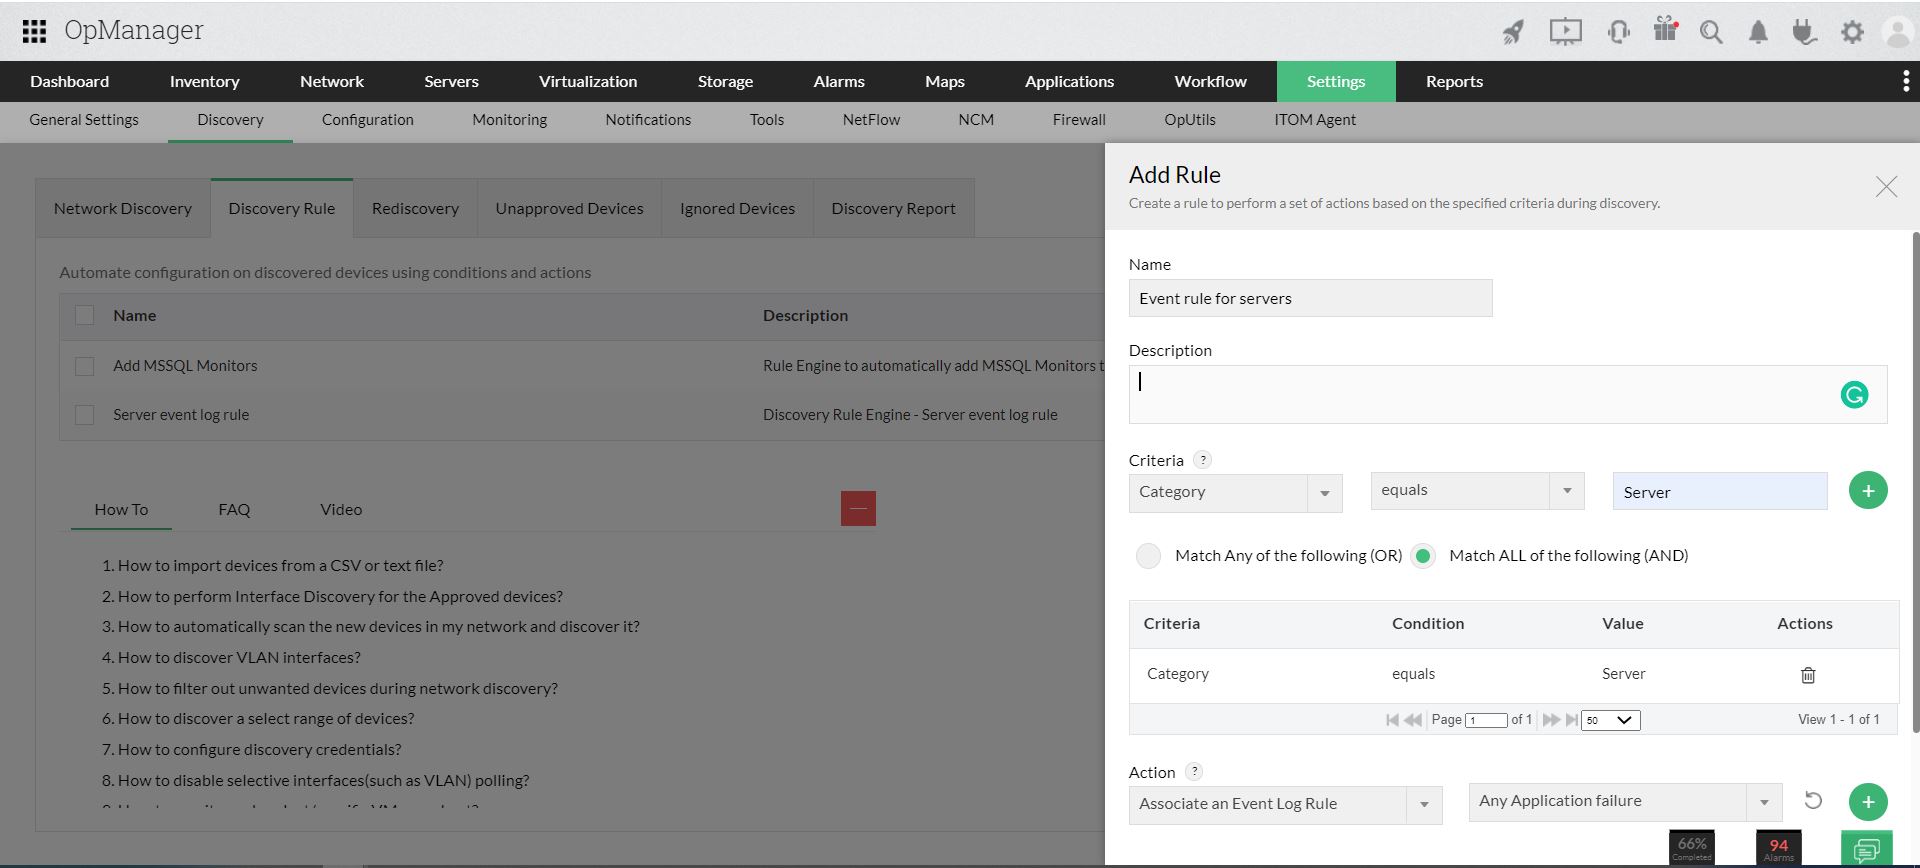
Applying event log rules to multiple devices is easier using the QCW, however, say if you discover new devices frequently for monitoring, then adding event log monitor to new devices would be a cumbersome task.
You can automate the process of event log rule association using the Discovery rule engine. Using this option you can create your own rule to associate event log rules to specific devices like Windows servers.
The event log rule will be applied to Windows servers whenever they are discovered in OpManager.
Receive instant notifications on critical events
You can configure to receive notifications for important windows events through various channels such as SMS/email using the Notification Profile feature. While selecting the criteria to receive notifications, select the Event Log rule generate alarms box to raise events related alarms using various channels.