About Reports
Intuitive dashboards and detailed reports helps you determine the performance of your network in very less time. OpManager allows you to export the default reports to other file formats such as exporting to PDF or XLS. You can also schedule the reports to be emailed or published.

The default reports available in OpManager include:
- System: Provides a complete report on all the system related activities of all the devices. This category of reports include All Events, All Down Events, SNMP Trap Log, Windows Event Log, Performance Monitor Log, Notification Profiles Triggered, Downtime Scheduler Log, Schedule Reports Log, All Alerts and All Down Alerts.
- Health and Performance: Gives you a detailed report on the health and performance of all/top N devices.
- Availability and Response: Gives you a detailed report on the availability and the response time of all/top N devices
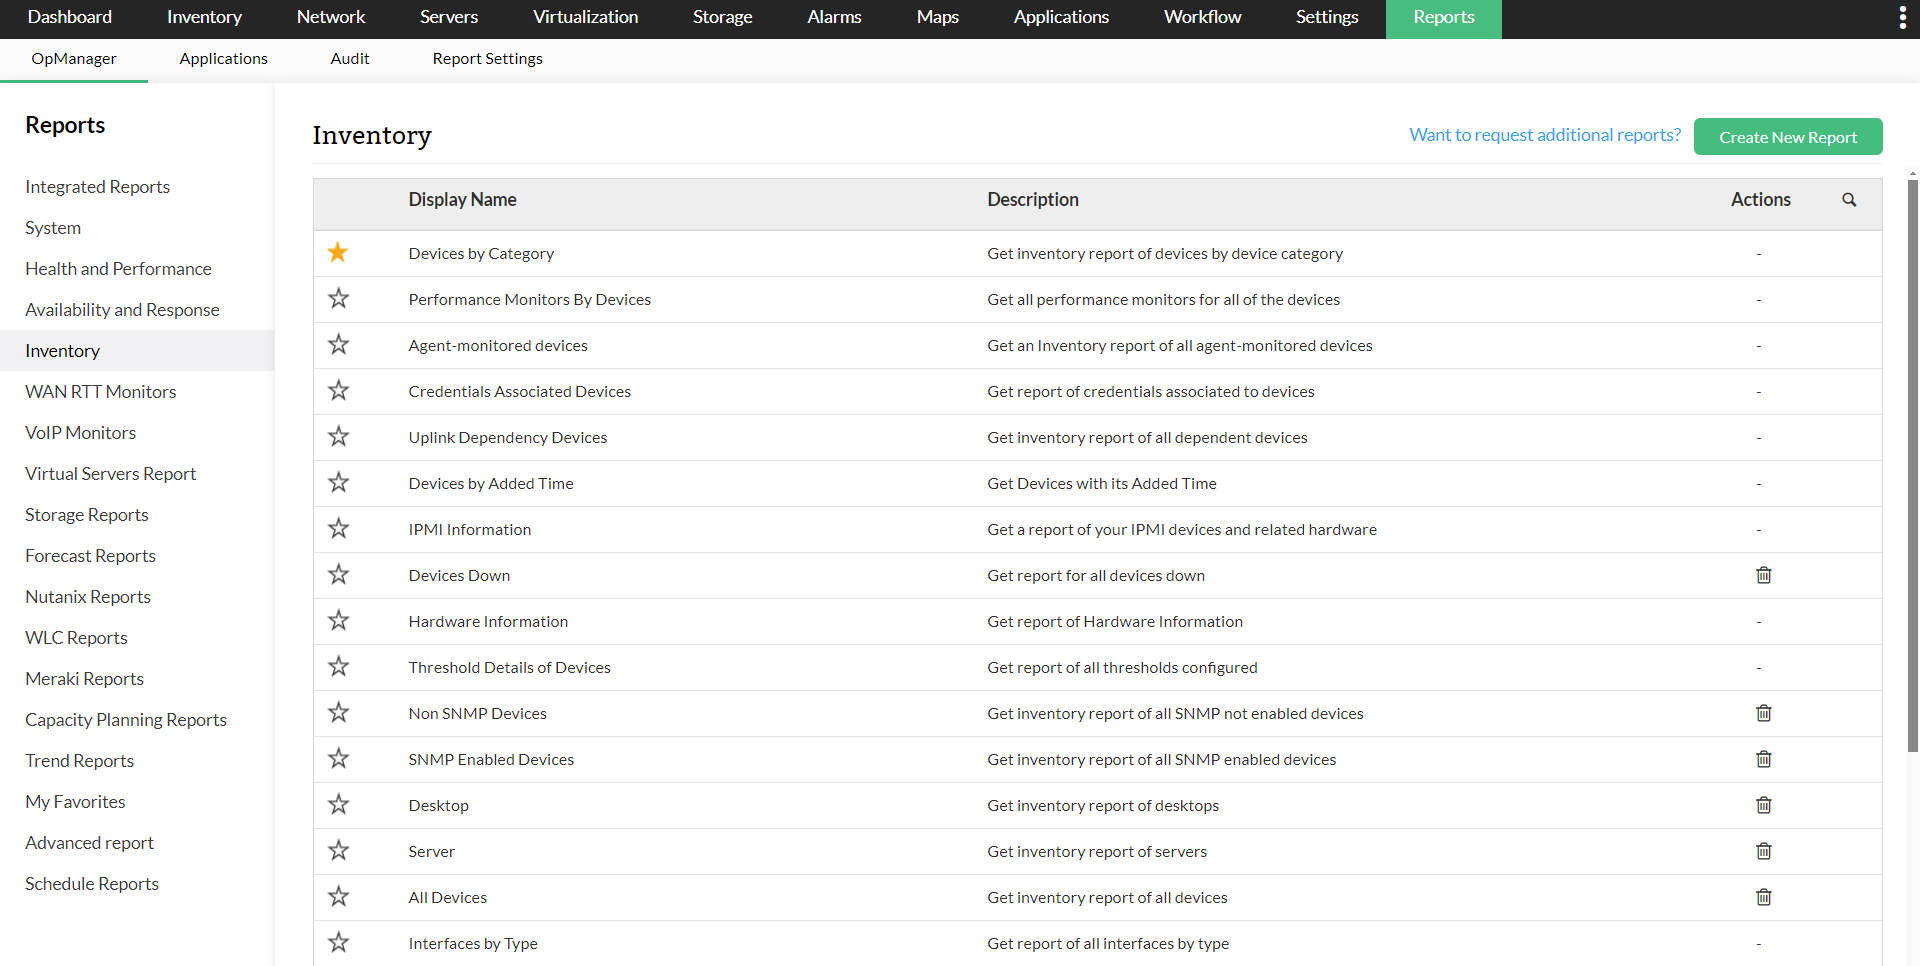
- Inventory: Inventory reports are available for servers, desktops, all devices, SNMP-enabled devices and non-SNMP devices.
- WAN RTT Monitors: Gives you a detailed report on RTT & threshold of ICMP packets and availability statistics of paths.
- VoIP Monitors: Gives you a detailed report on various factors related to VoIP packets & traffic.
- Virtual Server Reports: Gives you detailed reports on your VM's which includes stats like list of all idle VM's, VM's with over-allocated CPU etc.
- Storage Reports: Gives you detailed reports on the performance of your storage devices.
- Forecast Reports: Get forecasts on usage of CPU, memory and disk of all devices in your network, calculated based on history of utilization.
- Nutanix Reports: Get Inventory and performance reports for Nutanix devices in your network, such as Cluster/Host summary, usage stats about your storage container and disks, and Cluster/Disk Inventory reports.
- WLC Reports: Get detailed availability and inventory reports of access point and rouge SSIDs. Also, the access points that are discovered in OpManager (advanced monitoring enabled) will have full access to all types of reports based on the type of device.
- Meraki Reports: Get in-depth information and maintain a detailed inventory about your Cisco Meraki infrastructure, including details about Meraki Access points, rogue device SSIDs, gateway, vision, radio, switch, and security devices.
- Capacity Planning Reports: Get in-depth insights into the utilization of the devices in your network.
- Trend Reports: Get key insights about the memory, disk and CPU utilization trends in your network.
- Load Balancer Reports: Have comprehensive understanding about your load balancers' availability, status, connection, traffic and packets.
- My Favorites:OpManager provides the option to categorize all your important and frequently viewed reports under My Favorites.
- Application reports: A separate sub category for application monitoring data has been provided under the Reports tab. This category will appear only for users who have downloaded and installed APM plugin in OpManager.
- Schedule Reports: OpManager allows you to schedule a new report and also to schedule a generated report.
- Integrated Reports: Users can generate reports for devices and interfaces in OpManager. While generating reports the time window, the type of the report and monitors associated to the device can be specified. These reports can be saved and accessed by navigating to Reports --> Integrated Reports in OpManager.
- Advanced Reports: OpManager has advanced report generation capabilities that enable users to create and view data on multiple monitoring parameters in a single report. There will be as many columns as per the number of monitoring parameters specified.
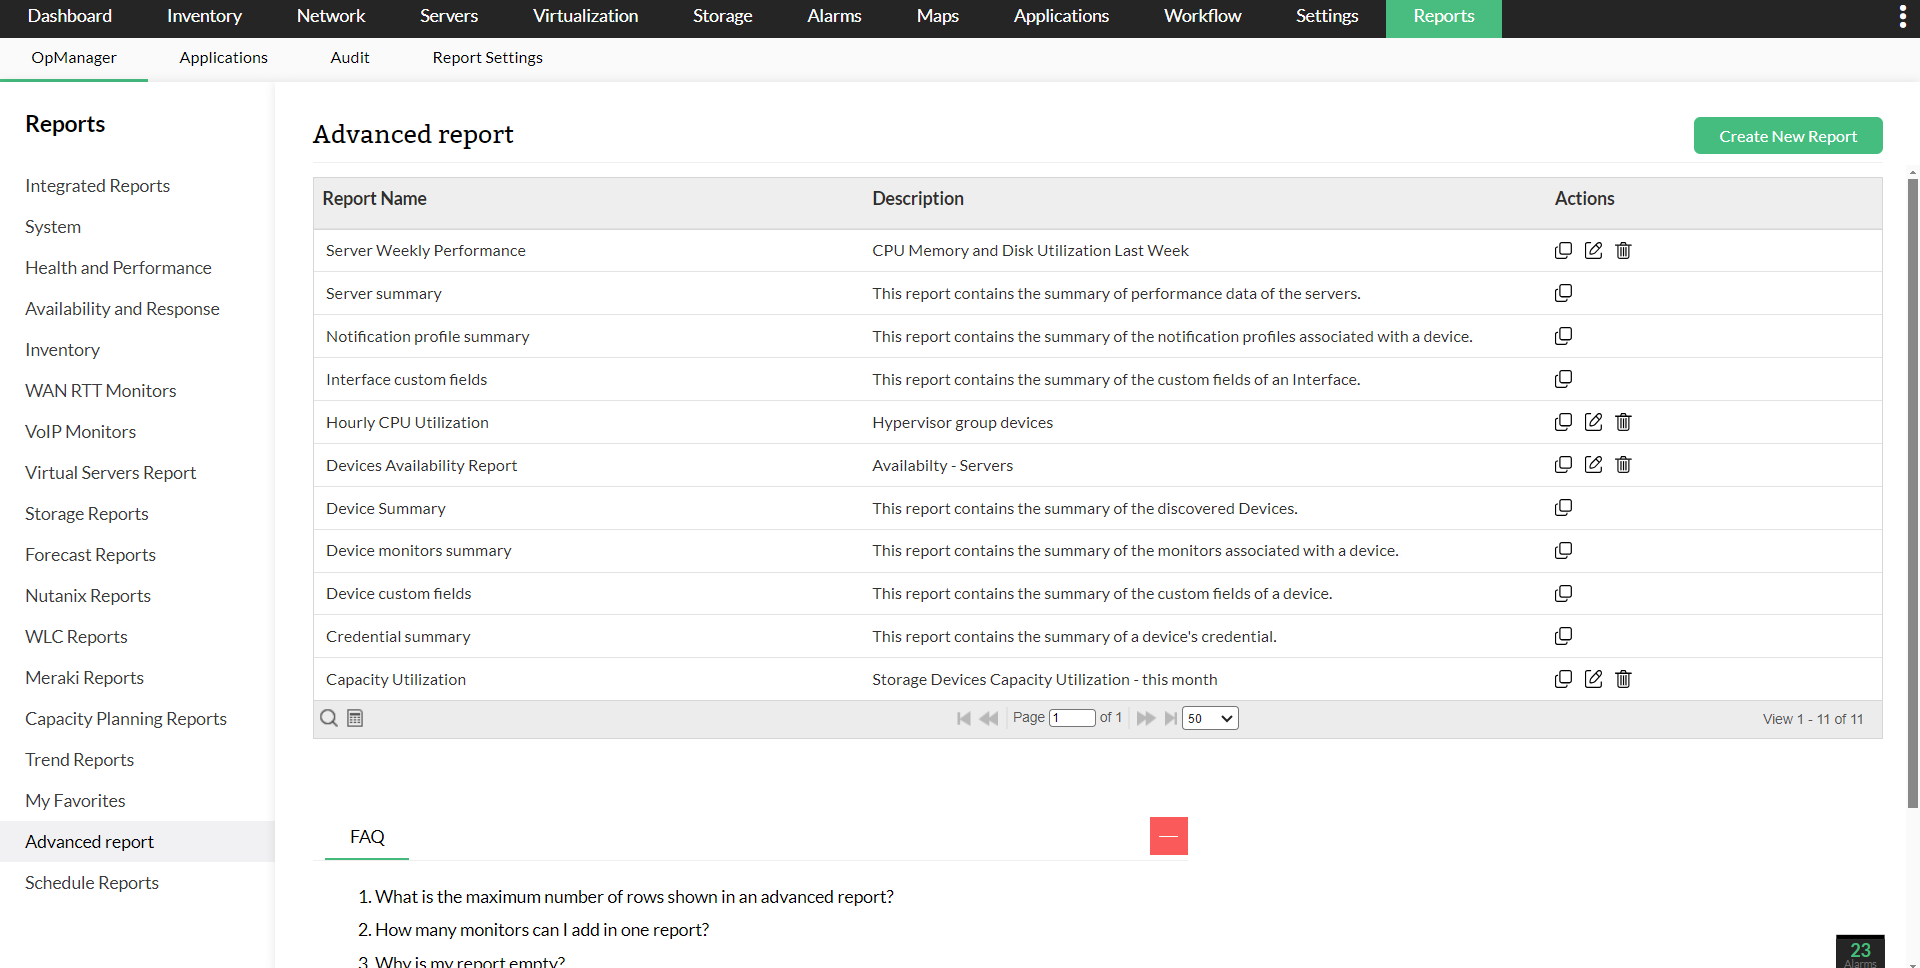
Click here for a more detailed description about the Advanced report feature.