Performance Report for APM Insight Java Agent
Test Configuration
- Application: E-commerce store built using Spring Framework
- Java Version: Java 11
- Database: MySQL
- Request Load: 2,000 HTTP requests per minute
- Test Duration: 1 hour
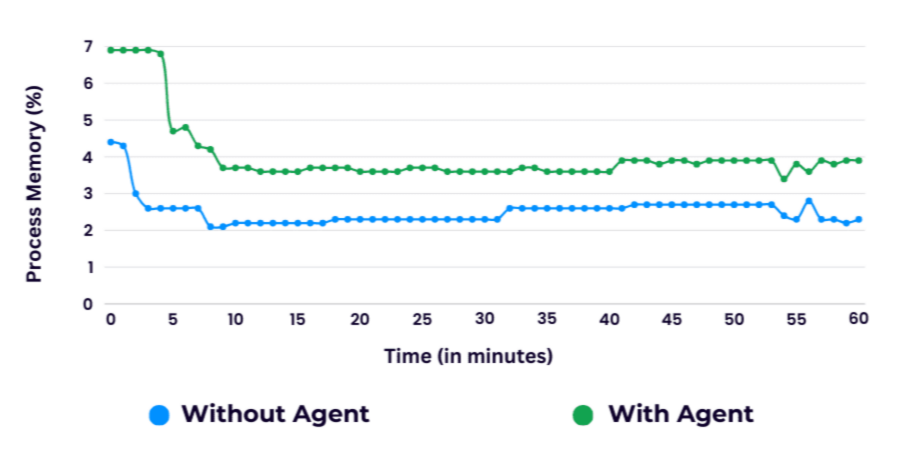
Memory Consumption
- The APM Insight Java agent consumes between 100 MB and 800 MB of memory depending on the load and configuration.
- Peak consumption (around 800 MB) may occur when full transaction tracking (including traces, exceptions, etc.) is enabled.
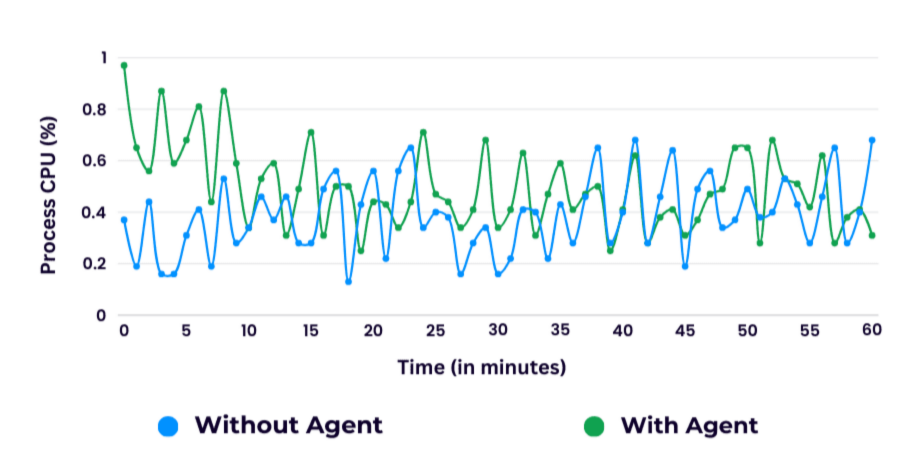
CPU Usage
- The agent introduces a maximum of 2% additional CPU load compared to running the application without monitoring.
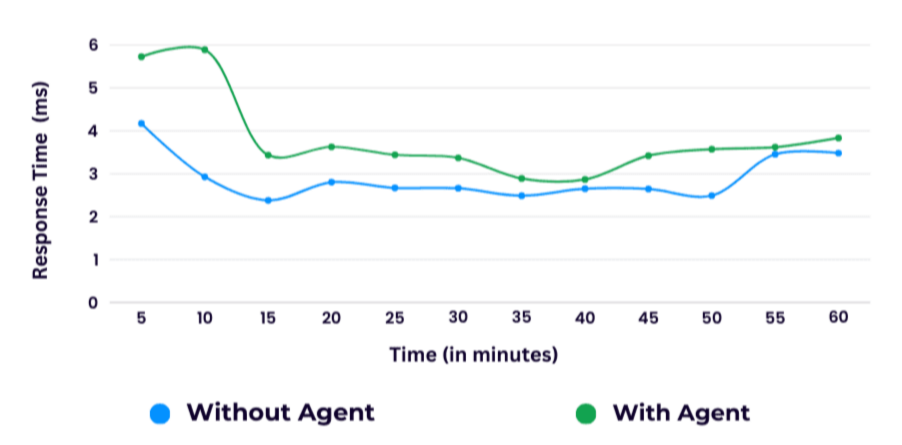
Response Time Overhead
- When configured with default instrumentation to track all method calls, the Java agent adds an overhead of approximately 3.5%—3.7% to the response time.
- This overhead increases proportionally with the number of methods and classes instrumented (e.g., with extensive custom instrumentation).
Network Bandwidth Usage
- The Java agent communicates via one-way HTTPS to the monitoring server at a frequency of once per minute.
- Maximum bandwidth usage is approximately 5 MB per hour, making it highly efficient for continuous monitoring.
