Agent Performance Report for APM Insight PHP Agent
- Test Environment
- Impact on CPU usage
- Impact on Memory consumption
- Impact on binary data processing
- Impact on Application Response Time
Test Environment
- OS: 64 bit Linux OS
- CPU: Intel i5, 2.5 Hz, 4 cores
- Memory: 8 GB
- Apache Web Server
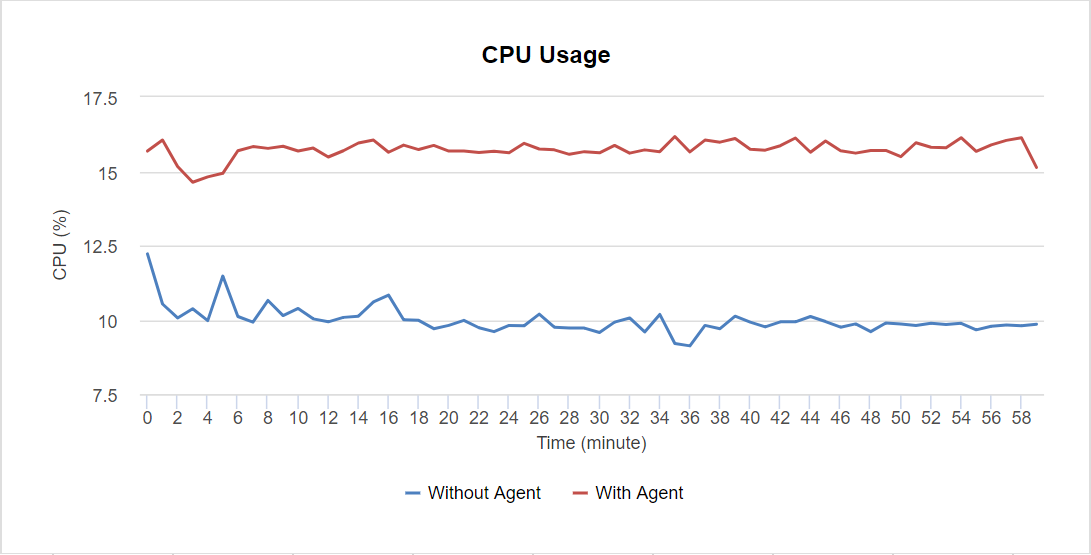
Impact on CPU usage
When the target web application is set to receive 300 requests per minute, the APM Insight PHP Agent consumes only 1 % CPU on average (using default production settings).
On increasing the throughput to 600 requests per minute, the APM Insight PHP agent consumes around 0.3-1.6% CPU on average.
The below table summarizes the details
| RPM (Requests per Minute) | % CPU Usage (Without Agent) | % CPU Usage (With Agent) |
|---|---|---|
| 300 | 0.1-0.2 | 0.1-1.2 |
| 600 | 0.6-1.9 | 0.9-3.5 |
Impact on Physical Memory (RAM) usage
The APM Insight PHP Agent by default collects performance data and pushes it to its own service, every minute, and hence, the footprint on the user memory is minimal, and only transient.
The memory usage is a maximum of 212 KB at an RPM of 300, and a maximum of 24 KB at an RPM of 600.
The below table summarizes the details:
| RPM (Requests per Minute) | Memory in KB (Without Agent) | Memory in KB (With Agent) |
|---|---|---|
| 300 | 6344-8852 | 6360-9064 |
| 600 | 6360-9856 | 6364-988 |
Impact on binary data processing
The above statistics are for agents running on an Apache web server. To understand how much memory and CPU the agent will consume when processing binary data, please see the below table.
| RPM (Requests per Minute) | % CPU Usage | Memory (KB) |
|---|---|---|
| 300 | 0.1-0.3 | 4740-6012 |
| 600 | 0.3-0.7 | 4740-6104 |
Impact on application response time
To calculate how fast php execution is, many use a PHP Benchmark script provided by http://www.php-benchmark-script.com/ The following table shows the impact of PHP agent's on your application's response time.
PHP version: 7.2.23-1+ubuntu18.04.1+deb.sury.org+1
Platform: Linux
| Benchmark | Version 2.8 | Version 2.9 | No Agent |
|---|---|---|---|
| test_ifelse | 1.446 sec | 0.805 sec | 0.763 sec |
| test_loop | 1.911 sec | 1.520 sec | 1.511 sec |
| test_stringmanipulation | 5.793 sec | 3.065 sec | 3.031 sec |
| test_math | 4.578 sec | 2.633 sec | 2.569 sec |
| total | 13.728 sec | 8.023 sec | 7.874 sec |
