Prerequisites for Applications Manager
Discussed below are the prerequisites for managing the various monitors:
- Application Servers
- Database Servers
- Cloud Apps
- ERP
- Servers
- Services
- Mail Servers
- Java / Transactions
- Middleware / Portal
- Virtualization
- Web Server / Services
- APM Insight
- Converged Infrastructure
- Custom Monitors
Note:IPv6 support is available for all monitors.
Application Servers
Glassfish
While monitoring Glassfish application servers, make the following changes in the domain.xml file and then restart it:
- Change the "accept-all" property to "true" for the "jmx-connector" node : <jmx-connector accept-all="true"
The configuration line should look like this:
<jmx-connector accept-all="true" address="0.0.0.0" auth-realm-name="admin-realm" enabled="true" name="system" port="8686" protocol="rmi_jrmp" security-enabled="false"/>
JBoss
The prerequisites for managing the various versions of JBoss server are:
- JBoss Version 3.x and 4.x
- JBoss Version 5.x
- JBoss Version 6.x
- JBoss Version 7.x and above (EAP version 6 and above)
- JBoss Wildfly (WildFly 8 and above)
To monitor JBoss, the http-invoker.sar should be deployed in the JBoss Server. The application (http-invoker.sar) is by default deployed in the JBoss server.
If the http port of the JBoss server is changed then the port number in the attribute InvokerURLSuffix should also be modified in <JBOSS_HOME>/server/default/deploy/http-invoker.sar/META-INF/jboss-service.xml file.
To monitor JBoss 5.x version, jbossagent.sar should be deployed in JBoss server. To deploy, follow the steps below:
- Copy jbossagent.sar from location <Applications Manager home>/working/resources and paste under <JBOSS_HOME>/server/default/deploy
- If you are running JBoss in different domain like all, then deployment target folder would be <JBOSS_HOME>/server/all/deploy.
Note: JBOSS 6 EAP should be added as JBoss 7
To monitor JBoss 6.x version, jbossagent.sar should be deployed in JBoss server. To deploy, follow the steps below:
- Copy jbossagent.sar from location <Applications Manager home>/working/resources and paste under <JBOSS_HOME>/server/default/deploy
- If you are running JBoss in different domain like all, then deployment target folder would be <JBOSS_HOME>/server/all/deploy.
- Provide the rmiRegistryPort which is available in <JBOSS_HOME>/server/<domainname>/conf/bindingservice.beans/META-INF/bindings-jboss-beans.xml file. The default port is 1090.
Example:
<bean class="org.jboss.services.binding.ServiceBindingMetadata">
<property name="serviceName">
jboss.remoting:service=JMXConnectorServer,protocol=rmi
</property>
<property name="port">1090</property>
<property name="description">RMI/JRMP socket for connecting to the JMX MBeanServer</property>
</bean>
JBoss Version 7.x and above (EAP version 6 and above)
Standalone Mode:
- In the JBoss config file (i.e. <JBOSS_HOME>\standalone\configuration\standalone-full.xml), change jboss.bind.address.management:127.0.0.1 to jboss.bind.address.management:0.0.0.0
EAP Setup:
- In the JBoss config file (i.e. <JBOSS_HOME>\domain\configuration\host.xml), change jboss.bind.address.management:127.0.0.1 to jboss.bind.address.management:0.0.0.0
- Change the Management port binding to use the network accessible interface:
- In the JBoss config file (i.e. <JBOSS_HOME>\standalone\configuration\standalone-full.xml), change the entry jboss.bind.address.management:127.0.0.1 to jboss.bind.address.management:0.0.0.0
- Restart the service
- Add a JBoss administration user for monitoring by navigating to <JBOSS_HOME>\bindirectory and executing the following command in command prompt:
- Windows:add-user.bat <USERID> <PASSWORD> ManagementRealm -silent
- Linux:./add-user.sh <USERID> <PASSWORD> ManagementRealm -silent
Oracle Application Server
Applications Manager uses the Dynamic Monitoring Service (DMS) provided by Oracle Application Server to monitor the same. For this reason, the DMS Servlet has to be made accessible to the system where the Applications Manager is running.
To enable the access, please follow the instructions provided below
[The instructions are referred from the Oracle website: http://docs.oracle.com/cd/B14099_19/core.1012/b14001/monitor.htm]
By default, the dms0/AggreSpy URL is redirected and the redirect location is protected, allowing only the localhost (127.0.0.1) to access the AggreSpy Servlet.
To view metrics from a system other than the localhost you need to change the DMS configuration for the system that is running the Oracle Application Server that you want to monitor by modifying the file $ORACLE_HOME/Apache/Apache/conf/dms.conf on UNIX, or%ORACLE_HOME%\Apache\Apache\conf\dms.conf on Windows systems.
The following example shows a sample default configuration from dms.conf. This configuration limits AggreSpy to access metrics on the localhost (127.0.0.1). The port shown, 7200, may differ on your installation.
Example: Sample dms.conf File for localhost Access for DMS Metrics
# proxy to DMS AggreSpy
Redirect /dms0/AggreSpy http://localhost:7200/dmsoc4j/AggreSpy
#DMS VirtualHost for access and logging control
Listen 127.0.0.1:7200
OpmnHostPort http://localhost:7200
<VirtualHost 127.0.0.1:7200>
ServerName 127.0.0.1
By changing the dms.conf configuration to specify the host that provides, or serves DMS metrics, you can allow users on systems other than the localhost to access the DMS metrics from the location http://host:port/dms0/AggreSpy.
Caution: Modifying dms.conf has security implications. Only modify this file if you understand the security implications for your site. By exposing metrics to systems other than the localhost, you allow other sites to potentially view critical Oracle Application Server internal status and runtime information.
To view metrics from a system other than the localhost (127.0.0.1), do the following:
- Modify dms.conf by changing the entries with the value for localhost "127.0.0.1" shown in Example to the name of the server providing the metrics (obtain the server name from the ServerName directive in the httpd.conf file, for example tv.us.oracle.com).
Find below a sample updated dms.conf that allows access from a system other than the localhost (127.0.0.1)
Example: Sample dms.conf File for Remote Host Access for DMS Metrics:
# proxy to DMS AggreSpy
Redirect /dms0/AggreSpy http://tv.us.oracle.com:7200/dmsoc4j/AggreSpy
#DMS VirtualHost for access and logging control
Listen tv.us.oracle.com:7200
OpmnHostPort http://tv.us.oracle.com:7200
<VirtualHost tv.us.oracle.com:7200>
ServerName tv.us.oracle.comRestart, or stop and start the Oracle HTTP Server using Application Server Control Console or using the Oracle Process Manager and Notification Server opmnctl command.
For example,
%opmnctl restartproc process-type=HTTP_Server
or
%opmnctl stopproc process-type=HTTP_Server
%opmnctl startproc process-type=HTTP_Server
After performing the above steps, please ensure that you are able to access the URL http://<host>:7200/dmsoc4j/AggreSpy from the Applications Manager system.
To check if a user has select privilege:
We suggest you to execute the below query directly in your Oracle machine and check if a connected user has select privilege or not :
select TABLE_NAME,PRIVILEGE from user_tab_privs_recd where table_name in ('ALL_SCHEDULER_JOB_RUN_DETAILS','V_$RMAN_BACKUP_JOB_DETAILS','ALL_SCHEDULER_JOBS','ALL_SCHEDULER_RUNNING_JOBS');
If there is no row selected or privilege column does not have select value for the above table_name columns, then the user doesn't have privilege to access the table.
To grant Privilege:
Use the following query:
grant select on <tablename> to <username>;
Example:grant select on V_$RMAN_BACKUP_JOB_DETAILS to monitoruser;
Note: As above, you have to give grant permission on all the tables mentioned in the above query.
Tomcat Server
Browse through the following links to monitor Tomcat server for respective versions:
Tomcat versions 7.x and above
To monitor Tomcat 7.x and above, an application named Manager must be running in it for Applications Manager to monitor the Tomcat server. By default, this application will be running in the server. If you have customized the Manager application (Eg. \qamanager), then you can use the option "Tomcat Manager Application URI" in the client, for Applications Manager to monitor the Tomcat server.
- The user role manager-jmx is required to access the server.
- To add a role as manager-jmx to any of the users such as tomcat, role1, or both, you need make changes in tomcat-users.xml file located under the <TOMCAT-HOME>/conf directory.
- The manager-gui role grants a user the ability to access and use the web-based graphical user interface (GUI) for the Tomcat Manager application. It is essential for managing web applications and monitoring the Tomcat server through the Manager's GUI.
To allow requests from specific client addresses in the Tomcat server, add the IP address of the host machine where Applications Manager is installed to the allow attribute in the context.xml file. This file is located in the CATALINA_HOME/webapps/manager/META-INF/ directory. By default, the Tomcat server allows requests from all client addresses.
Default:
<Valve className="org.apache.catalina.valves.RemoteAddrValve" allow=".*" />To allow a specific client address:
<Valve className="org.apache.catalina.valves.RemoteAddrValve" allow="192\.168\.1\.100" />To allow multiple client addresses:
<Valve className="org.apache.catalina.valves.RemoteAddrValve" allow="192\.168\.1\.100|192\.168\.1\.101|10\.0\.0\.1" />To allow multiple client addresses and deny specific client addresses:
<Valve className="org.apache.catalina.valves.RemoteAddrValve" deny="192\.168\.1\.100" />
Example:
Default configurations in tomcat-users.xml in Tomcat Server:
<tomcat-users><role rolename="tomcat" /><role rolename="role1" /><user username="tomcat" password="tomcat" roles="tomcat" /><user username="role1" password="tomcat" roles="role1" /><user username="both" password="tomcat" roles="tomcat,role1" /></tomcat-users>
After adding the roles for the "tomcat" user, the modified entries will be as follows:
<tomcat-users> <role rolename="tomcat" /><role rolename="role1" /><role rolename="manager" /><user username="tomcat" password="tomcat" roles="tomcat,manager-gui,manager-jmx" /> <user username="role1" password="tomcat" roles="role1" /> <user username="both" password="tomcat" roles="tomcat,role1" /> </tomcat-users>
On making the configuration changes, restart the Tomcat server.
Now, while adding a new Tomcat monitor, specify both the username and password as tomcat when discovering the Tomcat server.
<Valve className="org.apache.catalina.valves.RemoteAddrValve"allow=".*" />
Note:
1) After adding the Manager role in tomcat-users.xml, you should be able to access the endpoints <Host>:<PORT>/manager/status and <Host>:<PORT>/manager/jmxproxy from the Applications Manager installed machine (Provide manager user credentials).
2) If the application is not accessible, add the following entry in server.xml, under 'Engine' context:
<Realm className="org.apache.catalina.realm.MemoryRealm" />
3) Restart the server and try to access manager application.
4) By default, GZip compression is disabled for Tomcat. To learn how to enable GZip in Tomcat, refer here.
Tomcat versions 5.x and 6.x
To monitor Tomcat 5.x and 6.x, an application named Manager must be running in it for Applications Manager to monitor the Tomcat server. By default, this application will be running in the server. If you have customized the Manager application (Eg. \qamanager), then you can use the option "Tomcat Manager Application URI" in the client, for Applications Manager to monitor the Tomcat server.
To monitor Tomcat server,
- The user role manager is required to access the server.
- To add a role as manager to any of the users such as tomcat, role1, or both, you need make changes in tomcat-users.xml file located under <TOMCAT-HOME>/conf directory.
Example:
Default configurations in tomcat-users.xml in Tomcat Server:
<tomcat-users><role rolename="tomcat" /><role rolename="role1" /><user username="tomcat" password="tomcat" roles="tomcat" /><user username="role1" password="tomcat" roles="role1" /><user username="both" password="tomcat" roles="tomcat,role1" /></tomcat-users>
After adding the roles for the "tomcat" user, the modified entries will be as follows:
<tomcat-users> <role rolename="tomcat" /><role rolename="role1" /><role rolename="manager" /><user username="tomcat" password="tomcat" roles="tomcat,manager" /> <user username="role1" password="tomcat" roles="role1" /> <user username="both" password="tomcat" roles="tomcat,role1" /> </tomcat-users>
On making the configuration changes, restart the Tomcat server.
Now, while adding a new Tomcat monitor, specify both the username and password as tomcat when discovering the Tomcat server.
Note:
1) After adding the Manager role in tomcat-users.xml, you should be able to access the endpoints <Host>:<PORT>/manager/status and <Host>:<PORT>/manager/jmxproxy from the Applications Manager installed machine (Provide manager user credentials).
2) If the application is not accessible, add the following entry in server.xml, under 'Engine' context:
<Realm className="org.apache.catalina.realm.MemoryRealm" />
3) Restart the server and try to access manager application.
4) By default, GZip compression is disabled for Tomcat. To learn how to enable GZip in Tomcat, refer here.
Tomcat versions 3.x and 4.x
Applications Manager agent has to be deployed in Tomcat Servers 3.x and 4.x to monitor them. Moreover, Tomcat 3.x and 4.x needs no user name and password.
To deploy the agent for Tomcat Server 3.x
- Download the Tomcat3Agent.Zip from <Applications Manager Home>/working/classes directory.
- Unzip it in the <Tomcat Home> directory of the host in which the Tomcat server is running.
- Restart the Tomcat Server.
To deploy the agent for Tomcat Server 4.x
- Download the Tomcat4Agent.Zip from the <Applications Manager Home>/working/classes directory
- Unzip it in the <Tomcat Home> directory of the host in which the Tomcat server is running.
- Add the following tag in server.xml file located in the <Tomcat Home>/conf directory (below the Engine tag).
<Valve className="com.adventnet.appmanager.tomcatagent.ver4.valve.AdventNetHostValve"/>
[Click the link to view an example server.xml] - Restart the Tomcat Server.
To deploy the agent for Tomcat Server 4.x and Apache server combined
- Download the Tomcat4Agent.Zip from the <Applications Manager Home>/working/classes directory
- Unzip it in the <Tomcat Home> directory of the host in which the Tomcat server is running.
- Add the following tag in server.xml file located in the <Tomcat Home>/conf directory (below the Engine tag).
<Valve className="com.adventnet.appmanager.tomcatagent.ver4.valve.AdventNetHostValve"/>
[Click the link to view an example server.xml] - Restart the Tomcat Server.
- Apache:In Apache mod_jk.conf file of Apache Server , add the following entry
- JkMount /adventnet/* ajp13, Where ajp13 is the worker name .It has be the name given in worker.properties file.
- Restart Apache server
TongWeb Server
TongWeb data collection is performed using JMX mode. To enable this, ensure that JMX is activated on the TongWeb Server. Include the following JVM arguments in the TongWeb Server startup configuration and restart the server to apply the changes:
-Dcom.sun.management.jmxremote-Dcom.sun.management.jmxremote.port=1099-Dcom.sun.management.jmxremote.ssl=false-Dcom.sun.management.jmxremote.authenticate=false
WebLogic Server
- For monitoring your WebLogic server, the user must have 'Administrator' privileges. For more information, refer here.
- Webserver port of Applications Manager-installed machine should be accessible from Weblogic server and the HTTP Port of Weblogic server should be accessible from Applications Manager-installed machine.
- If listen address is configured in WebLogic server, the same should be provided while adding the monitor.
- The hostname of WebLogic machine should be resolvable from Applications Manager-installed machine. Add the host details in hosts file of Applications Manager-installed machine.
Click on the following topics to know more about the prerequisites for various versions of WebLogic server.
- To monitor WebLogic 6.1
- To monitor WebLogic 7.x
- To monitor WebLogic 8.x
- To monitor WebLogic 9.x
- To monitor WebLogic 10.x, 11g
- To monitor WebLogic 12.x and above
- For SSL support over WebLogic
To monitor WebLogic 6.1:
Follow the steps given below:
- Provide only Admin user name.
- In the remote WebLogic server, navigate to <Weblogic Home>/weblogic61/server/lib directory. From there, copy Weblogic.jar to <Applications Manager Home>\working\classes\weblogic\version6 directory in the machine where Applications Manager is running.
To monitor WebLogic 7.x:
You should set the weblogic.disableMBeanAuthorization and weblogic.management.anonymousAdminLookupEnabled variables to true for enabling data collection. Follow the steps given below:
- Edit startWLS.cmdsh present in the <WLS_HOME>/server/bin directory and add the following arguments
-Dweblogic.disableMBeanAuthorization=true-Dweblogic.management.anonymousAdminLookupEnabled=trueClick here for Sample startWLS.cmd/sh - Restart the WebLogic Server for the changes to take effect
- In the remote WebLogic server, navigate to <Weblogic Home>/weblogic70/server/lib directory. From there, copy Weblogic.jar to <Applications Manager Home>\working\classes\weblogic\version7 directory in the machine where Applications Manager is running.
To monitor WebLogic 8.x:
You should set the weblogic.disableMBeanAuthorization and weblogic.management.anonymousAdminLookupEnabled variables to true for enabling data collection. Follow the steps given below:
- Edit startWLS.cmdsh present in the <WLS_HOME>/server/bin directory and add the following arguments
-Dweblogic.disableMBeanAuthorization=true-Dweblogic.management.anonymousAdminLookupEnabled=trueClick here for Sample startWLS.cmd/sh - Restart the WebLogic Server for the changes to take effect
- In the remote WebLogic server, navigate to <Weblogic Home>/weblogic81/server/lib directory. From there, copy Weblogic.jar to <Applications Manager Home>\working\classes\weblogic\version8 directory in the machine where Applications Manager is running.
To monitor WebLogic 9.x:
In the remote WebLogic server, navigate to <Weblogic Home>/weblogic92/server/lib directory. From there, copy Weblogic.jar to <Applications Manager Home>\working\classes\weblogic\version9 directory in the machine where Applications Manager is running.
To monitor WebLogic 10.x , 11g:
- From Version 178400, to onboard Oracle WebLogic Server Version 10, we need to update the Version 12 JAR files (wlclient.jar and wljmxclient.jar) in the folder <AppManager Home>\working\classes\weblogic\version12, and if required, the WebLogic Version 12 JAR files can be downloaded from the source.
- Till version 178300, in the remote WebLogic server, navigate to <Weblogic Home>/wlserver/server/lib directory. From there, copy Weblogic.jar, wlclient.jar, wljmsclient.jar, wlthint3client.jar to <Applications Manager Home>\working\classes\weblogic\version10 directory in the machine where Applications Manager is running.
To monitor WebLogic 12.x and above:
In the remote WebLogic server, navigate to <Weblogic Home>/wlserver/server/lib directory. From there, copy wlclient.jar and wljmxclient.jar to <AppManager Home>\working\classes\weblogic\version12 directory in the machine where Applications Manager is running.
Note:
- <Weblogic Home> refers to the WebLogic installation directory.
- After replacing the jar files, Applications Manager has to be restarted.
For SSL support over WebLogic:
WebLogic certificate has to be imported to <Applications Manager Home>/working/jre/lib/security/cacerts file. This certificate can be imported through <Applications Manager Home>/bin/WeblogicCertificate.bat/sh files.
Syntax:
WeblogicCertificate.bat [import] [Full path of weblogic server certificate] [alias name]
Example:
C:\Program Files\ManageEngine\AppManager\bin> WeblogicCertificate.bat import "C:\Oracle\Middleware\Oracle_Home\user_projects\domains\MyDomain\root.cer" mykey
Note:
* If customer is monitoring all three versions of weblogic (10.x, 11g, 12C), then get the jars from latest version of WebLogic (Version 12c).
* SSL option is enabled in the UI only for version 9 and above.
The ports that need to be opened when the Weblogic Monitor is behind the firewall: Two-way communication between WebLogic listening port (default : 7001) and Applications Manager web server port (default : 9090).
Sample commands for WebLogic 7.x, 8.x:
"%JAVA_HOME%\bin\java" %JAVA_VM% %MEM_ARGS% %JAVA_OPTIONS% -classpath "%CLASSPATH%" -Dweblogic.Name=%SERVER_NAME% -Dbea.home="C:\WebLogic\WL7.0" -Dweblogic.disableMBeanAuthorization=true -Dweblogic.management.anonymousAdminLookupEnabled=true -Dweblogic.management.username=%WLS_USER% -Dweblogic.management.password=%WLS_PW% -Dweblogic.management.server=%ADMIN_URL% -Dweblogic.ProductionModeEnabled=%STARTMODE% -Djava.security.policy="%WL_HOME%\server\lib\weblogic.policy" weblogic.Servergoto finish:runAdmin@echo on"%JAVA_HOME%\bin\java" %JAVA_VM% %MEM_ARGS% %JAVA_OPTIONS% -classpath "%CLASSPATH%" -Dweblogic.Name=%SERVER_NAME% -Dbea.home="C:\WebLogic\WL7.0" -Dweblogic.disableMBeanAuthorization=true -Dweblogic.management.anonymousAdminLookupEnabled=true -Dweblogic.management.username=%WLS_USER% -Dweblogic.management.password=%WLS_PW% -Dweblogic.ProductionModeEnabled=%STARTMODE% -Djava.security.policy="%WL_HOME%\server\lib\weblogic.policy" weblogic.Server
WebSphere Application Server
Prerequisites for WebSphere Versions 8.x and below
For base deployment:
You have to modify the Performance Monitor Interface (PMI) Specification Level from "None" to "Standard". Then deploy the perfServletApp.ear file, which uses the PMI infrastructure to retrieve the performance information from WebSphere Application Server, in the WebSphere. Restart WebSphere Application Server.
For Network deployment:
You have to modify the PMI Specification Level from "None"to "Standard" in all the WebSphere Servers in Network Deployment. Then deploy theperfServletApp.ear file, which uses the PMI infrastructure to retrieve the performance information from WebSphere Application Server, in any one of the WebSphere Servers in the Network Deployment. Restart WebSphere Application Server.
Note: Steps to check whether WebSphere monitor has been correctly set
To modify PMI specification level:
- Connect to the Admin console - http://<Host>:<Port>/admin/
- On the left-side tree, expand the Servers node.
- Click on Application Servers link. This will display the list of servers running in the node.
- Click on the server for which data collection has to be enabled.
- In the Additional Properties table, click on Performance Monitoring Service.
- Change the Initial specification level to "Standard" and then apply the changes. Also enable (select) Startup.
To deploy perfServletApp.ear:
- Open the Admin console
- Go to Applications then Application Types, then WebSphere Enterprise Applications.
- Click Install and select local system.
- Browse the perf servlet application then click ok.
- The Default Path is <WAS_INSTALLED_PATH>/<APP_SERVER_NAME>/installableApps/PerfServletApp.ear
- Accept all default options and select Next until finish then click Save.
- After successfully installed this application, restart the node server once in order to work the perf servlet work correctly.
Make sure that a WebSphere Admin User is added to the monitor group of the perfservletApp, if global security is enabled in Websphere. To do so, go to WebSphere Admin console → Applications → Installed Applications → Choose perfservletapp → Security role to user group mapping → Choose Monitor Role → Associate the admin user → Save directly to the master configuration.
To check the perf servlet output, open the following url from your browser:
http://localhost:<PORT>/wasPerfTool/servlet/perfservlet?connector=SOAP&port=8880 <PORT> - 9080 (Default)
Steps to Check whether Websphere monitor has been correctly set
For Base Deployment:
To ensure whether the PMI & perfServletApp are configured properly in WebSphere, invoke the below URL & check whether the data is returned in XML format.
http://<Host>:<Port>/wasPerfTool/servlet/perfservlet?connector=SOAP&port=<SOAP-PORT>
where
- Host - Host in which WebSphere Application Server is running
- Port - HTTP Transport port of the WebSphere Application server [How to locate HTTP Port]
- SOAP Port - SOAP Port of WebSphere [How to locate SOAP Port]
For Network Deployment:
To ensure whether the PMI & perfServletApp are configured properly in WebSphere, invoke the below URL & check whether the data is returned in XML format.
http://<Host>:<Port>/wasPerfTool/servlet/perfservlet?connector=SOAP&port=<NetworkDeployerSOAP-PORT>&HOST=<NetworkDeployerHost>
where
- Host - The host of the websphere application server in which the perf servlet application is installed
- Port - HTTP Transport port of the Websphere server in which the perf servlet application is installed [How to locate HTTP Port]
- NetworkDeployer SOAP PORT - The SOAP port of the Deployment manager (DMGR) [How to locate SOAP Port]
- Network Deployer Host - The host in which the Deployment manager is running.
Note: Also check whether WebSphere admin user is added to the monitor group of the perfservletApp.
How to locate SOAP Port?
1. Login to Admin console
2. Expand the server link on left side tree. Click on Application Servers
3. In Base mode, various WebSpheres will be listed down. Click on the WebSphere's name- > Under Additional Properties, click on End Points link -> click on SOAP connector address. You can get the SOAP port from there.
4. In Network Deployment mode, Click DMGR - > Under Additional Properties, click on End Points link -> click on SOAP connector address - You can get the SOAP port from there.
How to find the HTTP Transport port?
1. Login to Admin console
2. Expand the Server link on left side tree, Click on Application Servers
3. Various WebSpheres will be listed down. Click on the WebSphere's name- > Under Additional Properties, click on Web Containerlink -> click on HTTP Transports link. You can get the HTTP port from there.
Prerequisites for WebSphere Versions 9.x:
For Base mode:
- Enable Performance Monitoring Infrastructure (PMI) in the application servers you want to monitor.
- Go to Websphere Console, then Servers and All servers.
- Click on the server name, then "Performance Monitoring Infrastructure (PMI)" under "Performance" tab.
- Check the box "Enable Performance Monitoring Infrastructure".
- Click Apply, Save and Restart the server.
- If global security is enabled, provide username and password of user with adminitrative role.
For Network deployment mode:
- Enable Performance Monitoring Infrastructure (PMI) in the application servers and node agents you want to monitor.
- To enable PMI in an application server inside a Network deployment:
- Go to Websphere Console, then Servers and All servers.
- Click on the server name, then "Performance Monitoring Infrastructure (PMI)" under "Performance" tab.
- Check the box "Enable Performance Monitoring Infrastructure".
- To enable PMI in a node agent
- Go to the Websphere Console, System Administration then Node agents.
- Click on the node agent, then "Performance Monitoring Infrastructure (PMI)".
- Check the box "Enable Performance Monitoring Infrastructure".
- Click Apply, Save and Restart the server.
- If global security is enabled, provide username and password of user with adminitrative role.
To enable Global security:
- Go to the Websphere Console, go to Security then Global Security.
- Under "Administrative security", check "Enable administrative security".
- Click Apply, Save and Restart the server.
- SSL certificates has to be added to APM incase SSL is enabled or Global security is enabled.
Resin Server
JMX MBeans are used to monitor Resin Application server's activity. To enable JMX, open Resin.XML and add the below JVM arguments or start Resin.exe with the below JVM arguments
-Dcom.sun.management.jmxremote.port=1099 -Dcom.sun.management.jmxremote.ssl=false
-Dcom.sun.management.jmxremote.authenticate=false
Replace 1099 with the actual port number of the JMX agent
Jetty Server
JMX MBeans are used to monitor Jetty server's performance. To enable JMX,
- Add the below JVM arguments on Jetty start up:
-Dcom.sun.management.jmxremote.port=9999
-Dcom.sun.management.jmxremote.ssl=false
-Dcom.sun.management.jmxremote.authenticate=false
-Dcom.sun.management.jmxremote- Replace 9999 with the actual port number of the JMX agent
- Add the following line in start.ini file --module=jmx
Apache Geronimo
To monitor Apache Geronimo Server, add the following java runtime options to the startup file of your application:
-Dcom.sun.management.jmxremote-Dcom.sun.management.jmxremote.port=1999-Dcom.sun.management.jmxremote.ssl=false-Dcom.sun.management.jmxremote.authenticate=false
Replace 1999 with the any free port available.
You can find the startup file here : <Geronimo-Installation-Directory>/bin

Microsoft .NET
To monitor Microsoft .NET Framework, the user must have Administrator privileges. To monitor the Microsoft .NET framework, follow the below given steps:
- Install the latest .NET Framework on your Applications Manager machine.
Install/enable .NET Framework 3.5 on Applications Manager installed machine: (This needs to be done even if you have installed the latest version. To know more click here.)
- To know how to enable .NET 3.5 in Windows Server 2008, click here.
- To know how you can enable .NET 3.5 in other Windows Servers, click here.
Note: The .NET Framework 3.5 prerequisite applies only to Applications Manager versions up to 173100.
- Firewall access for monitoring:Following are the list of ports required for monitoring:
- Windows Management Instrumentation (WMI) (Default : TCP 445)
- Remote Procedure Call (RPC) (Default :TCP 135)
- Target server uses random port above 1024 by default to respond back for remote communication (DCOM) (Default : TCP 1025 to 1030)
Note: If you want to monitor as a non-admin user, follow the steps mentioned in this link.
Database Servers
Cassandra DB
For monitoring Cassandra database server, the given prerequisites should be followed:
- JMX remote access enabled: We are using JMX to monitor Cassandra. So it must have JMX remote access enabled.
- JMX Port: We need JMX port number (and not Cassandra DB port number) for monitoring. The JMX port number will be available in cassandra-env.sh file.
- Firewall restrictions: Make sure any firewalls between Appmanager machine and the Cassandra node allow traffic on the JMX port.
- Authentication mode : If Cassandra is running in authenticated mode, enable the Is Authentication Required option. Ensure that the provided user has read-only permissions and uses the password specified in the jmxremote.password file.
Dameng DB
To perform effective monitoring of DamengDB in Applications Manager, the monitor user must be granted the Data Viewer privilege. Refer here to know more about how to grant this privilege to the newly created user.
IBM DB2
A DB2 user with SYSMON instance level authority is required for monitoring DB2 server.
Long Running Queries (Available from version 9.7 & above):
To monitor 'Long Running Queries', the user must have the following authorization:
- SELECT privilege on the MON_CURRENT_SQL administrative view
Session details (Available from version 9.7 & above):
To monitor 'Session details', the user must have any one of the following authorizations:
- Execute privilege on the routine 'SYSPROC.MON_GET_CONNECTION'
Minimum User Privileges:
- For monitoring IBM DB2 v.8 and v.9, the user should be able to access the SYSPROC procedures.
- For monitoring IBM DB2 v.10 & above, the user should be able to access the SYSIBMADM functions and SYSPROC procedures.
Granting a privilege to user:
Login to DB2 command line processor and execute below statement:
GRANT <authority> ON DATABASE TO USER <user-name>
where, <authority> can be any one of the following: CONNECT, LOAD
To learn how to grant a privilege to a user, refer here.
IBM Informix Server
JDBC Driver:
To monitor IBM Informix DB, make sure that the ifxjdbc.jar file is present in the location:<ProductHome>\working\classes directory. The jar file can be copied from the IBM Informix installation location, <IBM Informix Home>\jdbc\lib\jar. Restart Applications Manager after copying the file.
User Privileges:
To add an Informix DB monitor, a user requires Connect database-level privileges and he should be able to access sysmaster database.
Kingbase Database Server
If Kingbase database is installed in remote server, it should allow connections from Applications Manager installed server. For this follow the steps given below:
- Open kingbase.conf file under <Kingbase Database Home>/data
- Check the value of configuration parameter listen_addresses. If it is using the default value localhost, it must be changed to TCP/IP address(es) on which the Kingbase database has to listen for connections from Applications Manager. You can change it to * (corresponds to all available IP interfaces) like below:
- listen_addresses = '*'
- Open sys_hba.conf file under <Kingbase Database Home>/data.
- Add the following new line to allow all Kingbase user remove connections from Applications Manager server:
- host all all 0.0.0.0/0 md5
- host all all ::0/0 md5
User privileges required: Applications Manager uses Kingbase database's subsystem statistics collector & some built-in views such as pg_class, pg_database, pg_indexes, pg_locks, pg_namespace, pg_proc, pg_replication_slots, sys_stat_statements, pg_tables, pg_trigger, pg_user to monitor Kingbase database server activity. The user provided for monitoring should have at least read-only access to statistics collector and above mentioned views.
For Kingbase version below 10,
- Create a user with the following privileges:
- CREATE USER <user-name> WITH PASSWORD <PASSWORD>'';
- GRANT SELECT ON pg_stat_database TO <user-name>
- To monitor replication metrics, the database user is required to have Replication privilege (if replication is configured) Execute the below query to update the DB user with Replicationprivilege.
- ALTER USER <user-name> WITH Replication;
- To list out configuration-related metrics and WAL file count, the database user is required to have Superuser privilege. Execute the below query to update the DB user with Superuser privilege: (optional)
- ALTER USER <user-name> WITH Superuser;
For Kingbase version above 10,
- To monitor all the metrics, execute the below query:
- CREATE ROLE <user-name> WITH LOGIN NOSUPERUSER NOCREATEDB NOCREATEROLE INHERIT REPLICATION CONNECTION LIMIT -1 PASSWORD 'xxxxxx';
- GRANT pg_monitor TO <user-name>;
- GRANT EXECUTE ON FUNCTION pg_ls_dir(text) TO <user-name>;
Extensions to be enabled in Kingbase Database server:
- To monitor top queries by CPU, include the below lines in kingbase.conffile:
- shared_preload_libraries = 'sys_stat_statements'
- sys_stat_statements.track = all
Microsoft SQL Database Server
For monitoring a Microsoft SQL database server, the SQL user account used for monitoring should have access to MASTER, MSDB and DISTRIBUTION databases. Users should have the following roles:
sysadmin server role : Go to SQL Server Management Studio → Go to Logins → Choose the respective user and open properties → Go to 'Server roles' and select sysadmin role → Save the option and proceed with adding the SQL monitor in Applications Manager.
(OR)
1. Provide VIEW SERVER STATE permission on the server to the respective SQL user. To grant VIEW SERVER STATE, you can use any of the following methods :
(i) Execute the following query:
GRANT VIEW SERVER STATE TO username;
(ii) In SQL Management Studio for user Choose Properties → Securables → Click Add ( under Securables ) → Choose 'All objects of the Types...' → Choose Servers → Choose Grant for 'View server state' permission.
2. To monitor Database metrics, we need to provide either one of the following permissions.
- DB Role required for all databases: public, db_datareader
(or)
- Provide Connect any database permission on the server to the respective SQL user. To grant CONNECT ANY DATABASE, you can use any of the following methods :
- Execute the following query: GRANT CONNECT ANY DATABASE TO username;
- In SQL Management Studio for user Choose Properties → Securables → Click Add (under Securables) → Choose 'All objects of the Types...' → Choose Servers → Choose Grant for 'Connect any database' permission.
3. Provide the following DB roles:
- DB Role required for msdb database: public, db_datareader, SQLAgentReaderRole, SQLAgentOperatorRole, dbm monitor. (For SQL Jobs monitoring/Log Shipping monitoring/Replication monitoring,Database mirroring monitoring.
- DB Role required for distribution database: public, db_datareader (For SQL Replication monitoring).
4. To monitor AlwaysOn Availability Groups in Applications Manager, the admin must provide view any definition permission on the server to the respective SQL user. To do so, you can use any of the following methods:
(i) Execute the following query:
GRANT VIEW ANY DEFINITION TO username;
(ii) In SQL Management Studio, for user, choose Properties → Securables → click Add ( under Securables ) → choose 'All objects of the Types...' → Choose Servers → Choose Grant for 'view any definition' permission.
5. To monitor Cluster details, use the username and password of the Cluster Domain Administrator. The account should have permission to execute WMI queries on the root/mscluster namespace on cluster server nodes. Enable Firewall access for monitoring. The following are the ports required for monitoring:
- Remote Procedure Call (RPC) (Default port: 135)
- The target server uses a random port above 1024 by default to respond to remote communication (DCOM). (Default port: TCP 1025 to 1030)
MongoDB Servers
Supported Versions: MongoDB 4.x, 5.x, 6.x, 7.x, and 8.x. We support mongod and mongos services.
If the MongoDB instance is authenticated, the User should have 'clusterMonitor' role to fetch performance metrics of MongoDB.
The password entered in Applications Manager DOES NOT need to be 'percent encoded' like a typical MongoDB connection string. Refer to know more.
Note: MongoDB versions 3.4 & above are not supported in 32-bit Windows and Linux OS.
MySQL Database Servers
Supported Versions: MySQL version 5.0.15 and above, MariaDB 10.4 and above.
Customers using Applications Manager version 170400 and above have MariaDB Connector/J JDBC Driver for MySQL and MariaDB monitoring by default.
For customers using versions below 170400 or who wish to utilize the MySQL Connector/J JDBC Driver for MySQL monitoring, the following prerequisites apply:
- Download MySQL JDBC Driver: If the mysql_connector.jar file is not present in the <Applications Manager Home>/working/mysql/MMMySQLDriver directory, please download the appropriate JDBC driver:
- For MYSQL version 5.6 and newer
- For MYSQL version older than 5.6
- Install MySQL JDBC Driver:
- Extract the downloaded zip file and locate the mysql-connector-java-5.1.46.jar file or mysql-connector-java-3.0.10-stable-bin.jar
- Rename it to mysql_connector.jar
- Copy the renamed mysql_connector.jar to <Applications Manager Home>/working/mysql/MMMySQLDriver on the machine where Applications Manager is installed.
- Restart Applications Manager after installing the MySQL JDBC Driver.
Note:
- When monitoring multiple MySQL servers with varying versions, use the most recent MySQL JDBC Driver file.
- For MySQL servers implementing 'SSL Configuration' or hosted on cloud platforms, it is recommended to use the latest version of the MySQL JDBC Driver file.
Privileges Required :
To set up a MySQL/MariaDB monitor in Applications Manager successfully, ensure that the following preconditions are met:
- The MySQL server port (usually 3306) is accessible from the Applications Manager server.
- Grant access to the Applications Manager server to connect to the MySQL server. To do this, update the bind-address MySQL client option in the MySQL configuration file (my.ini or my.cnf by default) to allow connections with externally accessible IP addresses, or a wildcard IP address like '0.0.0.0' or '*'.
- The MySQL user designated for monitoring should be able to access the specified database.
- The MySQL monitoring user should be provided with privileges to execute SELECT, SHOW DATABASES, and REPLICATION commands within the MySQL server.
To enable these privileges, execute the following queries in the remote MySQL Server:
Note: Before proceeding with the queries, kindly note the following:
- <user> - Username of the MySQL user
- <host> - Hostname of the Applications Manager server
- <password> - MySQL password as desired
- To create a new user in mysql database, execute the query specific to the respective MySQL version:
MySQL version 8.0 and above:
CREATE USER '<user>'@'<host>' IDENTIFIED BY '<password>';
MySQL version 5.7:
CREATE USER <user>@'%' IDENTIFIED BY '<password>';
MySQL version below 5.7:
INSERT INTO user (Host,User) VALUES('<host>','<user>');
Execute the following to grant the privileges required for a DB-user to monitor a MySQL DB-sever:
- GRANT SELECT,SHOW DATABASES,REPLICATION CLIENT,REPLICATION SLAVE ON *.* TO '<user>'@'<host>';
- FLUSH PRIVILEGES;
For more information, please refer to the MySQL documentation.
Prerequisites for MySQL SSL server monitoring:
Execute the following to enable the tls_option for the user account:
ALTER USER '<user>'@'<host>' REQUIRE <tls_option>;
Note: Possible <tls_option> values include (SSL | X509 | CIPHER 'cipher' | ISSUER 'issuer' | SUBJECT 'subject')
- Add the client certificates and its root certificates in the apm.keystore file under <Applications Manager Home>/working/cert/ directory.
- Add the monitor by enabling 'SSL' option in Add New Monitor page. If the monitor is already added, update the 'SSL' option in Edit Monitor page.
For MariaDB:
To monitor replication and database details, the monitoring user should have privileges to the REPLICATION SLAVE, REPLICATIONCLIENT, SELECT, and SHOWDATABASES commands. Permissions can be granted by executing the following command:
- GRANT SELECT, SHOW DATABASES, REPLICATION SLAVE, REPLICATION CLIENT ON . TO '<user>'@'<host>';
- FLUSH PRIVILEGES;
Note:
- Click here to learn how to import the certificates for monitoring MariaDB with SSL authentication.
- To monitor top queries by CPU and session details in MariaDB, the SYS database must be installed. Refer to this KB for instructions on installing the SYS database.
Neo4j Database Servers
Prerequisites for Neo4j versions 4 and 5:
- For Version 4.4: To show the values for all the metrics add 'metrics.filter=*' in neo4j.conf file.
- For Version 5.x: To show the values for all the metrics add 'server.metrics.filter=*' in neo4j.conf file.
Oracle Database Servers
A user with CONNECT and SELECT_CATALOG_ROLE roles are required for Oracle monitoring in Applications Manager. Configure a user with these permissions and use the credentials in Applications Manager
Prerequisites for monitoring Oracle Alert Log metrics
Login as SYS user and run the following queries:
- Create or replace view v_$appman_alertlog_ext as select * from x$dbgalertext
- Create or replace public synonym v$appman_alertlog_ext for sys.v_$appman_alertlog_ext
- Grant select on v$appman_alertlog_ext to [USERUSEDFORORACLEDBSERVERMONITOR]
Note:
- Oracle DB Alert Log monitoring is supported for version Oracle 11g and above only.
- No prerequisites are required for Oracle versions 12C and above.
Prerequisites for monitoring Oracle Redo Log metrics
Login as SYS user and run the following queries:
- Create or replace view v_$appman_redolog_cp_ext as select * from x$kcccp
- Create or replace public synonym v$appman_redolog_cp_ext for sys.v_$appman_redolog_cp_ext
- Grant select on v$appman_redolog_cp_ext to [USERUSEDFORORACLEDBSERVERMONITOR]
- Create or replace view v_$appman_redolog_le_ext as select * from x$kccle
- Create or replace public synonym v$appman_redolog_le_ext for sys.v_$appman_redolog_le_ext
- Grant select on v$appman_redolog_le_ext to [USERUSEDFORORACLEDBSERVERMONITOR]
- Create or replace view appman_redolog_cp_vw as select * from x$kcccp
- Create or replace public synonym appman_redolog_cp_view for sys.appman_redolog_cp_vw
- Grant select on appman_redolog_cp_view to [USERUSEDFORORACLEDBSERVERMONITOR]
- Create or replace view appman_redolog_le_vw as select * from x$kccle
- Create or replace public synonym appman_redolog_le_view for sys.appman_redolog_le_vw
- Grant select on appman_redolog_le_view to [USERUSEDFORORACLEDBSERVERMONITOR]
Prerequisites for monitoring Oracle Data Guard metrics
- Database Role should be either PRIMARY or PHYSICAL STANDBY or LOGICAL STANDBY.
- For PRIMARY database role, the Log Mode should not be as NOARCHIVELOG.
- The Database Role and Log Mode Status can be found by executing the following query
SELECT database_role,log_mode FROM v$database
Prerequisites for monitoring Oracle Pluggable Database (PDB) metrics
SYS or SYSTEM or Common user with the CONNECT and SELECT_CATALOG_ROLE roles is required to monitor Oracle PDBs. To do so, execute the following commands:
CREATE USER C##APPMON IDENTIFIED BY **PASSWORD** CONTAINER=ALL;
GRANT CONNECT TO C##APPMON CONTAINER=ALL;
GRANT SELECT_CATALOG_ROLE TO C##APPMON CONTAINER=ALL;- If Common user is chosen for monitoring, then the below privilege has to be provided by connecting to the CDB container with SYS user:
alter user set container_data=all container = current;
For example,
alter user C##APM set container_data=all container = current;
The C##APM user has now been given the SELECT role privilege to access all the objects.
Oracle RAC Servers
To monitor Oracle DB in Oracle RAC cluster, a user with CONNECT and SELECT_CATALOG_ROLE roles are required. Configure a user with these permissions and use the credentials in Applications Manager
To monitor Oracle Pluggable Databases (PDBs) in Oracle RAC cluster, SYS or SYSTEM or COMMON user with CONNECT and SELECT_CATALOG_ROLE roles are required. If COMMON user is chosen for monitoring, then the below privilege has to be provided by connecting to the CDB container with SYS user:
For example,
alter user C##APM set container_data=all container = current;
where the user C##APM has now been given the SELECT role privilege to access all the objects.
PostgreSQL
If PostgreSQL is in remote server, it should allow connections from Applications Manager server. For this follow the steps given below:
Allowing remote connection from Applications Manager in PostgreSQL
- Open postgresql.conf file under <PostgreSQL Home>/data
Check value of configuration parameter listen_addresses.If it is using the default value localhost, it must be changed to TCP/IP address(es) on which the PostgreSQL has to listen for connections from Applications Manager. You can change it to *(corresponds to all available IP interfaces) like below:
listen_addresses = '*'
Click here for more details on configuring postgresql.conf file.
- Open pg_hba.conf file under <PostgreSQL Home>/data
Add the following new line to allow all PostgreSQL user remote connections from Applications Manager server:
host all all 0.0.0.0/0 md5
host all all ::0/0 md5Click here for more details on configuring pg_hba.conf file.
User privileges required
Applications Manager uses PostgreSQL's subsystem statistics collector & some built-in views such as pg_class, pg_database, pg_indexes, pg_locks, pg_namespace, pg_proc, pg_replication_slots, pg_stat_statements, pg_tables, pg_trigger, pg_user to monitor PostgreSQL server activity. The user provided for monitoring should have at least read-only access to statistics collector and above mentioned views.
Create a user with following privileges:
CREATE USER <user-name> WITH PASSWORD '<PASSWORD>';
GRANT SELECT ON pg_stat_database TO <user-name>To monitor replication metrics, the database user is required to have Replication privilege (if replication is configured). Execute the below query to update the DB user with Replicationprivilege:
ALTER USER <user-name> WITH Replication;
To list out configuration-related metrics & WAL file count, the database user is required to have Superuser privilege. Execute the below query to update the DB user with Superuserprivilege: (optional)
ALTER USER <user-name> WITH Superuser;
To monitor all the metrics, execute the following query:
- CREATE ROLE <user-name> WITH LOGIN NOSUPERUSER NOCREATEDB NOCREATEROLE INHERIT REPLICATION CONNECTION LIMIT -1 PASSWORD 'xxxxxx';
- GRANT pg_monitor TO <user-name>;
- GRANT EXECUTE ON FUNCTION pg_ls_dir(text) TO <user-name>;
Extensions to be enabled in PostgreSQL server:
To monitor top queries by CPU, include the below lines in postgresql.conf file:
shared_preload_libraries = 'pg_stat_statements'
pg_stat_statements.track = all
Then execute the below query in PostgreSQL:
CREATE EXTENSION pg_stat_statements;
After implementing the above steps, restart the PostgreSQL server.
Note: After implementing the above steps, a restart of the PostgreSQL server is required for the changes to take effect.
Limitations in PostgreSQL Replication monitoring:
- Replication is not monitored for PostgreSQL server version 9.0 & 9.1.
- Master server and slave server should be on different machines.
- More than one slave shouldn't run on same machine.
- Connections to any server (i.e either master or slave) via Unix socket cannot be monitored.
Redis Servers
Supported Versions: Redis version 2.4 to 7.0.
To monitor a Redis server, the user must have permission to execute the INFO and PING commands. These permissions can be granted by executing the following commands:
- ACL SETUSER <username> +info
- ACL SETUSER <username> +ping
SAP ASE / Sybase SQL Server
Supported Versions: Applications Manager supports monitoring of SAP ASE 12.5.3 and above.
To monitor a SAP ASE database monitor, the minimum privileges required by the user are as follows:
- Enable 'SQL batch capture'.
- Increase the 'Max SQL text monitored' value to 1024 or above based on the requirement of server load.
- There are select privileges for a few tables in the master database. They are:
- master.dbo.systransactions
- master.dbo.spt_values
- master.dbo.sysprocesses
- master.dbo.sysdatabases
- master.dbo.syslogins
- master.dbo.monProcessStatement
- master.dbo.monProcessSQLText
- master.dbo.monOpenDatabases
- Users with mon_role, can execute a system procedure named "sp_monitorconfig"
To provide the privileges mentioned above, use the following commands in the SAP ASE database:
- exec sp_role 'grant', 'mon_role', <login-name>; (login-name assigned to the user)
- grant select on master.dbo.systransactions to <user-name>;
- grant select on master.dbo.spt_values to <user-name>;
- grant select on master.dbo.sysprocesses to <user-name>;
- grant select on master.dbo.sysdatabases to <user-name>;
- grant select on master.dbo.syslogins to <user-name>;
- exec sp_configure 'enable monitoring', 1
- exec sp_configure 'statement statistics active', 1
- exec sp_configure 'per object statistics active', 1
- exec sp_configure 'SQL batch capture', 1
- sp_configure 'wait event timing', 1
- sp_configure 'max SQL text monitored', 1024
SAP HANA
- Copy the ngdbc.jar file into the location <Applications Manager Home>/working/classes. ngdbc.jar can be copied from the installed SAP HANA Client folder. Click here to download SAP HANA Client.
- If HANA is running On-demand, in addition to the above, SAP Cloud Platform SDK is needed. However, this is not needed for HANA On-premise. Download SAP Cloud Platform SDK. The downloaded zip should be extracted under <Applications Manager Home>/working/hanacloud folder. After extracting, verify whether <Applications Manager Home>/working/hanacloud/tools folder is available.
- Restart Applications Manager after performing the above steps.
Provide the below privileges for SAP HANA DB User.
- System privilege CATALOG READ.
- Object privilege SELECT on the schema _SYS_STATISTICS.
To grant the above privileges, execute the below statements in the SAP HANA SQL console. (Replace USER_NAME with the actual HANA DB Username)
- GRANT MONITORING to < USER_NAME >
- CALL GRANT_ACTIVATED_ROLE ('sap.hana.admin.roles:Monitoring','< USER_NAME >')
Note:
- New HANA user credentials should be created in SYSTEMDB database.
- To add SAP HANA database, use the SQL port in the Port field. You can view the SQL port by executing the given query for:
- SAP HANA (Tenant DB) :
SELECT SERVICE_NAME, PORT, SQL_PORT, (PORT + 2) HTTP_PORT FROM SYS.M_SERVICES WHERE (SERVICE_NAME='indexserver' and COORDINATOR_TYPE= 'MASTER') - SAP HANA MDC (SYSTEM DB) :
SELECT SERVICE_NAME, PORT, SQL_PORT, (PORT + 2) HTTP_PORT FROM SYS.M_SERVICES WHERE (SERVICE_NAME='nameserver' and COORDINATOR_TYPE= 'MASTER')
- SAP HANA (Tenant DB) :
SAP MaxDB
The following are the prerequisites to be implemented to monitor SAP MaxDB in Applications Manager:
- X-Server should be running.
- sapdbc.jar file should be copied to <Applications Manager Home>\working\classes folder. By default, this jar will be available in SAP MaxDB installation folder under <MaxDB_InstallationPath>\runtime\jar\ directory.
SQL Anywhere
Applications Manager supports the monitoring of SQL Anywhere from version 17. We use system procedures for monitoring the SQL Anywhere server.
To monitor SQL Anywhere server, the DB user must have the following privileges:
- Privilege to manage any DBspace.
- Any one of the following roles: Monitor or Server Operator or Drop connection
To know more about system privileges, click here.
CLOUD APPS
Microsoft Azure
List of ports to be opened for communicating with Microsoft Azure
Microsoft Azure monitor can be added using 3 methods,
AD Application & Service Principal (Recommended)
1. Create Microsoft Entra (Previously Azure Active Directory) Application:
- Log in to Azure Portal (https://portal.azure.com or https://portal.azure.us/ or https://portal.azure.cn/) using the credentials of Microsoft account (@outlook.com or @live.com) using which the subscription was created.
- Go to App registrations → New registration and enter the relevant details and click Register to create a new App registration.
2. Getting Tenant ID, Client ID and Client Secret (Application Key):
- Go to the Microsoft Entra ID application created.
- From the application's overview page,
- Copy the value given as Directory (tenant) ID.
- Copy the value given as Application (client) ID.
- To add a new client secret, go to the Manage tab and navigate to Certificates & Secrets → New client secret. Provide a description and select a duration (preferably 24 months), then click Add. Copy the Client Secret Value from the Value column, ensuring that the Secret ID is not copied. To know more about creating a Client Secret, refer here.
- To monitor the client secret expiry (optional), please follow the below steps:
- Go to API Permissions → Add a permission → Microsoft Graph → Application permissions, choose the permission Application → Application.Read.All and click on Add permission.
- Click on the Grant Admin Consent button.
3. Assign a role to the application:
- Select Subscriptions from the home page.
- Select the particular subscription to assign the application to.
- Copy the Subscription ID value. This is your Subscription ID.
- Select Access control (IAM) from left menu.
- Select Add > Add role assignment to open the Add role assignment page.
- Choose the role of Contributor (Under Role → Privileged administrator roles) or Reader (Under Role → Job function roles) based on your request and then click Next.
- Contributor: Application with this role can oversee all metrics within Azure Monitors and execute VM actions through our product. Additionally, for AKS data collection role binding is required only for 'Azure AD Authentication with Azure RBAC' mode of authentication. Refer to AKS Role Binding Requirement to know more.
- Reader: Application with this role have limitations when it comes to monitoring Diagnostic Agent metrics in Azure VM Monitor and performing VM actions through our product. Also, for AKS data collection role binding is required for all authentication modes. Refer to AKS Role Binding Requirement to know more.
- Select User, group, or service principal in Assign access to option.
- In Members option, click on Select Members and search for the name of your application and select it.
- Select Review + Assign to finish assigning the role.
To know more about assigning a role to the application, refer here.
4. Provide the Tenant ID, Client ID and Application Key (Client Secret) in the Azure new monitor page of Applications Manager.
OAuth mode
Follow the steps 1, 2 and 3 mentioned in AD Application & Service Principal.
4. Grant App Registration Permissions
- Select your created application under Microsoft Entra ID → App Registration.
- In the application's Overview page, click on 'API Permissions' available on the left pane.
- Click on 'Add a Permission' option, select 'Azure Service Management' and choose 'Delegated Permissions'.
- Select the 'user_impersonation' permission and then click on 'Add Permissions'.
- Finally, click on the 'Grant admin consent' button.
Steps to create an OAuth Provider for Azure monitor:
- In Applications Manager, go to Settings → Discovery and Data Collection → Credential Settings → OAuth Provider and select Add OAuth Provider. (Make sure you are logged in from a fully qualified domain name as in the help card)
- Copy the Redirect URL from the Add OAuth Provider window.
- In the Microsoft Azure console, go to Microsoft Entra ID from the left pane, select App Registrations and click on the required application.
- In the application's Overview page, click on the link available under Redirect URIs and paste the Redirect URL copied from the Add OAuth Provider window. Click Save.
- Now copy the App ID, Tenant ID and Client Secret obtained in the above steps and fill in the Add OAuth Provider window.
- For Applications Manager Versions till 16310,user should follow the details as mentioned below:
- Grant Type - Authorization Code
- Authorization Endpoint URL:
- Azure Global account:https://login.microsoftonline.com/<tenantID>/oauth2/authorize
- Azure Gov account:https://login.microsoftonline.us/<tenantID>/oauth2/authorize
- Token Endpoint URL:
- Azure Global account:https://login.microsoftonline.com/<tenantID>/oauth2/token
- Azure Gov account:https://login.microsoftonline.us/<tenantID>/oauth2/token
- Token request method - Post request body
- Request body:
- Name - resource
- Value:
- Azure Global account:https://management.azure.com/
- Azure Gov account:https://management.usgovcloudapi.net/
- Authenticated request method - Basic Authentication
For Applications Manager Versions from 16320, user should follow the details as mentioned below:
Note: Azure China accounts are supported from Applications Manager v173000.
- Grant Type - Authorization Code
- Authorization Endpoint URL:
- Azure Global account:https://login.microsoftonline.com/<tenantID>/oauth2/v2.0/authorize
- Azure Gov account:https://login.microsoftonline.us/<tenantID>/oauth2/v2.0/authorize
- Azure China account:https://login.partner.microsoftonline.cn/<tenantID>/oauth2/v2.0/authorize
- Scope:
- Azure Global account:https://management.azure.com/.default offline_access
- Azure Gov account:https://management.usgovcloudapi.net/.default offline_access
- Azure China account:https://management.chinacloudapi.cn/.default offline_access
- Token Endpoint URL:
- Azure Global account:https://login.microsoftonline.com/<tenantID>/oauth2/v2.0/token
- Azure Gov account:https://login.microsoftonline.us/<tenantID>/oauth2/v2.0/token
- Azure China account:https://login.partner.microsoftonline.cn/<tenantID>/oauth2/v2.0/token
- Token request method - Post request body
- Authenticated request method - Basic Authentication
Note: Remaining fields should remain as default.
- Click Authorize button and authorize using the account to login to Azure.
- Once created, verify whether both Access token and Refresh token are generated.
- Use this OAuth Provider in the Microsoft Azure's New Monitor page.
Azure Organizational Account (PowerShell)
1. Installing the Powershell module on Applications Manager server:
For Applications Manager versions 15170 onwards, you must install the Az Powershell module.
To install the Az Powershell module, follow the below steps:
Open Powershell prompt with Administrator privileges. Run the following commands:
# Install the Az module from the PowerShell Gallery
Install-Module -Name Az -RequiredVersion 6.2.1
To check if the modules are installed successfully:
Open Powershell prompt with Administrator privileges. Run the following command,
Connect-AzAccount
If this opens a pop-up asking for Azure credentials, this means the required modules are installed successfully.
Note:
If you already have the AzureRM Powershell installed, you will have to uninstall it before you install the Az Powershell module using the below command:
Uninstall-AzureRm
- If you face any problems, kindly refer this link.
For Applications Manager versions till 15160, you must install the AzureRM Powershell module.
To install the AzureRM Powershell module, follow the below steps:
Open Powershell prompt with Administrator privileges. Run the following commands:
# Install the Azure Resource Manager modules from the PowerShell Gallery
Install-Module AzureRM
In case if you get the following error upon executing the above command, then install the downloader from http://aka.ms/webpi-azps
To check if the modules are installed successfully:
Open Powershell prompt with Administrator privileges. Run the following command,
Login-AzureRmAccount
If this opens a pop-up asking for Azure credentials, this means the required modules are installed successfully.
2. Get Subscription ID
- Log in to Azure Portal (https://portal.azure.com or https://portal.azure.us/ or https://portal.azure.cn/) using the credentials of Microsoft account (@outlook.com or @live.com) using which the subscription was created.
- On the home page, navigate to All Services → Subscriptions, select the subscription.
- Copy the Subscription ID value. This is your Subscription ID.
3. Create an Organizational account using Microsoft Azure administrator permissions
- Log in to Azure Portal (https://portal.azure.com or https://portal.azure.us/ or https://portal.azure.cn/) using the credentials of Microsoft account (@outlook.com or @live.com) using which the subscription was created. Select Microsoft Entra ID and choose the default directory.
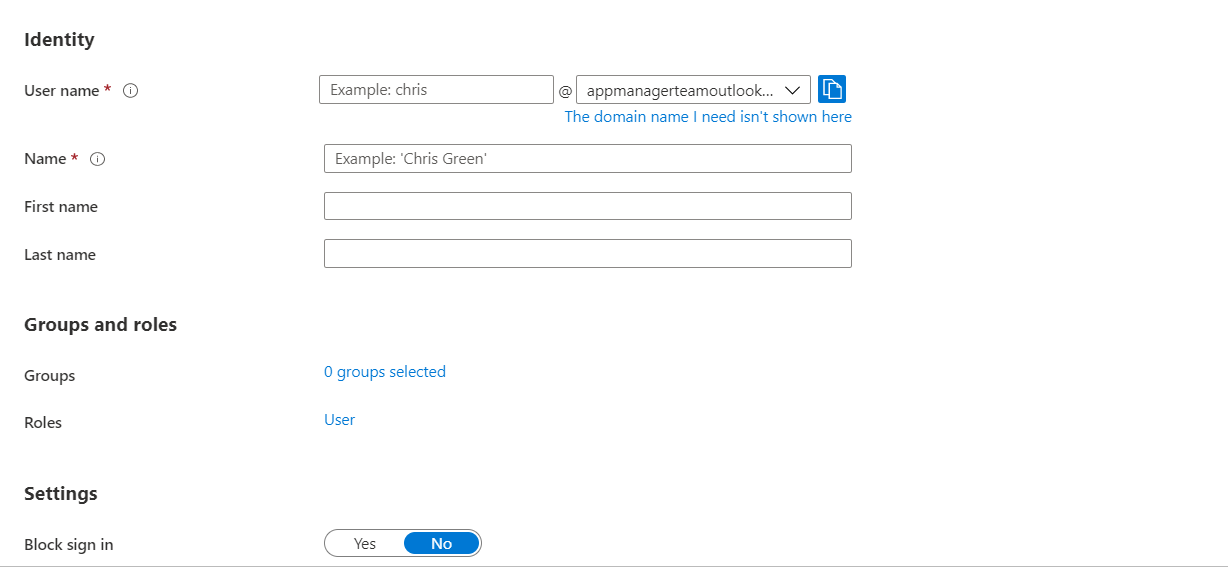
- To create a new user, go to Users → New user, enter the required details (User principal name, Display name, and Password), disable Auto-generate password, and click Review + Create.
- Note down the Email ID and the password of the user that you just created.
4. Assign the Global administrator role to your organizational account
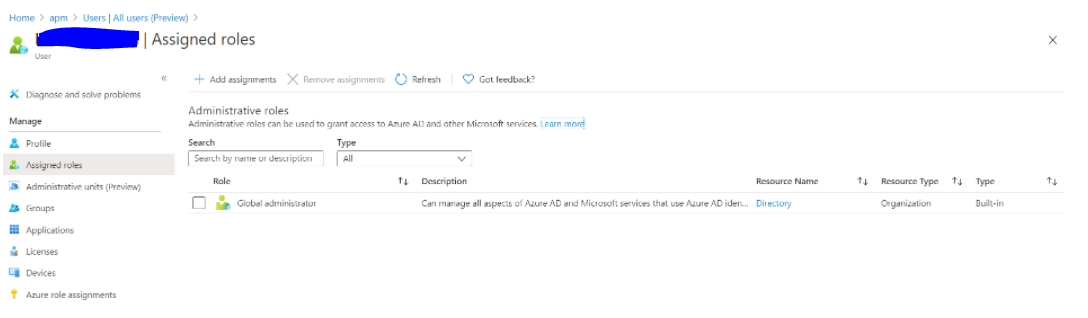
- Log in to Azure Portal (https://portal.azure.com or https://portal.azure.us/ or https://portal.azure.cn/).
- Search for and select Microsoft Entra ID.
- Select Users.
- Select the user for which Global administrator role needs to be assigned.
- On the User Profile page, select Assigned Roles and then click on Add assignment.
- Search for and select the role Global administrator.
- After selecting the role, click on Add button.
The Global administrator role will be assigned to the required user.
After performing all the above steps,
- Sign out of the current account.
- Sign in using the newly created Email address and temporary password
- You will be prompted to change the password, when logging in for the first time
- Change and note down the new password
Provide this Subscription ID, Email ID, and Password to respective fields in the New monitor page while using the mode ‘Azure Organizational Account (PowerShell) of Applications Manager.
Azure Virtual Machines
Users can choose their preferred mode of data collection by performing the following prerequisites:
Note:
- Up to version 171300, Applications Manager relied on Diagnostic Extensions (DE) to fetch metrics. Starting from version 171400, Applications Manager also supports Azure Monitor Agent (AMA) as the default mode to collect Azure agent metrics data for Azure Global Cloud VM monitors.
- The Diagnostic Agent will be selected by default for Azure Government Cloud and Azure China VM monitors as fetching Performance Counters via 'Azure Monitor Metrics' destination using the Azure Monitor Agent is not supported in Microsoft Azure.
Azure Monitor Agent
Follow the steps given below to configure the Azure Monitor Agent in Windows and Linux VMs:
- Steps to enable Azure Monitor Agent in the Azure Portal
- Steps to enable Azure Monitor Agent in Applications Manager
Steps to enable Azure Monitor Agent in the Azure Portal:
- Log in to Azure Portal (https://portal.azure.com).
- Navigate to Data Collection Rules using the search bar and create a new resource under it for agent installation.
- Create a new Data Collection Rule
- In the Basics tab, select the Platform Type as 'Windows', 'Linux', or 'All' based on the respective virtual machine OS type.
- In the Resources tab, click on 'Add Resources' and select the respective virtual machines.
In the Collect and Delivertab, click on 'Add Data Source' and select the data source type as Performance Counters.
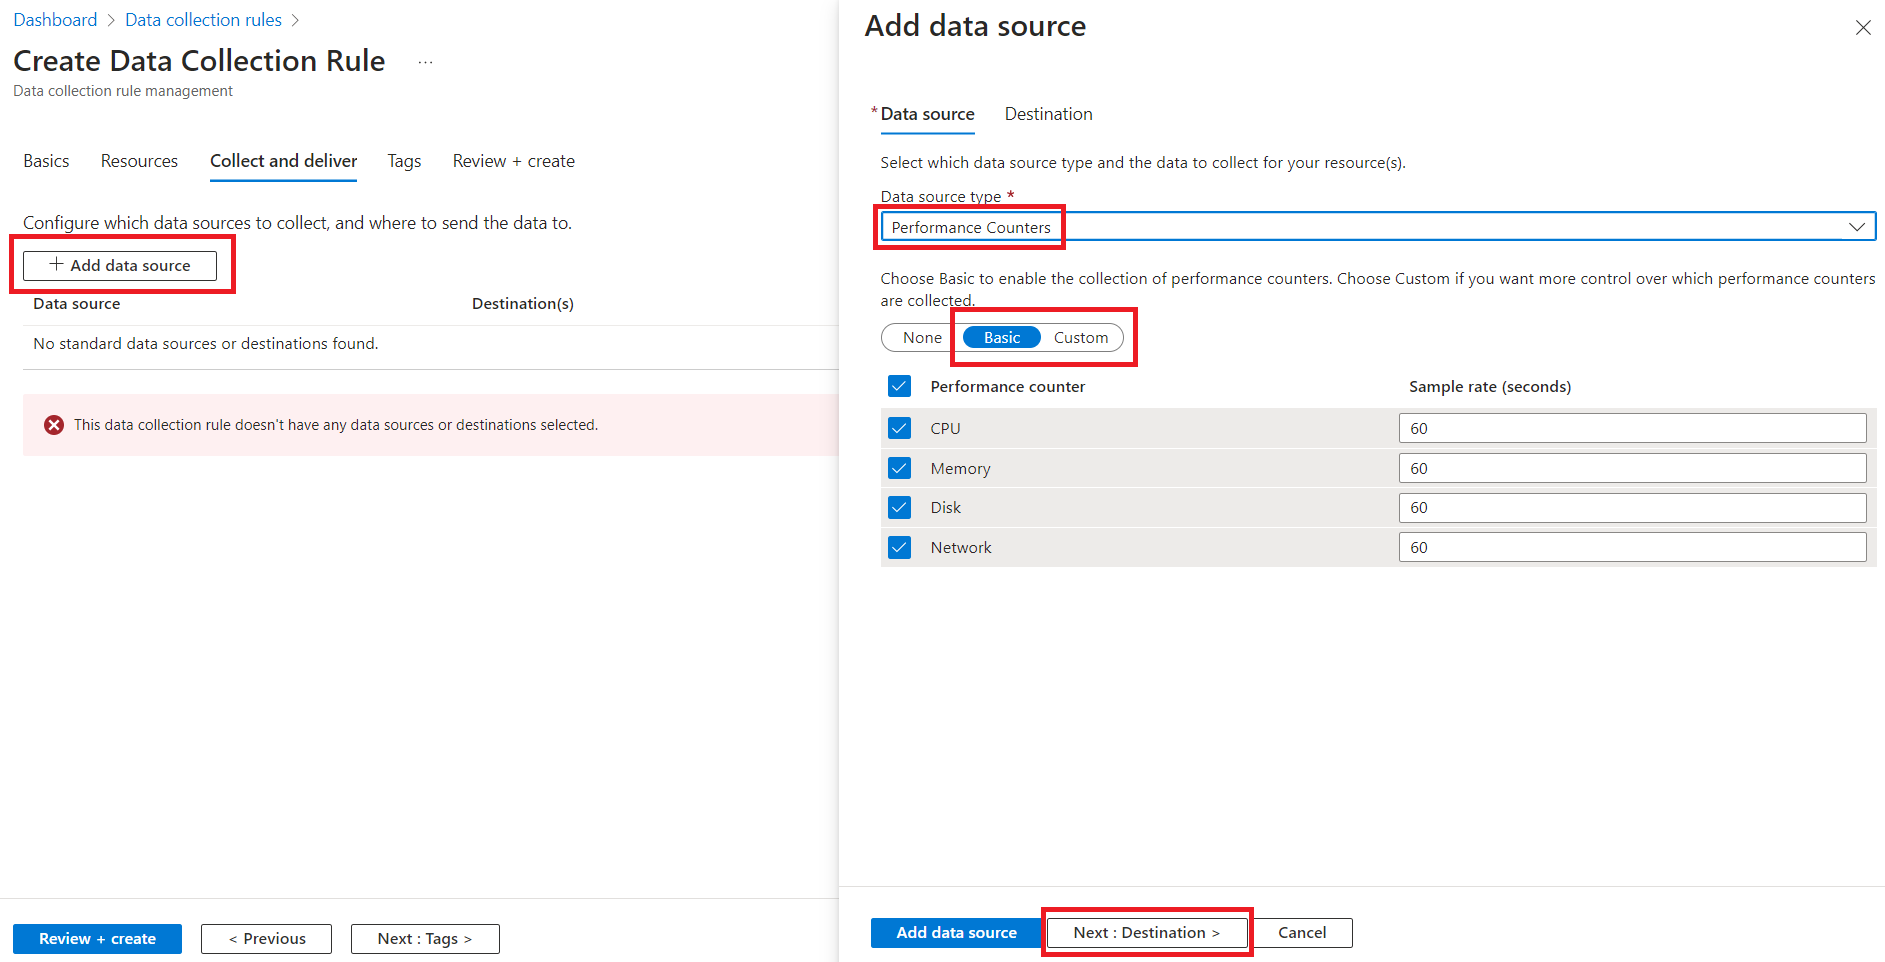
Under Performance Counters, all the listed categories of 'Basic' are chosen by default, and the metrics monitored in Applications Manager are included. If the user wants to enable the agent only for APM monitored metrics, switch to 'Custom' and select the metrics listed in the Windows Metrics Table or Linux Metrics Table below, based on the OS type.
Windows Metrics Table
Metric Name in Azure Portal Metric Name in Applications Manager \Processor Information(_Total)\% Privileged Time Privileged Time \Processor Information(_Total)\% User Time User Time \Processor Information(_Total)\Processor Frequency Processor Frequency \Memory\Committed Bytes Committed Bytes \Memory\Available Bytes Available Bytes \Memory\% Committed Bytes In Use Committed Bytes In Use \Memory\Pool Paged Bytes Pool Paged Bytes \Memory\Pool Nonpaged Bytes Pool Nonpaged Bytes \Memory\Page Faults/sec Page Faults/sec \Process(_Total)\Thread Count Thread Count \System\Context Switches/sec Context switches/sec \System\Processes Process Count \Process(_Total)\Handle Count Handle Count Linux Metrics Table
Metric Name in Data Collection Rule Metric Name in Azure Monitor Metrics Metric Name in Applications Manager Processor(*)\% IO Wait Time cpu/usage_iowait IO Wait Time (%) Processor(*)\% Idle Time cpu/usage_idle Idle Time (%) Processor(*)\% Processor Time cpu/usage_active Processor Time(Linux) (%) Memory(*)\% Used Memory mem/used_percent Memory Utilization Memory(*)\Available MBytes Memory mem/available Available Memory Memory(*)\Used Memory MBytes mem/used Used Memory Memory(*)\% Available Memory mem/available_percent Available Memory % Memory(*)\% Used Swap Space swap/used_percent Used Swap Memory % Note: The Memory Utilization metric for Linux is supported from Applications Manager v171900.
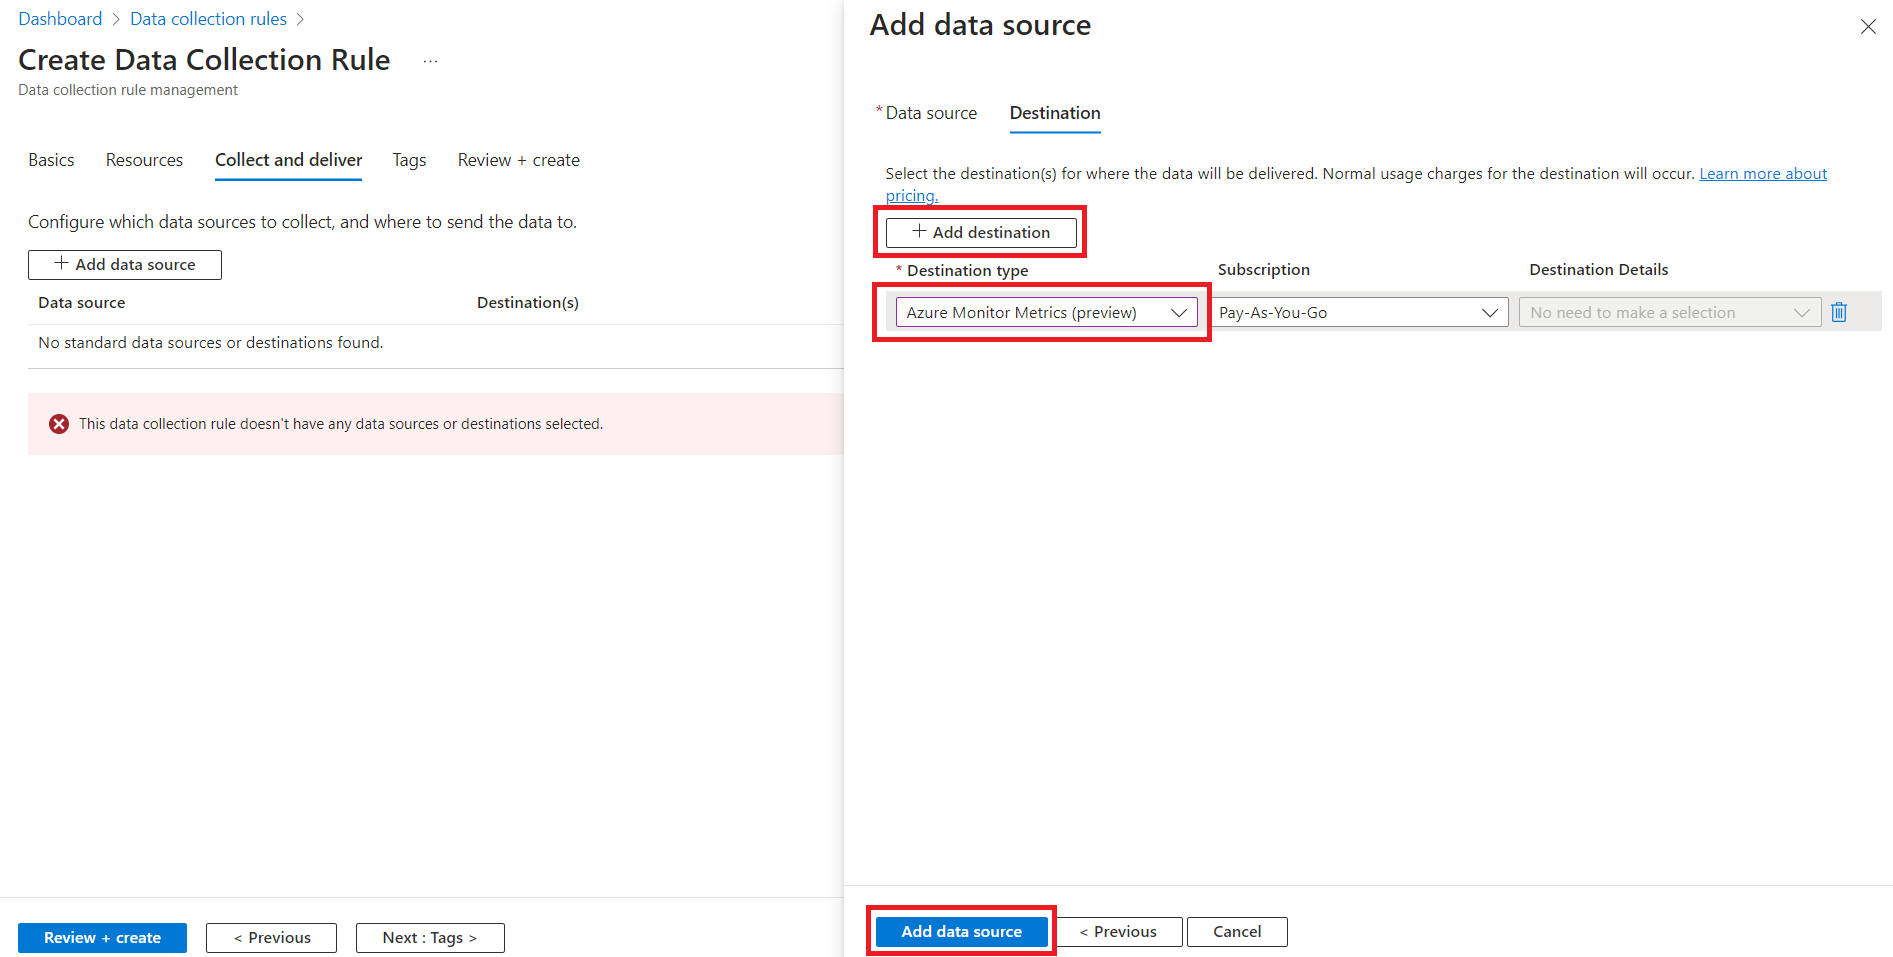
In the Destination tab, click on Add Destination and specify the destination type as Azure Monitor Metrics (preview). Next, click on 'Add Data Source'.
- Proceed to click on Review + create, review the configurations, and then click 'Create' to deploy the resource for agent installation.
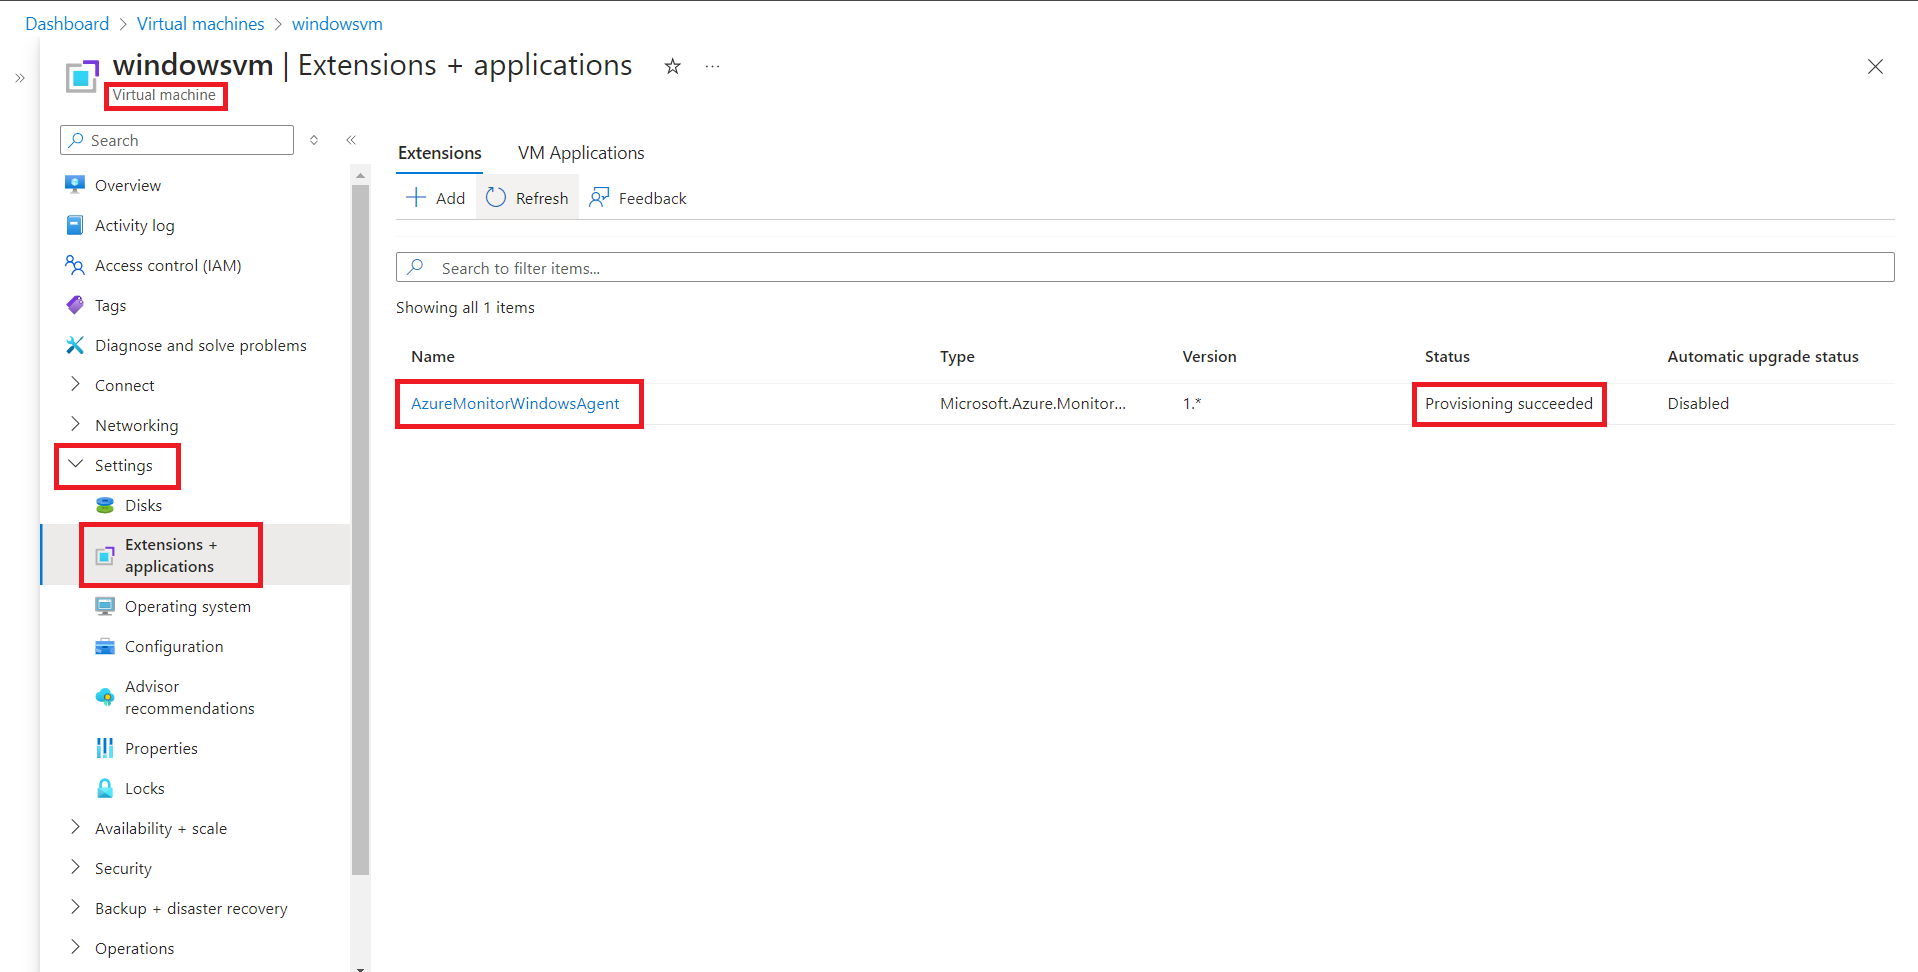
- Confirm the status of the installed agent is Provisioning succeeded.
- Navigate to the respective virtual machine and ensure it is in the 'Running' state. Then, in the left panel under Settings, select Extensions + applications.
Ensure the status is 'Provisioning succeeded' for AzureMonitorWindowsAgent or AzureMonitorLinuxAgent, based on the OS type of the VM. If agent status is not in succeeded state, please check the troubleshooting steps.
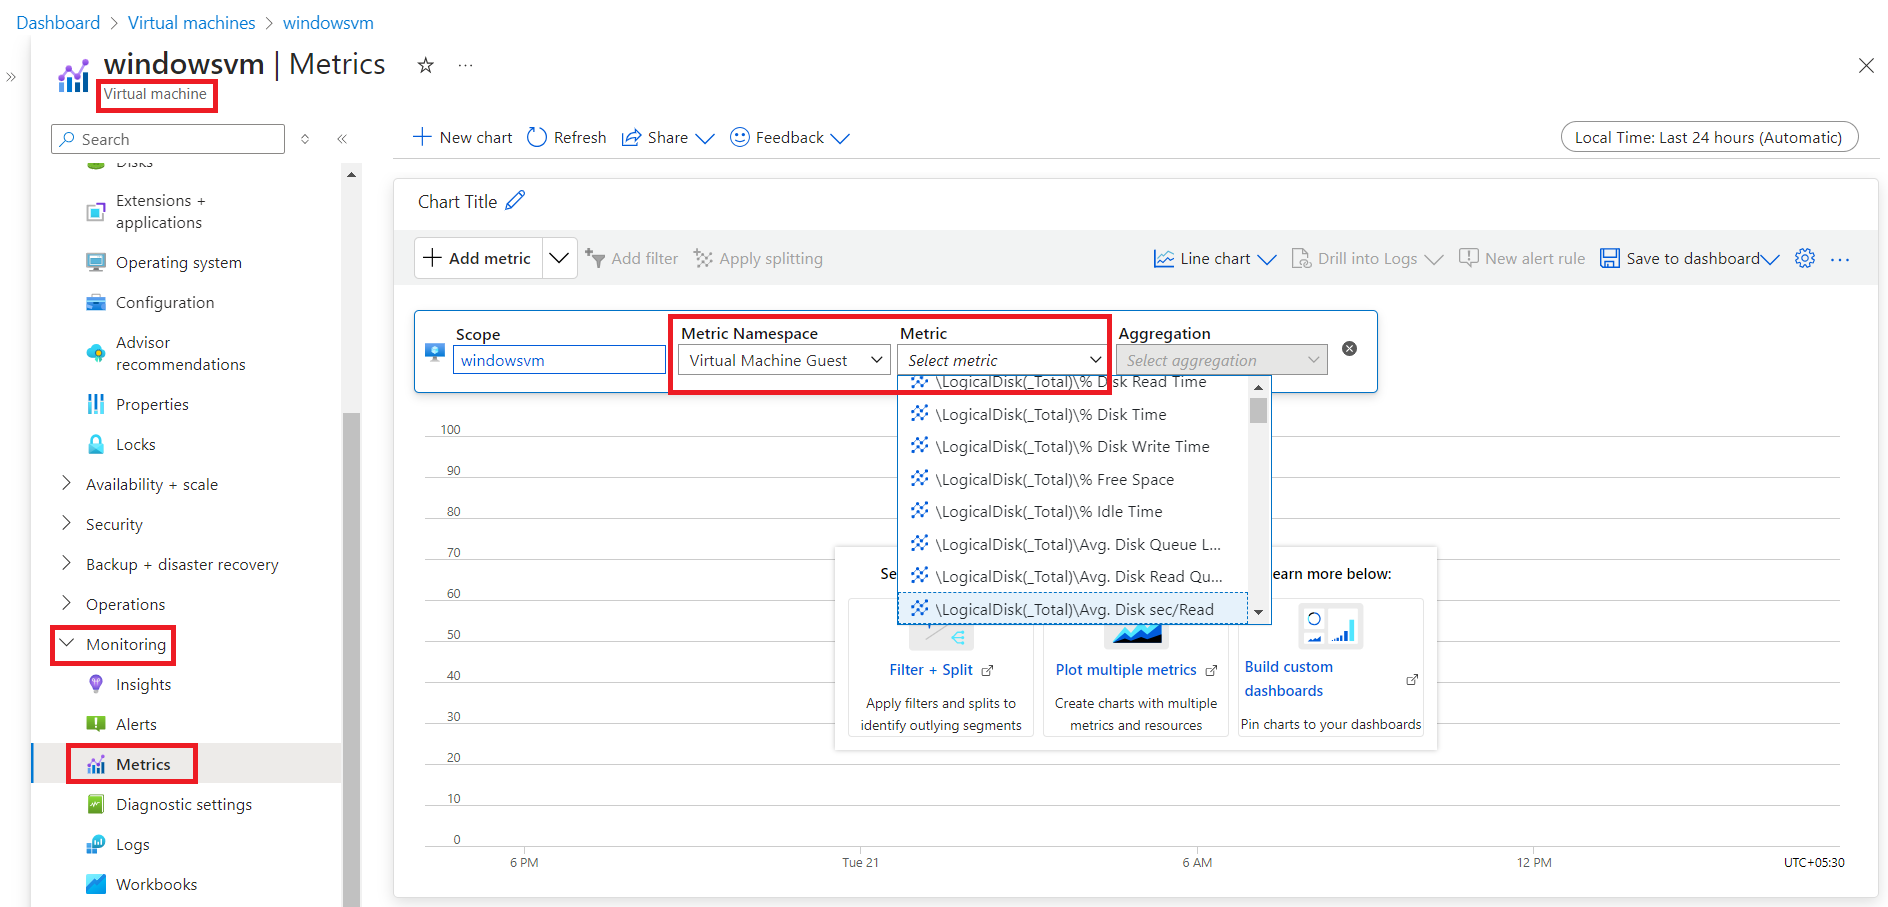
- Ensure that the required metrics are added under Azure Monitor Metrics.
- In the respective virtual machine, select 'Metrics' under Monitoring in the left panel.
- Click on Add metric and select the 'Metric Namespace' as Virtual Machine Guest for Windows (or) azure.vm.linux.guestmetrics for Linux.
Verify if all the Applications Manager supported metrics are mentioned under the 'Metric' list.
Steps to enable Azure Monitor Agent in Applications Manager:
- Navigate to the respective virtual machine monitor in Applications Manager and click on the Edit Monitor page.
- Ensure that the Agent Type is selected as Azure monitor agent.
By default, the Agent Type will be 'Azure Monitor Agent'. For existing monitors created before version 171400, the Agent Type will be 'Diagnostic Agent'.
Note:
- For Azure Government Cloud and Azure China VM monitors, Diagnostic Agent will be selected by default as fetching Performance Counters via 'Azure Monitor Metrics' destination using the Azure Monitor Agent is not supported in Microsoft Azure.
- Azure China accounts are supported from Applications Manager v173000.
Diagnostic Agent
Follow the steps given below to configure the Diagnostic Agent in Windows and Linux VMs:
- Steps to enable Diagnostic Agent in the Azure Portal
- Steps to enable Diagnostic Agent in Applications Manager
Note:
- From v171400, Azure Monitor Agent is the recommended way of monitoring agent metrics via Applications Manager.
- Applications Manager can collect diagnostic metrics from Storage accounts in both public and private links, as long as the storage account is accessible from the machine where Applications Manager is installed. For additional information, please refer to this link.
Steps to enable Diagnostic Agent in Applications Manager from v171400
- Navigate to the respective virtual machine monitor in Applications Manager and click on the Edit Monitor page.
- Ensure that the Agent Type is selected as Diagnostic agent.
- By default, the Agent Type will be 'Azure Monitor Agent'. To choose Diagnostic agent, you should select the Agent type as 'Diagnostic agent'.
- For existing monitors created before version 171400, the Agent Type will be 'Diagnostic Agent'.
Note:
- For Azure Government Cloud and Azure China VM monitors, Diagnostic Agent will be selected by default as fetching Performance Counters via 'Azure Monitor Metrics' destination using the Azure Monitor Agent is not supported in Microsoft Azure.
- Azure China accounts are supported from Applications Manager v173000.
GENERAL BEHAVIOUR
- Under the tab ‘Disk’, below ‘Disk spacing’ section, the disk size will be shown as 0, if disk size is not configured for the virtual machine in portal.
- To set disk size in portal, refer https://blogs.msdn.microsoft.com/madan/2016/09/28/resize-azure-resource-manager-arm-vm-os-data-disk-using-azure-portal/
Note: In case if you change the resource group of any Virtual machine in Azure portal, then provide the updated details (Virtual Machine ResourceID and Resource Group Name) in the Edit monitor page of that Virtual machine in Applications Manager for data collection to happen.
Enabling Guest OS monitoring
Following are the metrics monitored when Guest OS monitoring is enabled:
- Disk Utilization
- Disk IO Statistics
- Network Interface
- Service Monitoring
To enable Guest OS monitoring, go to Edit monitor page of Azure Virtual Machine monitor, click 'Enable Guest OS Monitoring' and provide the username and password of the VM. Enable the 'Use Public IP' option to use public IP to connect to Azure VM via internet and fetch Guest OS metrics. By default, this option will be unchecked and private IP will be used. However, this works only when Applications Manager installed machine and Azure Virtual Machine reside in the same network.
1. Perform the below steps in Azure Portal.
- Log in to Azure Portal.
- Open Azure Cloud Shell.
Execute the following command
Enable-AzVMPSRemoting -Name 'vm-hostname' -ResourceGroupName 'vm-resourcegroupname' -Protocol https -OsType Windows
Where you need to replace 'vm-hostname' and 'vm-resourcegroupname' with the Name and Resource group name of the VM for which the Guest OS metrics need to be monitored.
This enables PowerShell remoting for the respective VM with HTTPS protocol. To know more, click here.
Note: This command opens port 5986 on the virtual machine's firewall, allowing anyone to connect. To limit access, you can edit the firewall rule and specify the IP address of the allowed source (such as the Applications Manager machine).
2. Run Applications Manager with administrator privilege.
3. Perform the below steps in Applications Manager Server to enable Powershell Remoting (To collect metrics by remoting into Azure VMs).
- Open Powershell prompt with Administrator privileges.
Execute the following commands:
Set-ExecutionPolicy Unrestricted
If the above cmdlet produces an Error as below,you can configure Powershell Script Execution via Group Policy Editor:

#To configure Windows PowerShell for remoting, type the following command:
Enable-PSRemoting -force
#To configure the TrustedHosts setting to ensure that appmanager can trust the connections from other servers :
Set-Item wsman:\localhost\client\trustedhosts *
#To increase the maximum number of concurrent shells that a user can remotely open:
Set-Item WSMan:\localhost\Shell\MaxShellsPerUser -value 25 -WarningAction SilentlyContinue
#To set idle timeout value for sessions : Determines how long the session stays open if the remote computer does not receive any communication from the local computer, including the heartbeat signal. When the interval expires, the session closes:
Set-Item WSMan:\localhost\Shell\IdleTimeout -value 60000 -WarningAction SilentlyContinue
#Restart the WinRM service for changes to take effect:
Restart-Service WinRM
Configure Powershell Script Execution via Group Policy Editor
- Open the Group Policy Editor from Control Panel→ Edit Group Policy (or) run gpedit.msc from Start menu.
- To configure, navigate under Computer Configuration to Policies\Administrative Templates\Windows Components\Windows PowerShell.
- You should see a setting called Turn on Script Execution like in the following image:

- Double-click the setting. You will want to enable it and select an option from the drop down.

- Set it to “Allow All Scripts”.
- Click Apply and OK.
Microsoft Azure SQL Database
Here are the prerequisites to monitor Database Query Statistics in the Azure SQL Database monitor:
User Privileges:
To monitor Azure SQL Database Query Statistics, the SQL user account used for monitoring should have either Admin permissions or VIEW SERVER STATE permission. Additionally, the user must be granted permission for both the master database and the Azure SQL database. To create a user and provide access to both databases, follow the steps below:
To create a login from the master database, execute the following command:
CREATE LOGIN <login_name> WITH PASSWORD = '<password>';GOTo grant access to both the master database and the current SQL database, create the user by executing the following command in both the master and Azure SQL database:
CREATE USER <user_name> FOR LOGIN <login_name> WITH DEFAULT_SCHEMA = dbo;To grant VIEW SERVER STATE PERMISSION, execute the following query in the master database:
ALTER SERVER ROLE ##MS_ServerStateReader##ADD MEMBER <user_name>;GO
Firewall rule configuration in portal:
- In Azure portal, navigate to the Azure SQL database to be monitored → Click on Overview → Select Set Server Firewall → Add your Client IPs to the list. The client must add all their public IPs under the firewall settings in the SQL server.
Refer to this linkto learn how to set up the server firewall.
Allowing outgoing access on port 1433:
- For Applications manager to access and monitor the Azure SQL database, ensure that the firewall on your network and Applications Manager installed server allows outgoing communication on TCP port 1433.
Azure Kubernetes Service (AKS)
Note: Ensure that the below prerequisites are performed using the APM log-on user. If any issues are encountered during setup, refer here.
Install AzureCLI*:
Install the Azure CLI on an Applications Manager-installed machine (Windows or Linux) to configure the cluster with kubectl for monitoring. Learn more.
- Install Kubectl*:
If kubectl has already been installed on Applications Manager-installed machine, find the version of the kubectl that is using the following command in the command prompt.
kubectl version --clientIf the version is incompatible, then install the compatible version.
Install the compatible Kubectl utility executable file (kubectl.exe) by executing the following command in command prompt on the Applications Manager-installed machine:
az aks install-cli --client-version [client-version]The above command is bundled with both kubectl.exe and kubelogin.exe. Here, [client-version] refers to the compatible client-version to be installed. To find the [client-version], go to Azure portal -> AKS Cluster -> Overview -> Cluster Configuration -> Kubernetes Version.
Note: Choose the supported kubectl version for your AKS cluster by using a minor version that is either an older or newer kubectl relative to your cluster's Kubernetes version (kube-apiserver), consistent with the Kubernetes support policy for kubectl. The Kubernetes version of the cluster can be found in the Azure portal itself.
- Set the Environmental path variable*:
- You can add kubectl and kubelogin to the system environment path by adding the kubectl and kubelogin installed directory into the system path under Environment Variables → System → Path.
The default path of kubectl and kubelogin in Windows are:
C:\Users\USERNAME\.azure-kubectlC:\Users\USERNAME\.azure-kubeloginYou may skip this step if you have either already specified your kubectl and kubelogin installed directory in the system path of the environment variable or have installed kubectl and kubelogin under the <Applications Manager Home>\working directory.
Note:
- Ensure that the user used to start the Applications Manager service has access to Azure CLI & kubectl commands.
- If the Kubernetes cluster is created using the Authentication and Authorization mode 2 (Azure AD Authentication with Kubernetes RBAC) and mode 3 (Azure AD Authentication with Azure RBAC) then you must include the kubelogin installed directory into the system path, else it is not required.
- Make sure to restart Applications Manager after configuring the environmental variable to run the kubectl commands.
Authentication and Authorization*:
- To find the Authentication and Authorization mode, go to Azure portal → Kubernetes Services → Choose the respective cluster → Left pane → Settings → Security Configuration → Authentication and Authorization.

- Refer to the screenshot given below (taken from the AKS cluster creation page) to know about the three modes of Authentication and Authorization in AKS.

- Role Binding Requirement: To monitor an AKS cluster in Applications Manager, below cluster level role binding is required based on the Authentication and Authorization mode and the Subscription Level Role assigned for the AD Application used for monitor addition.
Authentication and Authorization Mode Subscription Level Role: Contributor Subscription Level Role: Reader Local Accounts with Kubernetes RBAC No specific Cluster level role binding is required Cluster level role:Azure Kubernetes Service Cluster User Role Microsoft Entra ID authentication with Azure RBAC Cluster level role:Azure Kubernetes Service RBAC Admin role Cluster level role:Azure Kubernetes Service RBAC Admin role Microsoft Entra ID authentication with Kubernetes RBAC No specific Cluster level role binding is required Cluster level role:Azure Kubernetes Service Cluster User Role - How to perform role bindingto AKS cluster:
- To perform role binding, go to Azure portalKubernetes Services → Choose respective cluster → Access control (IAM) → Add → Add role assignment → Choose the required role (Azure Kubernetes Service Cluster User Role / Azure Kubernetes Service RBAC Admin role based on the selected Authentication and Authorization mode) → Select member and add the respective Microsoft Entra application. Attached below is a screenshot of the built-in roles page for further reference. For more details, refer here.
- Enable Cluster Autoscaler: To fetch Cluster Autoscaler metrics, you need to enable and configure the cluster autoscaler on the node pool of the AKS cluster. You can enable the cluster autoscaler either while creating a cluster or for an existing cluster via Azure CLI. Learn more.
Note:* indicates that the step is mandatory.
Microsoft 365
- Prerequisites for adding the monitor (from Applications Manager Versions 16310)
- Prerequisites for adding the monitor (till Applications Manager Versions 16300)
- General Prerequisites for Powershell mode
Prerequisites for adding the monitor (Applicable for Applications Manager Versions from 16310):
General prerequisites:
- Login to Azure Portal using Microsoft 365 admin credentials. Go to App registrations → New registration and enter the relevant details and click Register to create a new App registration.
Copy Directory (Tenant) ID and Application (Client) IDfrom Overview page of the application.
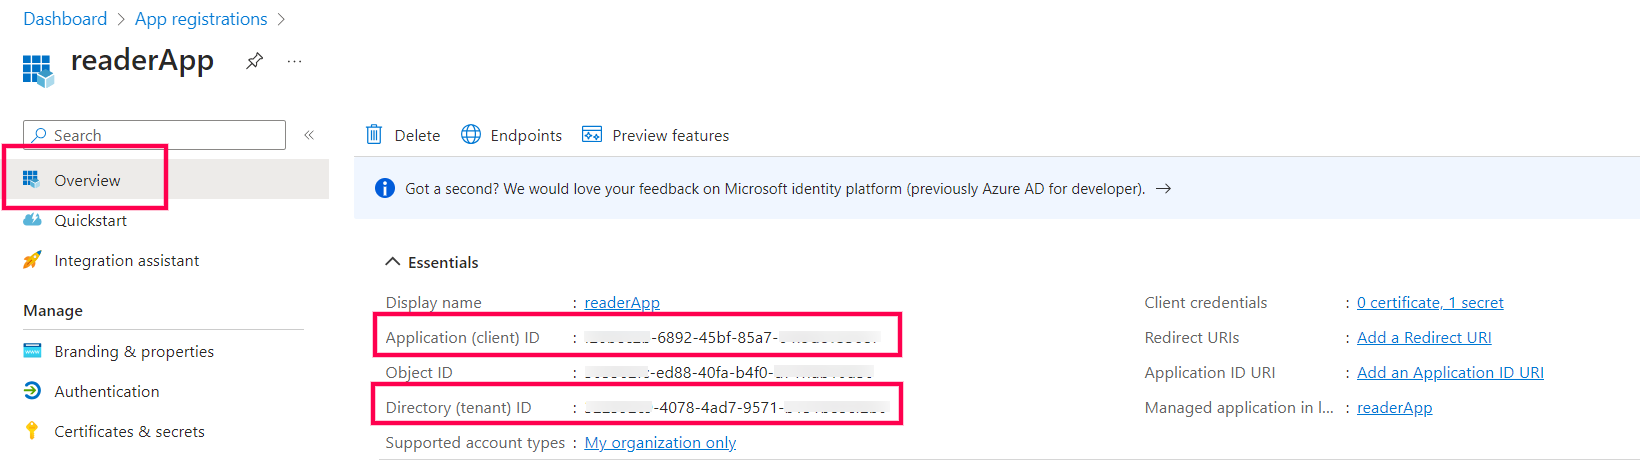
- Go to API Permissions → Add a permission → Microsoft Graph → Application permissions, choose the below permissions and click Add permission.
- Organization → Organization.Read.All
- Reports → Reports.Read.All
- ServiceHealth → ServiceHealth.Read.All
- Team → Team.ReadBasic.All
- User → User.Read.All
- Application → Application.Read.All
- Click on Grant Admin Consent button.

Go to the Manage tab and click on Certificates & Secrets → New Client secret, provide a Description, select Expires duration (Preferably 24 months) and click Add. Copy the Valueof the Client Secret.
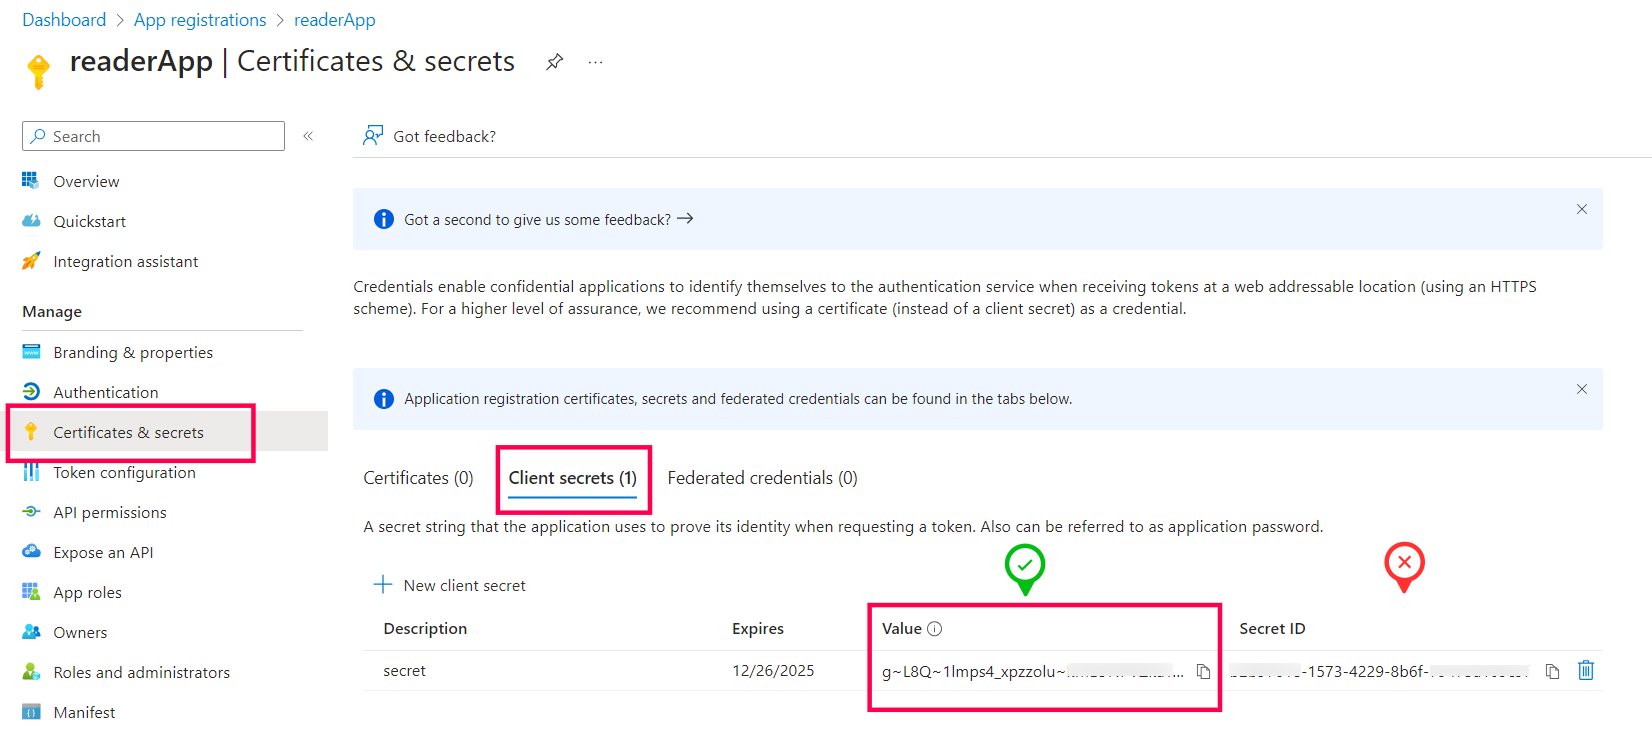
- Enable monitoring via Powershell by following the steps given in the Enable monitoring via Powershell tab.
- Use the Directory (Tenant) ID, Application (Client) ID and Client Secret values obtained from Step 2 and 5 to add Microsoft 365 monitor in Applications Manager.
Prerequisites to enable monitoring via Powershell:
- Please perform the general prerequisites followed by the given steps to successfully add the monitor.
- Go to the Microsoft 365 admin console and ensure that you have assigned Global Reader, SharePoint administrator roles to the user account.
- Open PowerShell window with Administrator privilege and execute the following commands:
Exchange Online PowerShell module:
Install-Module -Name ExchangeOnlineManagementSharePoint Online Powershell Module:
Install-Module -Name Microsoft.Online.SharePoint.PowerShell -RequiredVersion 16.0.21116.12000
Note:
- The primary and recommended mode of data collection is using Microsoft Graph API. The data fetched via Graph API is a consolidated report generated on a daily basis.
- To monitor live data, use the PowerShell mode of monitoring by enabling Enable monitoring via PowerShell. Refer prerequisites.
- PowerShell mode of monitoring needs Administrative user privileges to execute the commands and may also cause delayed data collection if the resource has a large number of Mailboxes or Sites. In such cases, Graph API mode is recommended.
- Refer more for the best practices to be followed while adding monitor.
Prerequisites for adding the monitor (Applicable for Applications Manager Versions till 16300):
- Please perform the general prerequisites followed by the given steps to successfully add the monitor.
You need to install the following modules to monitor Microsoft 365. While installing, ensure that you open Powershell with administrator privileges to execute the commands given below:
- Microsoft Online Service Sign-in Assistant for IT Professionals RTW * (Needed for Windows Server 2012 & below) Learn more
MSOnline Module for Windows PowerShell * (Refer this KBin case of any error while installing this module):
Install-Module -Name MSOnlineExchange Online PowerShell module:
Install-Module -Name ExchangeOnlineManagementSharePoint Online Powershell Module:
Install-Module -Name Microsoft.Online.SharePoint.PowerShell -RequiredVersion 16.0.21116.12000- Microsoft Teams PowerShell module: (For Applications Manager versions 15110 & above):
Open PowerShell window in Admin mode and execute the below command:
Install-Module MicrosoftTeams -RequiredVersion 2.3.1If error occurs and asks to use -AllowClobber, then execute the below command:
Install-Module MicrosoftTeams -RequiredVersion 2.3.1 -AllowClobberOnce done, execute the below command to install the Preview version:
Install-Module PowerShellGet -Force -AllowClobberOnce done, close the PowerShell window. Then open a new window and execute the below command:
Install-Module MicrosoftTeams -AllowPrerelease -RequiredVersion "1.1.9-preview"
Please note that the ones marked with * need to be installed irrespective of the service chosen.
Prerequisites for enabling Service Health Monitoring
- Go to https://portal.azure.com/ and login with the Microsoft 365 admin credentials.
- Go to App Registrations and choose New Registration
- Enter a name and click Register.
- In the Overview page of the application, copy the Directory (Tenant) ID and Application (Client) ID
- Go to API Permissions → choose Add a permission
- Select Microsoft Graph → Application permissions → ServiceHealth → ServiceHealth.Read.All and click Add permission.
- Choose Add a permission and select Microsoft Graph → Application permissions → Reports → Reports.Read.All and click Add permission.
- Now grant Admin access for the tenant.
- Go to the Manage tab and click on Certificates & Secrets → New Client secret.
- Add a name in Description and select Expires duration (Preferably 24 months) and click Add.
- Copy the value of that Client Secret.
- Now paste all the copied values into their respective textboxes in the Add Monitor page and proceed.
General Prerequisites for Powershell mode:
- The Microsoft 365 work or school account that you use for these procedures needs to be a member of an Microsoft 365 admin role. For more information, see About Microsoft 365 admin roles. The Microsoft 365 admin account used for monitoring must be assigned the below roles: Microsoft Teams administrator (Applicable only for Applications Manager versions till 16300), Global Reader or SharePoint administrator.
- You need to use a 64-bit version of Windows because of the requirements for the Microsoft 365 modules. You can use the following 64-bit versions of Windows:
- Windows 10
- Windows 8.1 or Windows 8
- Windows Server 2019
- Windows Server 2016
- Windows Server 2012 R2 or Windows Server 2012
Windows Server 2008 R2 SP1 *
* You need to have the Microsoft .NET Framework 4.5 or higher version installed and Windows Management Framework 5.1 installed. For more information, see Installing the .NET Framework and download the latest version of Windows Management Framework.
You need to install PowerShell version 5.1
To check the PowerShell version installed, open up a PowerShell prompt and execute the below command:
>$PSVersionTableCheck for the PSVersion attribute from the output to find out the version.
Windows PowerShell needs to be configured to run scripts for data collection. To do this, execute the following command in a Windows PowerShell session with administrator privileges.
>Set-ExecutionPolicy Unrestricted
When Modern Authentication is enabled in the SharePoint Online tenant:
Currently, Applications Manager makes use of Basic Authentication. However, if Modern Authentication is enabled in the SharePoint Online tenant, then Applications Manager can connect using non-modern authentication for which LegacyAuthProtocolsEnabled key should be set to True in your SharePoint Online tenant. Follow the steps given below to check if the LegacyAuthProtocolsEnabled key has been enabled and to set it as True:
Open Powershell using administrator privileges in the Applications Manager installed machine and execute the below command:
Import-Module Microsoft.Online.Sharepoint.PowerShell
Now execute the below command by replacing <tenant>with the tenant name and enter the user email and password when prompted:
Connect-SPOService -Url https://<tenant>-admin.sharepoint.com
Once the service has been connected, execute the below command:
Get-SPOTenant
Check the output received and verify the value for the LegacyAuthProtocolsEnabled key is True. If not, then execute the below command to set the value as True:
Set-SPOTenant -LegacyAuthProtocolsEnabled $True
- Now try running the same script and check if you get the Connection Successful message.
Reference: For more details, search for LegacyAuthProtocolsEnabled in this link.
AWS Monitoring
To enable AWS monitoring in Applications Manager, use one of the following supported authentication methods.
IAM User Access Keys
Step 1. Create an IAM User
Note: This step is not required if you already have an IAM user available for configuring Applications Manager permissions.
- Go to the AWS IAM Console and click Access Management → Users → Create User.
- Enter a username (for example, AppManagerUser) and click Next.
- Follow the prompts to complete the user creation process.
Step 2. Attach the Permissions
- In the AWS IAM Console, go to Users under Access Management.
- Select the user created in the previous step (for example, AppManagerUser) or the user intended for Applications Manager monitoring.
- Click Add Permissions from the Add Permission dropdown.
- Choose Attach policies directly.
- Under Filter by Type, select AWS managed — job function.
- Search for and select ReadOnlyAccess. Then click Next, followed by Add permissions.
Step 3. Generate the Access and Secret Keys
After attaching the required policy to the IAM user:
- Go to the AWS IAM Console, select Users under Access Management, and choose the user you created (for example, AppManagerUser).
- Navigate to the Security credentials tab.
- In the Access keys section, click Create access key.
- Choose Third-party service as the use case, select the confirmation checkbox, and click Next.
- (Optional) Add a tag for identification, then click Create access key.
- Download the .csv file containing the Access Key and Secret Access Key. You will need these when adding the Amazon monitor in Applications Manager.
IAM Role-Based Access
Follow the steps below to configure IAM role-based authentication for AWS monitoring in Applications Manager.
Step 1. Create an IAM Role
- Log in to the AWS IAM Console using an administrator account and navigate to Roles, then click Create role.
- Select AWS account as the trusted entity type and choose Another AWS account instead of This account (default).
- Under the Options section, enable Require external ID.
Step 2. Get External ID and Account ID
- To copy the Account ID and External ID, navigate back to Applications Manager.
- Go to the Add Monitor page and choose IAM Role-Based Access as the Authentication Type.
- Copy the displayed External ID and AWS Account ID values.
- Return to the AWS Console and enter the copied Account ID and External ID in the respective fields. Then click Next.
Step 3. Attach Read-Only Permissions and Create the Role
- On the Add permissions page, choose AWS managed - job function in the filter and search for the ReadOnlyAccess policy.
- Select the policy and click Next to proceed to the review page.
- Provide a name for the role (for example, ApplicationsManagerRole), review the details, and click Create role.
Step 4. Complete the Configuration
- By default, access is granted only to AWS default regions. To enable access to additional regions, go to IAM Console > Account Settings and set the Global endpoint option to All AWS Regions.
- Use the created IAM Role to add the Amazon monitor in Applications Manager.
Optional: Add Inline Policy for EC2 Actions
Follow the steps below to perform EC2 actions such as start, stop, and reboot from Applications Manager:
- Click Add permissions and choose Create inline policy.
- Switch to the JSON tab in the policy editor.
Replace the sample policy with the following:
{"Version": "2012-10-17","Statement": [{"Effect": "Allow","Action": ["ec2:StartInstances","ec2:StopInstances","ec2:RebootInstances"],"Resource": "*"}]}- Click Next, provide a name (for example, AppManagerWriteActions), and click Create policy.
Note:
- For granular access control, you can specify only the required set of APIs, as outlined in this knowledge base article.
- Permissions can be attached directly to the IAM user or assigned through a role. To do this, create a role with the required permissions and assign it to the user. For more details, refer to the official AWS IAM documentation.
List of APIs required for each AWS Service supported in Applications Manager
| Category | APM Monitor Name | Service Name in AWS Portal | List of APIs |
|---|---|---|---|
| Security (Mandatory) | AWS monitor authentication/addition | STS (Security Token Service) | GetCallerIdentity |
| Monitoring (Mandatory) | To collect performance metrics from CloudWatch. | CloudWatch | GetMetricData ListMetrics (Only for AWS EC2 OS level metrics) GetMetricStatistics (Required only for Applications Manager version below v.17.54.00 - Apr, 2025) |
| Data Collection (Recommended) | To ensure data collection runs only in regions subscribed for the account. | EC2 | DescribeRegions (Optional but recommended to prevent unwanted API hits and errors in non-subscribed regions. Supported from v17.76.00 - Sep, 2025) |
| Billing | Billing statistics | Cost Explorer Service | GetCostAndUsage GetCostForecast |
| AI & ML | Bedrock | Amazon Bedrock | ListFoundationModels GetFoundationModel |
Analytics | MSK Cluster | Amazon MSK (Managed Streaming for Apache Kafka) Cluster | ListClustersV2 DescribeClusterV2 |
| Redshift | Amazon Redshift | DescribeClusters ListMetrics | |
Compute | EC2 (Elastic Compute Cloud) | EC2 | DescribeVolumes DescribeInstances DescribeRegions DescribeInstanceAttribute |
EC2 Actions (System log, Start, Stop & Reboot instances) | GetConsoleOutput StartInstances StopInstances RebootInstances | ||
| Elastic Beanstalk | EC2 Auto Scaling | DescribeAutoScalingGroups ListStackResources | |
Elastic Beanstalk | Elastic Beanstalk | DescribeEnvironments DescribeEnvironmentResources DescribeEvents | |
ELB (Elastic Load Balancing) | ELB v2 | DescribeLoadBalancers DescribeLoadBalancerAttributes DescribeTargetGroups DescribeTargetHealth | |
| Lambda | Lambda | ListFunctions GetFunction | |
| Lightsail Instance | Amazon Lightsail | GetInstances GetInstance GetInstanceMetricData GetOperationsForResource | |
| WorkSpaces | Amazon WorkSpaces | DescribeWorkspaces DescribeWorkspacesConnectionStatus DescribeWorkspaceDirectories DescribeWorkspaceBundles DescribeIpGroups | |
Containers | ECS (Elastic Container Service) | Elastic Container Service | DescribeClusters DescribeContainerInstances DescribeServices DescribeTasks ListClusters ListContainerInstances ListServices ListTasks |
EKS (Elastic Kubernetes Service) | EKS | ListFargateProfiles DescribeNodegroup ListNodegroups DescribeFargateProfile, DescribeCluster ListClusters | |
| Elastic Container Registry | ECR | DescribeRepositories DescribeImages | |
Database | DocumentDB Clusters | RDS | DescribeDBClusters |
| DocumentDB Global Clusters | RDS | DescribeGlobalClusters | |
| DocumentDB Instances | RDS | DescribeDBInstances DescribeEvents | |
DynamoDB | DynamoDB | ListTables DescribeTable DescribeLimits DescribeStream | |
| ElastiCache Redis | ElastiCache | DescribeCacheClusters | |
| Neptune Cluster | RDS | DescribeDBClusters DescribeEvents | |
| Neptune Instance | RDS | DescribeDBInstances DescribeEvents | |
| RDS (Relational Database Service) | RDS | DescribeDBInstances DescribeDBClusters | |
| RDS Proxy | RDS | DescribeDBProxies | |
Integration | ActiveMQ | Amazon MQ | ListBrokers DescribeBroker ListConfigurations DescribeConfiguration |
RabbitMQ | ListBrokers DescribeBroker ListConfigurations DescribeConfiguration | ||
Simple Email Service | Amazon Simple Email Service | DescribeRegions ListIdentities GetSendQuota ListSuppressedDestination | |
| SNS (Simple Notification Service) | SNS | ListTopics ListSubscriptionsByTopic | |
| SQS (Simple Queue Service) | SQS | ListQueues GetQueueAttributes | |
Step Function | AWS Step Functions | ListStateMachines DescribeStateMachine ListExecutions | |
Management | Systems Manager (SSM) | AWS Systems Manager | ssm:ListCommands ssm:ListCommandInvocations ssm:DescribeInstanceInformation |
Migration and Transfer | DMS Replication Instance | AWS Database Migration Service | DescribeReplicationInstances DescribeReplicationTasks DescribeEvents DescribeEndpoints |
| DMS Replication Task | |||
File Transfer Family | AWS Transfer Family | ListServers DescribeServer ListUsers | |
Networking | API Gateway | API Gateway | /restapis /restapis/* /apis /apis/* |
| Client VPN | AWS VPN | DescribeClientVpnEndpoints | |
| Site-to-Site VPN | DescribeVpnConnections | ||
Cloudfront | CloudFront | ListDistributions GetDistribution ListInvalidations | |
| Direct Connect | Amazon Direct Connect | DescribeConnections | |
| Direct Connect - Virtual Interface | DescribeVirtualInterfaces | ||
| Elastic IP | AWS Elastic IP | DescribeRegions DescribeAddresses | |
| NAT Gateways | EC2 | DescribeNatGateways | |
| PrivateLink Endpoint | AWS PrivateLink | DescribeVpcEndpoints | |
| PrivateLink Endpoint Service | DescribeVpcEndpointServices | ||
| Route 53 (Health Checks) | Amazon Route 53 | ListHealthChecks GetHealthCheck GetHealthCheckStatus GetHealthCheckLastFailureReason | |
| Route 53 Resolver Endpoint | ListResolverEndpoints GetResolverEndpoint ListResolverEndpointIpAddresses | ||
| Transit Gateway | AWS Transit Gateway | DescribeTransitGateways DescribeTransitGatewayAttachments | |
VPC | Amazon VPC | DescribeVpcs DescribeVpcAttribute DescribeSubnets DescribeNetworkInterfaces DescribeFlowLogs ListObjectsV2 GetDatabase CreateDatabase GetTable CreateTable GetPartition StartQueryExecution GetQueryExecution GetQueryResults | |
| VPC Lattice Service | Amazon VPC Lattice | ListServices ListMetrics GetService | |
Security | AWS monitor authentication/addition | STS (Security Token Service) | GetCallerIdentity |
| Certificate Manager | AWS Certificate Manager | ListCertificates DescribeCertificate GetCertificate | |
| CloudHSM | AWS CloudHSM | DescribeClusters | |
Key Management Service | AWS Key Management Service | ListKeys DescribeKey ListGrants ListAliases DescribeCustomKeyStores GetKeyRotationStatus | |
| Network Firewall | AWS Network Firewall | DescribeFirewall ListFirewalls | |
| Secrets Manager | AWS Secrets Manager | ListSecrets DescribeSecret | |
| Web Application Firewall | AWS WAF | ListWebACLs GetWebACL | |
Storage | Backup | AWS Backup | ListBackupPlans ListBackupJobs ListCopyJobs ListRestoreJobs |
| Backup Vault | AWS Backup | ListBackupVaults ListRecoveryPointsByBackupVault ListBackupJobs ListCopyJobs | |
| DRS Recovery Instance | AWS Elastic Disaster Recovery | DescribeRecoveryInstances | |
| DRS Source Server | DescribeSourceServers GetReplicationConfiguration GetLaunchConfiguration | ||
| Elastic Disaster Recovery | DescribeSourceServers DescribeRecoveryInstances | ||
| EFS (Elastic File System) | EFS | DescribeMountTargets DescribeFileSystems | |
| FSx (File Cache) | FSx | DescribeFileCaches | |
S3 (Simple Storage Service) | S3 | ListAllMyBuckets ListBucket GetBucketLocation | |
| Storage Gateway | AWS Storage Gateway | ListGateways DescribeGatewayInformation | |
Storage Gateway File Share | ListFileShares DescribeSMBFileShares DescribeNFSFileShares | ||
Storage Gateway Volume | ListVolumes DescribeStorediSCSIVolumes DescribeCachediSCSIVolumes |
AWS Cloudfront
AWS account users are required to use their AWS Access Key and Secret Access Key to add an AWS monitor in Applications Manager. By default, AWS users have administrator privileges and can access AWS Service APIs. However, if your AWS user account has limited permission, here is the list of APIs used to collect metrics from the respective AWS services and performance metrics from CloudWatch:
The common API calls GetMetricData and ListMetrics are used for all the metrics that we collect from CloudWatch.
- To monitor additional metrics, for deep insights into a CloudFront distribution, refer the AWS documentation.
- For enabling additional metrics, refer the documentation to know about additional cost.
AWS EC2 Instances
To collect operating system-level metrics like Memory and Disk, you must deploy the Cloud-Watch Agent inside EC2 instance. The agent will send your data to Cloud-Watch from where Applications Manager fetches and displays it in the console. Click here to know more about how you can collect metrics from Amazon EC2 instances and on-premises servers with the Cloud-Watch Agent.
AWS account users are required to use their AWS Access Key and Secret Access Key to add an AWS monitor in Applications Manager. By default, AWS users have administrator privileges and can access AWS Service APIs. However, if your AWS user account has limited permission, here is the list of APIs used to collect metrics from the respective AWS services and performance metrics from CloudWatch:
- EC2 - DescribeVolumes, DescribeInstances, DescribeRegions, DescribeInstanceAttribute
- EC2 actions - GetConsoleOutput, StartInstances, StopInstances, RebootInstances
The common API calls GetMetricData, GetMetricStatistics and ListMetrics are used for all the metrics that we collect from CloudWatch.
Note:GetMetricStatistics API permission is not required from the Applications Manager release v17.54.00.
AWS Elastic Beanstalk
AWS account users are required to use their AWS Access Key and Secret Access Key to add an AWS monitor in Applications Manager. By default, AWS users have administrator privileges and can access AWS Service APIs. However, if your AWS user account has limited permission, here is the list of APIs used to collect metrics from the respective AWS services and performance metrics from CloudWatch:
- DescribeEnvironments
- DescribeEnvironmentResources
- DescribeAutoScalingGroups
- DescribeEvents
- ListStackResources
The common API call GetMetricData is used for all the metrics that we collect from CloudWatch.
- In the AWS console, select ElasticBeanstalk under Services.
- Select the environment that needs the metrics to be enabled.
- Click Configuration on the left side menu.
- Choose Monitoring → click Edit → select Enhanced → select all the metrics for environment and instance.
- Click Apply.
AWS Elastic Container Service (ECS)
To monitor AWS Elastic Container Service (ECS) using Applications Manager, ensure the following prerequisites are met:
- You need an AWS account with access to the AWS Access Key and Secret Access Key. These credentials are required to add an AWS monitor in Applications Manager.
By default, AWS accounts with administrative privileges have full access to AWS service APIs. However, if your AWS user account has restricted permissions, ensure that it has access to the following ECS and CloudWatch APIs used for data collection:
ECS APIs used:
- ListClusters
- DescribeClusters
- ListContainerInstances
- DescribeContainerInstances
- ListServices
- DescribeServices
- ListTasks
- DescribeTasks
- GetMetricData (used to retrieve all ECS-related performance metrics)
Enabling Container Insights
To collect enhanced performance metrics for ECS, Container Insights must be enabled on your ECS cluster.
- Ensure your system has AWS CLI version 1.16.200 or above installed.
To enable Container Insights on an existing ECS cluster, run the following command in your AWS CLI. Learn more
aws ecs update-cluster-settings --cluster <ClusterName> --settings name=containerInsights,value=disabled- If your ECS cluster is hosted on EC2 instances, you need to deploy the CloudWatch agent to collect instance-level metrics. Follow the steps given below:
- Download the required JSON file from the AWS documentation and save the file locally.
To deploy the CloudWatch agent, run the following AWS CloudFormation command from any server that has the AWS CLI installed:
aws cloudformation create-stack --stack-name CWAgentECS-<CLUSTERNAME>-<REGION> --template-body file://<FILENAME>.json --parameters ParameterKey=ClusterName,ParameterValue=<CLUSTERNAME> ParameterKey=CreateIAMRoles,ParameterValue=True --capabilities CAPABILITY_NAMED_IAM --region <REGION>Note: Replace <CLUSTERNAME>, <REGION>, and <FILENAME> with your actual ECS cluster name, AWS region, and file path.
AWS Elastic Kubernetes Service (EKS)
AWS account users are required to use their AWS Access Key and Secret Access Key to add an AWS monitor in Applications Manager. By default, AWS users have administrator privileges and can access AWS Service APIs. However, if your AWS user account has limited permission, here is the list of APIs used to collect metrics from the respective AWS services and performance metrics from CloudWatch:
- Check if you have given access for the following APIs to the IAM user whose credentials are being used for monitoring EKS:
Download and install the AWS CLI (Windows or Linux) on Applications Manager installed machine to configure cluster with kubectl for monitoring. Learn more
- Windows: Execute the downloaded file to open the Installation wizard and complete the installation.
Linux: Execute the below commands to unzip the downloaded file, execute the program and complete the installation. Learn more
unzip awscliv2.zipsudo ./aws/install
Note: AWS CLI is used only for AWS EKS monitoring. Uninstall AWS CLI if no longer needed.Download the latest Kubectl utility executable file (Windows or Linux) on Applications Manager installed machine. Learn more
- Windows: Place the downloaded executable file under <Applications Manager Home>\working\ directory (or) add kubectl to the system environment path.
Linux: Execute the following commands (or) add kubectl to the system path.
chmod +x ./kubectlmkdir -p $HOME/bin && cp ./kubectl $HOME/bin/kubectl && export PATH=$PATH:$HOME/bin
Note: You must use a kubectl version that is within one minor version difference of your Amazon EKS cluster control plane. For example, a 1.31 kubectl client works with Kubernetes 1.30, 1.31, and 1.32 clusters.- EKS Cluster Access for Non-Admin IAM Users (Skip this if you're the Cluster Creator/Admin i.e., Cluster was created using the same IAM credential given in Applications Manager)
- Go to AWS Console → EKS cluster console → Choose the required cluster → Choose Access tab → IAM access entries → Create access entry → Choose the IAM user for IAM principal ARN, Type as Standard → Give the AmazonEKSAdminViewPolicy (Permissions given in the policy: get, list, watch for all resources, refer here for more.) in the Policy name & Access scope as Cluster → Click on Add Policy → Click Next & Createbutton. For more details about the step, refer here.
To fetch metrics from Container Insights, implement the prerequisites for container insights. However, to execute the commands specified in the prerequisites, AWS CLI and kubectl should be configured.
To configure AWS CLI, execute the below command and provide the necessary credentials:aws configureTo configure kubectl, execute the below command:aws eks --region {region} update-kubeconfig --name {cluster_name} --kubeconfig <FILEPATH>.
- Nodes (EC2 instances) should have the policy CloudWatchAgentServerPolicy to send container insights metrics to CloudWatch.
Note: In case you face any issues while monitoring AWS EKS, refer here for detailed troubleshooting steps.
Amazon MSK Cluster
AWS account users are required to use their AWS Access Key and Secret Access Key to add an Amazon MSK Cluster monitor in Applications Manager. By default, AWS users have administrator privileges and can access AWS Service APIs. However, if your AWS user account has limited permission, here is the list of APIs used to collect cluster configuration details and performance metrics from Amazon MSK and CloudWatch:
- ListClustersV2 (to discover available MSK clusters)
- DescribeClusterV2 (to retrieve cluster configuration and state details)
The common API call GetMetricData is used to collect performance and health metrics such as active controllers, offline partitions, disk utilization, client connections, and ZooKeeper/KRaft-related metrics from CloudWatch.
Note: Ensure that the IAM user or role has sufficient permissions for Amazon MSK and CloudWatch APIs in the regions where your MSK clusters are deployed.
AWS Private Link
AWS account users are required to use their AWS Access Key and Secret Access Key to add an AWS monitor in Applications Manager. By default, AWS users have administrator privileges and can access AWS Service APIs. However, if your AWS user account has limited permission, here is the list of APIs used to collect metrics from the respective AWS services and performance metrics from Private Link:
- PrivateLink Endpoint - DescribeVpcEndpoints
- PrivateLink Endpoint Service - DescribeVpcEndpointServices
AWS Route 53 Health Checks
AWS account users are required to use their AWS Access Key and Secret Access Key to add an AWS monitor in Applications Manager. By default, AWS users have administrator privileges and can access AWS Service APIs. However, if your AWS user account has limited permission, here is the list of APIs used to collect metrics from the respective AWS services and performance metrics from CloudWatch:
The common API call GetMetricData is used for all the metrics that we collect from CloudWatch.
Note: Enable the Measure Latency option to monitor latency-related metrics when creating a Route 53 Health Check.
AWS S3 Buckets
AWS account users are required to use their AWS Access Key and Secret Access Key to add an AWS monitor in Applications Manager. By default, AWS users have administrator privileges and can access AWS Service APIs. However, if your AWS user account has limited permission, here is the list of APIs used to collect metrics from the respective AWS services and performance metrics from CloudWatch:
The common API call GetMetricData is used for all the metrics that we collect from Cloudwatch.
Note: To monitor S3 Bucket Request metrics, the same should be enabled in AWS console. We recommend using the name EntireBucket for a filter that applies to all objects. For more information, refer here.
AWS Transit Gateway
AWS account users are required to use their AWS Access Key and Secret Access Key to add an AWS monitor in Applications Manager. By default, AWS users have administrator privileges and can access AWS Service APIs. However, if your AWS user account has limited permission, here is the list of APIs used to collect metrics from the respective AWS services and performance metrics from Transit Gateway:
- Transit Gateway - DescribeTransitGateways, DescribeTransitGatewayAttachments
Amazon VPC
AWS account users are required to use their AWS Access Key and Secret Access Key to add an AWS monitor in Applications Manager. By default, AWS users have administrator privileges and can access AWS Service APIs. However, if your AWS user account has limited permission, here is the list of APIs used to discover VPC resources, validate flow log availability, and query network traffic analytics data for the Amazon VPC monitor:
- EC2 — DescribeVpcs, DescribeVpcAttribute, DescribeSubnets, DescribeNetworkInterfaces, DescribeFlowLogs
- Amazon S3 — ListObjectsV2
- AWS Glue — GetDatabase, CreateDatabase, GetTable, CreateTable, GetPartition
- Amazon Athena — StartQueryExecution, GetQueryExecution, GetQueryResults
Note:
- For detailed setup requirements, refer to the Amazon VPC - Prerequisites article.
- For common queries and troubleshooting information, see the Frequently Asked Questions KB.
AWS VPN
AWS account users are required to use their AWS Access Key and Secret Access Key to add an AWS monitor in Applications Manager. By default, AWS users have administrator privileges and can access AWS Service APIs. However, if your AWS user account has limited permission, here is the list of APIs used to collect metrics from the respective AWS services and performance metrics from Private Link:
- Client VPN - DescribeClientVpnEndpoints
- Site-to-Site VPN - DescribeVpnConnections
Google Cloud Platform
- Prerequisites for monitoring Google Cloud Platform (GCP) metrics
- Steps to create an OAuth Provider for GCP
Prerequisites for monitoring Google Cloud Platform (GCP) metrics
- Login to the GCP Console with Owner access to the Project to be monitored.
- Go to GCP Console → APIs & Services → Library, to enable the following APIs :
- Cloud Resource Manager API
- Cloud Asset API
- Compute Engine API
- Stackdriver API
- Cloud Monitoring API
- Cloud Storage
- Google Cloud Storage JSON API
- Cloud Filestore API
- Kubernetes Engine API
- Create an OAuth provider using the steps mentioned in this link to monitor a GCP project.
- Once an OAuth provider is created, verify if it has an Access Token and Refresh Token.
- You can use OAuth provider to add multiple projects under the same account, but ensure that the APIs are enabled in each project before adding a monitor in AppManager.
Steps to create an OAuth Provider for GCP
- In Applications Manager, go to Settings → Discovery and Data Collection → Credential Settings → OAuth Provider and select Add OAuth Provider. (Make sure you are logged in from a fully qualified domain name as in the help card)
- Copy the Redirect URL from the Add OAuth Provider window.
- (Skip to the next step if app is already created) In the GCP Console, go to Google Auth Platform → Branding. If the app is not yet created, click Get Started, provide the necessary App Information, select External under Audience, and click Create.
- Go to GCP Console → Google Auth Platform → Branding. Under Authorized domain, click 'Add Domain' and enter the domain name from the Redirect URL. Then press the enter key and click the Save button. Navigate to Google Auth Platform → Audience and ensure that the User Type is set to External.
- Go to GCP Console → Google Auth Platform → Clients → Create Client.
- Select Web Application, enter the copied Redirect URI in the Authorised redirect URIs section, press Enter and click Create.
- Now the list of clients created will be displayed. Locate the client you have created for this process and click the respective pencil icon under the 'Action' column.
- You can find the 'Client ID' and 'Client Secret' under the 'Additional Information' section. Copy it and fill in the Add OAuth Provider window.
Fill the following as below:
- Grant Type - Authorization Code
- Authorization Endpoint URL - https://accounts.google.com/o/oauth2/auth
- Scope - https://www.googleapis.com/auth/cloud-platform
- Query parameters:
Name - access_type
Value - offline - Token endpoint URI - https://oauth2.googleapis.com/token
- Token request method - Post request body
- Authenticated request method - Basic Authentication
Note : Remaining fields should remain as default.- Click Authorize button and authorize using the account to login to GCP.
Once created, verify whether both Access token and Refresh token are generated.
Note: If the refresh token is not generated, verify that the steps above were followed correctly. Also, check if the account is already connected to the Google Auth Platform. To do this, go to Google Account Settings → Data & Privacy → Third-party apps & services and check if the Google Auth Platform is listed. If it is, delete the connection and try again. If this account is being used for a different purpose, consider using a separate Google account to authorize OAuth to onboard GCP monitoring in Applications Manager.- Use this OAuth Provider in the Google Cloud Platform's New Monitor page.
Oracle Cloud Infrastructure
To obtain data from Oracle Cloud into Applications Manager, the user must have appropriate policies and permissions as signed by the administrator. Follow the steps below to configure access:
Step 1: Create a Group and Add a User
- Log in to the Oracle Cloud Infrastructure (OCI) Console as an Administrator.
- In the navigation menu (☰), go to Identity & Security → Identity → Domains.
- Select the domain. In the left menu, click Groups, then click Create Group.
- Provide the following details:
- Name: A suitable group name (e.g., AppManager)
- Description: A brief description (optional)
Users: Add the user intended for Applications Manager monitoring
Note: The User OCID of this user will be required while adding the monitor in Applications Manager.
- Click on Create to finalize group creation.
Step 2: Create a Policy
- In the navigation menu (☰), go to Identity & Security → Identity → Policies, and click Create Policy.
- Provide the following details:
- Name: A suitable policy name (e.g., AppManagerPolicy)
- Description: A brief description
- Compartment: Ensure you are in the root compartment
Enable Show Manual Editor in the Policy Builder and paste the following policy statement:
ALLOW GROUP <Your Group Name> to use all-resources IN TENANCY
Example:ALLOW GROUP AppManager to use all-resources IN TENANCYAlternatively, you can use the read role instead of use if only read access is needed:
ALLOW GROUP AppManager to read all-resources IN TENANCYNote: Using the read role provides view-only access and prevents actions like creating, updating, or deleting resources, including starting/stopping Compute Instances. Refer to the Oracle documentation for more policy options.
- Click Create to apply the policy.
Step 3: Add the Oracle Cloud Monitor in Applications Manager
When adding an OCI monitor in Applications Manager, you will need the following details (Tenancy OCID, User OCID, PEM File Path, Fingerprint):
- Tenancy OCID
- Go to the navigation menu (☰) → Governance & Administration → Account Management → Tenancy Details.
- Copy OCID from the Tenancy Information tab.
- User OCID
- If you are a user: Click your profile icon (top right) → User Settings → Copy OCID from User Information section. (OR)
- If you are an admin: Profile icon (top right) → Identity Domain → User Management → Select the user (created in step 1) from Users section → Copy OCID from User Information section.
- PEM File Path & Fingerprint
- Download and save PEM file in a location:
- Go to API Keys section:
- If you are a user: Go to your Profile → User Settings → Token and Keys. (OR)
- If you are an admin: Go to Identity & Security → Users → Select user (created in step 1) → API Keys.
- Click 'Add API Key' → Generate API key pair → Download Private Key → Save the .pem file in the planned location. (e.g., C:\Users\<username>\.oci\oci_api_key.pem) → click 'Add KEY'
- Go to API Keys section:
Fingerprint: After adding the API Key, the fingerprint will be displayed in the API Keys list - Copy and Save this value.
⚠️ Important:
- Do not delete or rename this folder or the .pem file, as they are essential for authentication of Oracle Cloud monitoring operations.
- Ensure Applications Manager has access to the mentioned file path (the path where you save the access keys).
- Download and save PEM file in a location:
- Subscribed Regions
- Click your profile icon (top right) → Manage Regions → View/Select regions - View supported regions in Applications Manager.
Oracle Autonomous Database
To obtain data for TableSpace, Sessions, Processes, and Jobs in Applications Manager, you must configure the Oracle Wallet credentials in the Oracle Autonomous DB monitor. To do so, follow the steps given below:
- Go to Monitor Actions → Edit Monitor available on the right side of the Oracle Autonomous DB monitor dashboard page.
- Download the Oracle Wallet credentials. (Click here to learn how to download the Oracle Wallet credentials)
- After downloading, unzip the Wallet_databasename.zip file to a secure location.
- Copy the location path of that file and provide it as input in the Wallet File Path field.
- Now open the tnsnames.ora file (obtained after unzipping Wallet_databasename.zip file) in any text editor. This file contains the predefined services identifiable as high, medium, and low. Each service has its own TNS alias and connection string. Copy any one of the alias names (based on severity) and provide the same as input in the TNS Alias Name field. (Refer here to learn more)
- Enter the username and password used to connect to the autonomous database. (Minimum roles required for the user - CONNECT and SELECT_CATALOG_ROLE)
- Click Update.
OpenStack
Note: In OpenStack, as per policy defaults, only users with the administrative role can perform all the operations.
Each service in OpenStack has its own role-based access policies to determine which user can access the objects.
These details are defined in the respective service's policy.yaml file.
Configuring policies for a user allows you to access the required APIs that will be used by Applications Manager to collect data.
- Authentication API: Configure the Keystone policy file to get access to GET /v3/auth/tokens API.
- Cinder Services: Configure the Cinder policy file to get access to GET /v3/{project_id}/os-services API.
- Glance Images: Configure the Glance policy file to get access to GET /v2/images API.
- Hypervisors: Configure the Nova policy file to get access to GET /os-hypervisors API.
- Neutron Agents: Configure the Neutron policy file to get access to GET /v2.0/agents API.
- Nova/Compute Services: Configure the Nova policy file to get access to GET /os-services, GET /servers/detail API.
Set aside the values of the following fields to add an OpenStack monitor in Applications Manager:
- Base Authentication URL
- Tenant Name
- Username and Password
- Project-scoped Token (If applicable)
ERP
Oracle EBS
Applications Manager uses the Dynamic Monitoring Service (DMS) to monitor the performance and availability of Oracle E-Business Suite. You can access performance metrics using servlets from the following URLs for different versions of EBS from the Applications Managers:
- EBS R11 - http://<host>:<port>/dms0/AggreSpy
- EBS R12.0 - http://<host>:<port>/dms0/Spy
- EBS R12.2.0, R12.2.5 and Above - http://<host>:<port>/dms/Spy
For Oracle E-Business Suite Version R11i, the DMS Servlet has to be made accessible to the system where Applications Manager is running. For Versions R12.0 and R12.2.0, the DMS Servlet should be accessible by default. It is recommended that you test to ensure that the Servlet is accessible to the Applications Manager system. [The instructions given below are referred from the Oracle website.]
For Oracle E-Business Suite R11i:
By default, the dms0/AggreSpy URL is protected, allowing only the localhost (127.0.0.1) to access the AggreSpy Servlet. To view metrics from a system other than the localhost, you need to change the DMS configuration for the system running the Oracle EBS that you want to monitor by modifying the trusted.conf file. This can be done as follows:
- Open the trusted.conf file under $ORACLE_HOME/Apache/Apache/conf on a UNIX system, or%ORACLE_HOME%\Apache\Apache\conf\ on a Windows system.
- Add the Applications Manager Hostname and IPaddress in the Allow from list as shown in the following example:
<Location ~ "/(dms0|DMS|Spy|AggreSpy)">
Order deny,allow
Deny from all
Allow from localhost
Allow from <list of TRUSTED IPs>
</Location> - Now open the httpd.conf and httpd_pls.conf files and check if the trusted.conf file is included. The Files are present under$ORACLE_HOME/Apache/Apache/conf on a UNIX system, or %ORACLE_HOME%\Apache\Apache\conf\ on a Windows system. If the trusted.conf file is not included, add the following lines in both the files and save:
# Include the trusted.conf file
include $ORACLE_HOME/Apache/Apache/conf/trusted.conf - Restart Oracle E-Business Suite and ensure that you are able to access the URL http://<host>:<port>/dms0/AggreSpy from the Applications Manager system.
For Oracle E-Business Suite R12.0:
Ensure that you are able to access the URL http://<host>:<port>/dms0/Spy(Hostname = Hostname with domain name, Port number = OAS listening port) from the Applications Manager system.
For Oracle E-Business Suite R12.1.3:
Applications Manager uses Oracle JDBC connection to monitor it.For monitoring Oracle EBS v12.1.3, the following user privileges will be required:
- CONNECT role
- SELECT_CATALOG_ROLE role
- SELECT_ANY_TABLE role
For Oracle E-Business Suite R12.2.0, R12.2.5 and above:
Ensure that you are able to access the URL http://<host>:<port>/dms/Spy (Hostname = Hostname with domain name, Port number = Weblogic Admin Server listening port) from the Applications Manager system. Users must enter the credentials of their Weblogic Admin server in their Oracle E-Business Suite to access the URL.
Caution: Modifying trusted.conf has security implications. Modify this file only if you understand the security implications for your site. By exposing metrics to systems other than the localhost, you allow other sites to potentially view critical Oracle EBS Server internal status and runtime information.
SAP Server / SAP CCMS
- SAP JavaConnector (JCo) must be present in Applications Manager's classpath.
SAP Gateway Port (Default: 3300) must be open for both inbound and outbound traffic in the firewall. To verify the RFC port, open SAP Management Console → Expand the SAP instance → Select Access Points → Check the port listed for the RFC protocol.
SAP user profile must have the S_RFC, S_XMI_LOG and S_XMI_PROD authorization objects, which can be found by executing the transaction code SU56 in SAP logon to view user authorizations.
Note: The user name provided while adding SAP monitor should have sufficient privileges to access CCMS and Background job metrics. To check this, the user can execute RZ20 transaction in the SAP GUI and see if the CCMS monitor sets can be displayed.
Applications Manager build 14270 and above
For Windows:
- Download and unzip the SAP JavaConnector [SAP JCo 3.1.x] from here. Depending on the hardware architecture of host machine where Applications Manager is running, make sure you download the respective zip file.
- In the machine, where Applications Manager is running, copy sapjco3.jar and sapjco3.dll and sapjco3.pdb under AppManager_home/working/lib directory.
- If Applications Manager is installed on Windows, as mentioned in SAP Note 2786882 on Windows platforms, JCo 3.1 requires the Visual Studio 2013 C/C++ runtime libraries to be installed on the system. To verify, check for the presence of the "Microsoft Visual C++ 2013 Redistributable" package in ControlPanel -> Program and Features. If not present, download and install the "Visual C++ 2013 Redistributable Package" from the Microsoft knowledge base article https://support.microsoft.com/en-us/help/4032938 and choose the package, which corresponds to the used Locale and JVM bit-width (x64 for 64-bit or x86 for 32-bit).
- Restart Applications Manager.
Note: Do not copy the sapjco3.dll file neither into the {windows-dir}/system32 nor into the {windows-dir}/SysWOW64 directory. This will break the operability of other JCo versions that are already installed on the same system. Furthermore you would risk that the current installation also would not work anymore, if the sapjco3.dll gets replaced in the respective Windows system directory in the future.
For Linux:
- Download and unzip SAP JavaConnector[SAP JCo 3.1.x] from here. Depending on the hardware processor of the host machine where Applications Manager is installed. make sure you download the respective zip file.
- In the machine, where Applications Manager is running, copy sapjco3.jar and libsapjco3.so under AppManager_home/working/lib directory.
- Restart Applications Manager.
Applications Manager build below 14270
For Windows:
- Download and unzip the SAP JavaConnector [SAP JCo 3.0.x] from here. Depending on the hardware architecture of host machine where Applications Manager is running, make sure you download the respective zip file.
- In the machine, where Applications Manager is running, copy sapjco3.jar and sapjco3.dll and sapjco3.pdb under AppManager_home/working/lib directory.
- If Applications Manager is installed on Windows, as mentioned in SAP Note1077727 JCo 3.0 requires the Microsoft Visual Studio 2005 C/C++ runtime libraries (version 8.0.50727.6195) to be installed on the system. To verify, check for the presence of the "Microsoft redistributable runtime DLLs VS2005 SP1" in ControlPanel -> Program and Features. If not present, download and install the "Visual C++ 2005 SP1 Redistributable Package" from the Microsoft website https://www.microsoft.com/en-us/download/details.aspx?id=26347 and choose the package, which corresponds to the used JVM bit-width and processor architecture (x64 for 64-bit, x86 for 32-bit and ia64 for Itanium processors).
- Restart Applications Manager.
Note: Do not copy the sapjco3.dll file neither into the {windows-dir}/system32 nor into the {windows-dir}/SysWOW64 directory. This will break the operability of other JCo versions that are already installed on the same system. Furthermore you would risk that the current installation also would not work anymore, if the sapjco3.dll gets replaced in the respective Windows system directory in the future.
For Linux:
- Download and unzip SAP JavaConnector[SAP JCo 3.0.x] from here. Depending on the hardware processor of the host machine where Applications Manager is installed. make sure you download the respective zip file.
- In the machine, where Applications Manager is running, copy sapjco3.jar and libsapjco3.so under <Applications Manager Home>/working/lib directory.
- Restart Applications Manager.
Microsoft Dynamics CRM / 365 (On-Premise)
To monitor a Microsoft Dynamics CRM / 365 application, the user must have Administrator privileges with permission to execute WMI queries on 'root\CIMV2' namespace of the Dynamics CRM / 365 Server. To add an Microsoft Dynamics CRM / 365 application, follow the below given steps:
- Install the latest .NET Framework on your Applications Manager machine.
Install/enable .NET Framework 3.5 on Applications Manager installed machine: (This needs to be done even if you have installed the latest version. To know more click here.)
- To know how to enable .NET 3.5 in Windows Server 2008, click here.
- To know how you can enable .NET 3.5 in other Windows Servers, click here.
Note: The .NET Framework 3.5 prerequisite applies only to Applications Manager versions up to 173100.
- Grant access to the following list of ports on the firewall for Microsoft Dynamics CRM / 365 monitoring:
- Windows Management Instrumentation (WMI) (Default : TCP 445)
- Remote Procedure Call (RPC) (Default :TCP 135)
- Target server uses random port above 1024 by default to respond back for remote communication (DCOM) (Default : TCP 1025 to 1030)
To use Powershell for data collection, make sure proper steps are followed to enable Powershell remoting.
Note: If you want to monitor as a non-admin user, follow the steps mentioned in this link.
Microsoft Dynamics AX
To monitor a Microsoft Dynamics AX application, the user must have Administrator privileges with permission to execute WMI queries on 'root\CIMV2' namespace of the Microsoft Dynamics AX. To add an Microsoft Dynamics AX application, follow the below given steps:
- Install the latest .NET Framework on your Applications Manager machine.
Install/enable .NET Framework 3.5 on Applications Manager installed machine: (This needs to be done even if you have installed the latest version. To know more click here.)
- To know how to enable .NET 3.5 in Windows Server 2008, click here.
- To know how you can enable .NET 3.5 in other Windows Servers, click here.
Note: The .NET Framework 3.5 prerequisite applies only to Applications Manager versions up to 173100.
- Firewall access for monitoring:Following are the list of ports required for monitoring:
- Windows Management Instrumentation (WMI) (Default : TCP 445)
- Remote Procedure Call (RPC) (Default :TCP 135)
- Target server uses random port above 1024 by default to respond back for remote communication (DCOM) (Default : TCP 1025 to 1030)
Note: If you want to monitor as a non-admin user, follow the steps mentioned in this link.
SAP Business One
Integration Framework should be launched for SAP Business One and should be accessible from Applications Manager Server. To validate the connectivity, please execute the following API request from the 'Applications Manager' server:
- POST URL:http://HOST:PORT/B1iXcellerator/exec/ipo/iFw2.APIs/com.sap.b1i.dev.api/ipo/api2.ipo/api.caller
- Body Content type: application/atom+xml
- Request Body:
<api.call method="users" mode="list">
<request>
<admin>true</admin>
<runtime>false</runtime>
</request>
</api.call>
SAP Java
- Copy the following jars and place it under APM_HOME/working/classes
- For Versions below 7.3:
- Following .jar files are required from \usr\sap\<SID>\JC<InstanceNumber>\j2ee\admin\lib:
- admin.jar
- com_sap_pj_jmx.jar
- exception.jar
- logging.jar
- jmx.jar
- Following .jar files are required from \usr\sap\<SID>\DVEBMGS<InstanceNumber>\j2ee\j2eeclient:
- sapj2eeclient.jar
- Following .jar files are required from \usr\sap\<SID>\JC<InstanceNumber>\j2ee\admin\lib:
- For versions 7.3 and above:
- Following jars are required from \usr\sap\<SID>\<Instance Name>\j2ee\cluster\bin\ext\tc~jmx\lib\ and rename as below :
- sap.com~tc~bl~pj_jmx~Impl.jar → tcbl_pj_jmxImpl.jar
- sap.com~tc~exception~impl.jar → tc_exceptionImpl.jar
- sap.com~tc~je~clientlib~impl.jar → tc_jeclientlibImpl.jar
- sap.com~tc~je~leanClient.jar → tc_jeleanClient.jar
- sap.com~tc~logging~java~impl.jar → tc_logging_javaImpl.jar
- tc~bl~base~client.jar → tcbl_baseclient.jar
- tc~bl~deploy~client.jar → tcbl_deployclient.jar
- Following jars are required from \usr\sap\<SID>\<Instance Name>\j2ee\cluster\bin\ext\tc~jmx\lib\ and rename as below :
- For Versions below 7.3:
Find P4 Port:
50000+100*instance_number+20+n*5+port_index,
where,(n - Cluster elements
port index - Indicates p4 port [4])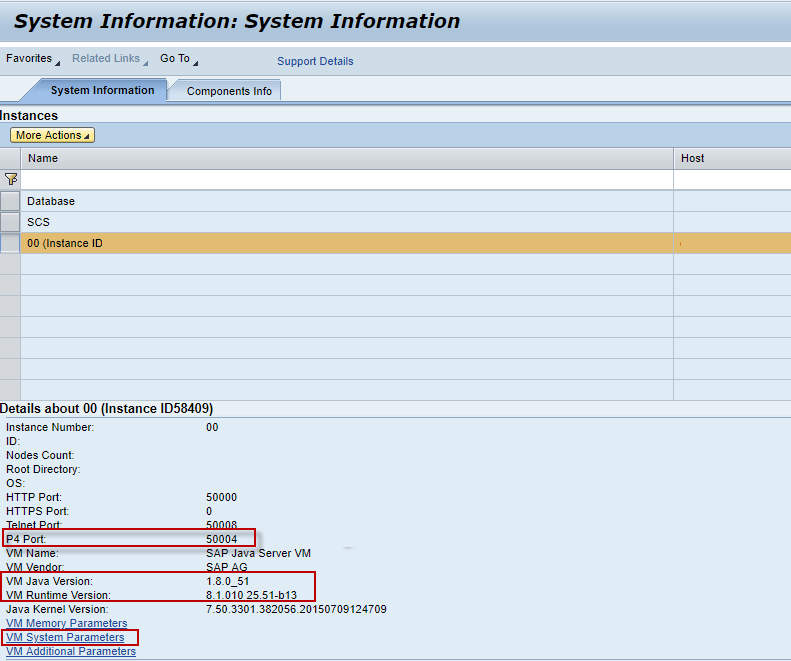
The port value is a number over 50000. For each cluster element, the ports begin with 50000+100*instance_number, where instance_number is a two digit number from 00 to 99 specifying the number of central instance and dialog instances.
- Click VM System Parameterslink and enable below :
- com.sun.management.jmxremote.port
- com.sun.management.jmxremote.ssl
- com.sun.management.jmxremote.authenticate
- SAP User Permissions
- Given below is the minimal set of SAP authorizations required to create and retrieve the necessary data from the monitor.
- You need to create a SAP role with one assigned action and then assign it to a SAP user:
- Type: UME
- Service / Application: tc~pi~monitor~perm
- Name: PI_PAYLOAD_MONI
- Alternatively, you can use the predefined SAP_XI_PCK_MONITOR role that contains the above-listed action.
- Click VM System Parameterslink and enable below :
Servers
Windows
Applications Manager supports monitoring of Windows servers using both WMI and SNMP modes. While both administrator and non-administrator user roles are supported, it is recommended to use administrator privileges for effective monitoring.
WMI Monitoring
- Ensure that PowerShell is launched with Administrator privileges.
- Run the following command to allow script execution required for proper data collection and process handling:
Set-ExecutionPolicy Unrestricted
SNMP Monitoring
- Ensure that the SNMP port is open and not blocked by a firewall.
- To monitor specific OIDs, the required MIB files must be obtained from the hardware vendor and loaded into Applications Manager.
- For example, for Dell devices, the corresponding MIBs and OIDs must be obtained from Dell.
Scheduled Tasks Monitoring
- Ensure that WMI access is enabled on the target remote server.
- Provide administrator-level user credentials to access and monitor scheduled tasks.
Print Queue Monitoring
- Ensure that WMI access is enabled on the target remote server.
Hardware Monitoring
Dell Servers
- Ensure that Dell OpenManage Server Administrator is installed and the SNMP agent is enabled.
- Use the following SNMP OID for monitoring: 1.3.6.1.4.1.674.10892.1.300.10.1.8.1
HP Servers
SNMP Mode
- Install HP Insight Management Agents.
- Use the following SNMP OID for monitoring: 1.3.6.1.4.1.232.2.2.2.1.0
WMI Mode
- Install HP Insight Management WBEM Providers.
- Ensure that HP System Insight Manager (SIM) version 6.2 or higher is installed and running.
Note:
- For troubleshooting WMI issues caused by disabled performance counters, refer to the troubleshooting KB.
- Applications Manager supports hardware monitoring for HP ProLiant Servers (Generations 1—9) using WMI/SNMP. Generation 10 and above are not supported.
Linux
Note: Unix server monitors can also be added using non-root user account in SSH, provided the following command packages are installed:
- ip - iproute/iproute2
- netstat - net-tools
- sar - sysstat
- iostat - sysstat
- vmstat - procps
- mpstat - sysstat
Prerequisites for monitoring Linux:
Edit the sudo configuration file using the following command:
sudo visudoAdd the following line to the end of the file:
<USERNAME>ALL= NOPASSWD: /bin/systemctl
Here, <USERNAME> refers to the username of the machine. For example:

Note: The above steps are unnecessary if the setup has been installed with ROOT user privilege. Ensure that the prerequisites are implemented correctly; otherwise, the setup might not start or stop properly.
The Serial number attribute is supported in SSH/Telnet mode for Linux servers. To retrieve the Serial number, use the following command:
dmidecode
If the dmidecode command is not installed on the Linux server, install it before proceeding. The command requires SUDO permissions. To enable these permissions, complete the following steps in the targeted Linux server:
- Log in to the Linux device, open command prompt, and assign read permissions to the specified directory to enable execution of the dmidecode executable file.
To set read-only permissions for the dmidecode files, use the following commands:
sudo chmod 444 /sys/firmware/dmi/tables/DMIsudo chmod 444 /sys/firmware/dmi/tables/smbios_entry_point
Note: In some Linux distributions, these files may not be available. If so, use root user account to retrieve the serial number.
Prerequisites for monitoring Cron jobs:
- Curl must be installed in the remote Linux machine.
- Script linked to the cron job must have executable permission.
- The machine where Applications Manager is installed should be reachable from the remote Linux machine via SSL port without any proxy server.
- The remote machine where the cron job is running must be synced with the correct time zone.
- Cron job interval should be a minimum of five minutes.
- Cron job uses HTTPs protocol to send responses to the machine where Applications Manager is installed and is validated using the admin user's Rest API key. If the admin user's API key is regenerated, then update the latest API key for all the cron job(s) on the remote Linux machine using the crontab -e command.
- Linux cron is supported only in SSH and TELNET mode of monitoring.
Prerequisites for monitoring NTP Stats:
- Ensure whether chrony / ntpstat are installed in the target servers. If not installed, then NTP stats monitoring will not be performed.
- Make sure to restart Applications Manager after installing chrony / ntpstat on the target server.
AIX
Edit the sudo configuration file using the following command:
sudo visudoAdd the following line to the end of the file:
<USERNAME>ALL= NOPASSWD: /usr/bin/startsrc, /usr/bin/stopsrc
Here, <USERNAME> refers to the username of the machine. For example:

Note: The above steps are unnecessary if the setup has been installed with ROOT user privilege. Ensure that the prerequisites are implemented correctly; otherwise, the setup might not start or stop properly.
IBM i
- To connect to IBM i server from Applications Manager, ensure that the ports mentioned under "Port Non-SSL" column in the link are not blocked in firewall. Also check out: https://www.ibm.com/support/pages/ports-must-be-open-make-odbc-data-transfer-ole-db-adonet-or-jdbc-connection-through-firewall
- It is recommended to use an account having a *QSECOFR permission on the server. If using the *QSECOFR user profile is not possible, then use an account of user class *USER with additional permissions as follows:
- The user should be permitted to access QMPGDATA/QPFRDATA(used to collect disk details) and QGPL(used to collect problem details) libraries and permitted to execute the command CRTPFRDTA and DSPPRB.
- Consider the following special authorities when you use an account of user class *USER such as *ALLOBJ, *SAVSYS , *JOBCTL, *SPLCTL to retrieve all data and perform IBM i admin actions from Applications Manager.
Windows Cluster
To monitor a Windows Cluster, use the Cluster Domain Administrator username and password, for which the user account should have the permission to execute WMI queries on root\mscluster namespace in cluster server nodes.
Firewall access for monitoring:
Following are the ports required for monitoring via WMI:
- Windows Management Instrumentation (WMI) (Default : TCP 445)
- Target server uses random port above 1024 by default to respond back for remote communication (DCOM) (Default : TCP 1025 to 1030)
Services
JMX Applications
To monitor a JMX Applications, the following java runtime options are to be added to your application
- Dcom.sun.management.jmxremote -Dcom.sun.management.jmxremote.port=1099
- Dcom.sun.management.jmxremote.ssl=false -Dcom.sun.management.jmxremote.local.only=false -Dcom.sun.management.jmxremote.authenticate=false
Replace 1099 with the actual port number of the agent
Example:
- To enable JMX Applications in JBoss:
- Edit the run.sh/bat under JBoss home/bin.
Append the following command to JAVA_OPTS,
JAVA_OPTS =-Dcom.sun.management.jmxremote -Dcom.sun.management.jmxremote.port=1099 -Dcom.sun.management.jmxremote.ssl=false -Dcom.sun.management.jmxremote.authenticate=false %JAVA_OPTS%
- Edit the run.sh/bat under JBoss home/bin.
- To enable JMX Applications in Tomcat:
- JAVA_OPTS =-Dcom.sun.management.jmxremote -Dcom.sun.management.jmxremote.port=1099 -Dcom.sun.management.jmxremote.ssl=false -Dcom.sun.management.jmxremote.authenticate=false %JAVA_OPTS%
- To enable SSL for JMX applications
- -Dcom.sun.management.jmxremote.ssl=true
- To enable authentication, use of authentication is recommended. If you do not want to use authentication, you should change the value to false.
- -Dcom.sun.management.jmxremote.authenticate=true
- If you are using authentication, specify the location of the password file
- -Dcom.sun.management.jmxremote.password.file=c:\jmxremote.password
- If you are using authentication, specify the location of the access file
- -Dcom.sun.management.jmxremote.access.file=c:\jmxremote.access
Refer Oracle documentation in this regard: http://docs.oracle.com/javase/1.5.0/docs/guide/management/agent.html#remote
Note: Refer to know more about monitoring a JMX Application if your application is behind a firewall. Also please note that the ping/telnet/nslookup should be working for the remote JMX:
telnet hostname port
ping hostname
ping IPAddress
nslookup hostname
nslookup IPAddress
Ceph Storage Monitor
Ceph status command is used to collect performance stats of Ceph Storage Monitor. The user given, should have read privileage to ceph.keyring file. Ensure the ceph.keyring file has appropriate permissions set (e.g., chmod 644) on your client machine.
Hadoop Monitor
1. To monitor Hadoop via REST API:
- No Authentication:
- URL http://<host>:<port>/jmx should be able to accessed from the Applications Manager machine for both Namenode and Jobtracker/ResourceManager
- Simple Authentication:
- URL http://<host>:<port>/jmx?user.name=<Hadoop host username> should be able to access from the Applications Manager machine for both Namenode and Jobtracker/ResourceManager
- SSL Enabled Hadoop:
- URL https://<host>:<port>/jmx?user.name=<Hadoop host username> should be able to access from the Applications Manager machine for both Namenode and ResourceManager
2. To monitor Hadoop via JMX:
- Add the following java runtime options to 'HADOOP_NAMENODE_OPTS'; 'HADOOP_JOBTRACKER_OPTS' in Hadoop-env.sh with unique port.
- -Dcom.sun.management.jmxremote.authenticate=false -Dcom.sun.management.jmxremote.ssl=false -Dcom.sun.management.jmxremote.port=8004
Apache Zookeeper
Prerequisites for monitoring Apache Zookeeper:
- Remote JMX should be enabled.
- To enable Remote JMX for Zookeeper in Linux Environments, please open the ZKServer file under bin folder and check whether the following requirements are satisfied:
- JMXPORT =<PORT NO>
- ZOOMAIN="-Djava.rmi.server.hostname=<IP address > -Dcom.sun.management.jmxremote -Dcom.sun.management.jmxremote.port=$JMXPORT -Dcom.sun.management.jmxremote.authenticate=$JMXAUTH -Dcom.sun.management.jmxremote.ssl=$JMXSSL -Dzookeeper.jmx.log4j.disable=$JMXLOG4J org.apache.zookeeper.server.quorum.QuorumPeerMain"
- For Windows Environments, the below given changes should be implemented in zkServer.bat file under bin folder:
- set JMXPORT=<PORT NO>
- set ZOOMAIN="-Dcom.sun.management.jmxremote" "-Dcom.sun.management.jmxremote.port=%JMXPORT%" "-Dcom.sun.management.jmxremote.ssl=false" "-Dcom.sun.management.jmxremote.authenticate=false" "org.apache.zookeeper.server.quorum.QuorumPeerMain"
Note:
- Replace <PORT NO> with any free Port Number ( Eg: JMXPORT=8078 ) and <IP address > with IP address of the machine.
- Please refer this link for troubleshooting the JMX Connectivity issues related to Apache Zookeeper Server or any other monitor that comes under the JMX Mode of monitoring.
Java/Transactions
Java Runtime Monitor
To monitor a JDK1.5 JVM and above, add the following JVM arguments to your application:
-Dcom.sun.management.jmxremote -Dcom.sun.management.jmxremote.port=1099 -Dcom.sun.management.jmxremote.ssl=false -Dcom.sun.management.jmxremote.authenticate=false -Djava.rmi.server.hostname=<IP Address>
To monitor IBM JDK1.5 JVM and above, add the following JVM arguments to your application:
-Djavax.management.builder.initial= -Dcom.sun.management.jmxremote -Dcom.sun.management.jmxremote.port=1099 -Dcom.sun.management.jmxremote.ssl=false -Dcom.sun.management.jmxremote.authenticate=false -Djava.rmi.server.hostname=<IP Address>
Note: Port number '1099' can be replaced with the actual port number of the JMX agent.
- To enable Java Runtime Monitor in JBoss:
- Edit the run.sh/bat under JBoss home/bin. Append the following command to JAVA_OPTS
JAVA_OPTS =-Dcom.sun.management.jmxremote -Dcom.sun.management.jmxremote.port=1099 -Dcom.sun.management.jmxremote.ssl=false -Dcom.sun.management.jmxremote.authenticate=false %JAVA_OPTS%-Djava.rmi.server.hostname=<IP Address>
- Edit the run.sh/bat under JBoss home/bin. Append the following command to JAVA_OPTS
- To enable Java Runtime Monitor in JBoss 7 and above:
- Copy the jboss-client.jar from <JBoss Home>/bin/client/ and place it under <Applications Manager Home>/working/classes/jboss/as7 directory.
- To enable Java Runtime Monitor in Tomcat do the following:
- Edit the catalina.sh/bat under Tomcat home/bin. Append the following command to JAVA_OPTS
JAVA_OPTS =-Dcom.sun.management.jmxremote -Dcom.sun.management.jmxremote.port=1099 -Dcom.sun.management.jmxremote.ssl=false -Dcom.sun.management.jmxremote.authenticate=false %JAVA_OPTS%-Djava.rmi.server.hostname=<IP Address>
- Edit the catalina.sh/bat under Tomcat home/bin. Append the following command to JAVA_OPTS
- To enable SSL over JMX, use the following JMX parameters in addition to the above, and restart the server.
- JMX Parameters:
-Dcom.sun.management.jmxremote.ssl=true
-Djavax.net.ssl.keyStore="E:/APMBuilds/certificates/jmx.keystore"
-Djavax.net.ssl.keyStorePassword=password
-Djavax.net.ssl.trustStore="E:/APMBuilds/certificates/jmx.truststore"
-Djavax.net.ssl.trustStorePassword=password Additionally, import the server certificate to "<Applications Manager Home>\working\jre\lib\security\cacerts" file and restart the server.
Syntax:
keytool -import -alias <certificat_aliasname> -file <target Application server Certificate> -keystore "<Applications Manager Home>\working\jre\lib\security\cacerts" -storepass changeit -nopromptExample:
keytool -import -alias jmxcert -file "E:\APMBuilds\certificates\ssloverjmx.cer" -keystore "C:\Program Files (x86)\AppManager14\working\jre\lib\security\cacerts" -storepass changeit -noprompt
- JMX Parameters:
In the Tomcat Environment:
Make sure the catalina-jmx-remote.jar file is present in the $TOMCAT_HOME/lib location. This jar file can be downloaded for your version of Tomcat from the Apache website from the extras section (sample link: http://archive.apache.org/dist/tomcat/tomcat-7/v7.0.55/bin/extras/catalina-jmx-remote.jar).
Enable JMX in WebLogic
- Open the startWebLogic.bat file in a text editor.
- Find the JAVA_OPTS line and add the following:
-Dcom.sun.management.jmxremote
-Dcom.sun.management.jmxremote.port=8888
-Dcom.sun.management.jmxremote.authenticate=false
-Dcom.sun.management.jmxremote.ssl=false
-Djava.rmi.server.hostname=<IP Address> - Restart WebLogic.
Active Directory
- Prerequisites for monitoring Active Directory metrics
- Using CredSSP Authentication for Active Directory monitoring
Prerequisites for monitoring Active Directory metrics
To monitor an Active Directory Service, the user must have "Administrator" privileges. To add an Active Directory Service, follow the below given steps:
- Install the latest .NET Framework on your Applications Manager machine.
Install/enable .NET Framework 3.5 on Applications Manager installed machine: (This needs to be done even if you have installed the latest version. To know more click here.)
- To know how to enable .NET 3.5 in Windows Server 2008, click here.
- To know how you can enable .NET 3.5 in other Windows Servers, click here.
Note: The .NET Framework 3.5 prerequisite applies only to Applications Manager versions up to 173100.
- Grant access to the following list of ports on the firewall for Active Directory monitoring:
- Windows Management Instrumentation (WMI) (Default : TCP 445)
- Remote Procedure Call (RPC) (Default :TCP 135)
- Target server uses random port above 1024 by default to respond back for remote communication (DCOM) (Default : TCP 1025 to 1030)
- PowerShell Remoting (Default: TCP 5985 and 5986)
- To monitor using Powershell, check whether both machines have PowerShell v5.1 installed. Make sure the proper steps are followed to enable Powershell remoting.
Note:
- It is also possible for a non-admin user to monitor Active Directory, except that some of the data may not be available for monitoring (Some Diagnostic Tests fetched using dcdiag command which involve querying Active Directory objects, replication status, security descriptors, and reading/writing system logs require administrator priviledges).
- If you want to monitor as a non-admin user, follow the steps mentioned in this link.
Using CredSSP Authentication for Active Directory monitoring
Istio
- Istio metrics are collected via kubectl, istioctl, curl, grep commands, so all the CLI tools mentioned should be installed on that machine where Istio is installed.
- Mesh traffic metrics collected by prometheus as running with ClusterIP, so prometheus should be deployed with Istio.
Network Policy Server (Radius Server)
To monitor Network Policy Server (Radius Server), the user must have "Administrator" privileges. To add an Network Policy Server (Radius Server), follow the below given steps:
- Install the latest .NET Framework on your Applications Manager machine.
Install/enable .NET Framework 3.5 on Applications Manager installed machine: (This needs to be done even if you have installed the latest version. To know more, click here.)
- To know how to enable .NET 3.5 in Windows Server 2008, click here.
- To know how you can enable .NET 3.5 in other Windows Servers, click here.
Note: The .NET Framework 3.5 prerequisite applies only to Applications Manager versions up to 173100.
- Firewall access for monitoring:Following are the list of ports required for monitoring:
- Windows Management Instrumentation (WMI) (Default : TCP 445)
- Remote Procedure Call (RPC) (Default :TCP 135)
- Target server uses random port above 1024 by default to respond back for remote communication (DCOM) (Default : TCP 1025 to 1030)
Note: If you want to monitor as a non-admin user, follow the steps mentioned in this link.
LDAP Server
Following are the list of LDAP-specific fields that need to be entered while adding the LDAP monitor:
- LDAP Server and LDAP Server Port: Provide the host and port of the server where the service is running.
UserName and Password:UserName will the DN of the LDAP server. A Distinguished Name (DN) uniquely identifies an entry and describes its position in the Directory Information Tree (DIT). DN and password can be collected form the LDAP administrator.
Example DN:cn=Manager,dc=example,dc=comNote: Username and password are needed only if the authentication is enabled.
- Search Base: Search Base denotes the location in the directory where the search for a particular directory object begins. Entries greater than this level in the tree will be searched. Search base can be obtained by logging into Active directory or from the LDAP administrator.
Example: ou=group,dc=example,dc=com - Search Filter: Search Filter is a basic LDAP Query for searching users based on mapping of username to a particular LDAP attribute. We need to use a search filter which uses the attributes specific to your LDAP environment. You can confirm this from your LDAP administrator.
Example: cn=James - Matching Attribute: It is used to set the attribute that is to be fetched from the search operation. The attribute value fetched will be used to compare the result of the search operation with the search result provided based on the filter condition provided.
Allowed options: CN, UID, SN, DisplayName, Givenname, ObjectClass, DC, OU, DirXML-State
Learn more about the definition of the attributes - Filter Condition: The condition used to compare the matching attribute value and the search result provided.
Allowed conditions: Equals, Contains, NotEquals - Search Result: It will be the expected result of the matching attribute value of search operation. Based on the filter condition provided, it will be compared with the matching attribute value got from search operation.
Apache Spark
The Apache Spark host and port should be accessible from the machine where Applications Manager server is running. Make sure that the required credentials are provided while adding the monitor.
Mail Servers
Exchange Server
Monitoring of Exchange Server is possible only if Applications Manager is running in a Windows System. Exchange Monitoring supports two Modes of Monitoring.
- Using WMI - If WMI is enabled in the remote machine in which Exchange Server is running. Refer to the WMI Prerequisites.
- Using Windows PowerShell technology - To use Powershell for data collection, make sure the proper steps have been followed to enable and use remote commands in Windows PowerShell both in the Applications Manager server and the remote server.
Ports required for monitoring:
- Windows Management Instrumentation (WMI) (default : 445)
- Remote Procedure Call (RPC) (default : 135)
- PowerShell remoting - TCP 5985 and 5986
- Exchange PowerShell session - TCP 80 and 443
Note: It is also possible for a non-admin user to monitor Exchange Server, except that some of the data may not be available for monitoring. If you want to monitor as a non-admin user, follow the steps mentioned in this link.
Creating User Accounts, adding users and assigning roles
User Account Used for Monitoring:
The User Account used to add the monitor should be a member of View-Only Organization Management group. Make sure that the group has the following Roles assigned - Mailbox Search & Monitoring.
For Exchange View-Only Administrators:
This role allows read access only to Exchange organization container and containers with Exchange recipients in AD. They can verify settings, but can not change or add any settings. Only Powershell "Get-<cmdlet>" can be executed.
Adding Users and Assigning Roles
Adding Users to the View-Only Organization Management group and assigning roles in:
- Exchange 2010 / 2013 / 2016 / 2019
- Open Exchange Management Console in the Exchange Server.
To check if the user is already under View-Only Organization Management role group:
Get-RoleGroupMember "View-Only Organization Management" | where-object {$_.Name -eq "<Username>"}
If the user is not under the specified role group, execute the below cmdlet to add the user:
Add-RoleGroupMember "View-Only Organization Management" -Member <Username>
Next, add the two roles for View-Only Organization Management role group:
New-ManagementRoleAssignment -SecurityGroup "View-Only Organization Management" -Role "Monitoring"
New-ManagementRoleAssignment -SecurityGroup "View-Only Organization Management" -Role "Mailbox Search"
- Exchange 2007:
- Open Exchange Management Shell.
Execute the following cmdlet:
Add-ExchangeAdministrator —Identity <Username> —Role ViewOnlyAdmin
Enabling CredSSP authentication
Configuring ConnectionURI for Powershell Remoting
The ConnectionURI is used to establish a connection to a remote computer using the URI address of the related HTTP or HTTPS endpoint. These connections are made over TCP port 80 for HTTP and TCP port 443 for HTTPS. By default, the connection URI is of the form http://<Hostname/IPaddress>/powershell and uses Kerberos authentication.
- With Kerberos Authentication: When the machine running Exchange Server is joined to the same domain as the machine running Applications Manager, either HTTP or HTTPS can be used with Kerberos Authentication.
- If Kerberos Authentication is not supported, or the machine is in another domain, the other option is to configure Basic Authentication for powershell virtual directory. To configure basic authentication in Exchange Server 2019, 2016, 2013, 2010, or 2007 using IIS Manager:
- Open IIS Manager.
- In the Connections pane, expand Default Web Site, and then click PowerShell.
- Click Authentication in the results pane and enable Basic Authentication.
Note: If you decide to use Basic Authentication, HTTPS should be used as the mode of connection for ConnectionURI. If the ConnectionURI should be customized, it can be done by clicking the "Customize ConnectionURI" option in the new monitor page. To provide a different port for the ConnectionURI, use the format:
<https://<hostname>/Powershell:<portnumber> (or) <http://<hostname>/Powershell:<portnumber>
For Example:http://win-exchange13/Powershell:4444
Middleware/Portal
IBM WebSphere MQ
To monitor IBM Websphere MQ Series, the following jar files must be added to the respective locations:
| For IBM Websphere MQ Series version | Jar files to be added | Location in Websphere MQ | Location in Applications Manager |
| Version 8 and above |
(OR)
| All the jar files can be found under <Websphere MQ Home Directory>\Java\lib directory. | Copy the jar files to <ProductHome>\working\jre\lib\ext directory. |
| For APM versions 177300 and above, copy the jar files to <ProductHome>\working\classes\websphereMQ directory. | |||
| Version 7 |
| All the jar files can be found under <Websphere MQ Home Directory>\Java\lib directory. | Copy the jar files to <ProductHome>\working\jre\lib\ext directory. |
| For APM versions 177300 and above, copy the jar files to <ProductHome>\working\classes\websphereMQ directory. | |||
| Version 5.x/6.x |
| The jar files can be found under <Websphere MQ Home Directory>\Java\lib directory. | Copy the jar files to <ProductHome>\working\jre\lib\ext directory. |
| For APM versions 177300 and above, copy the jar files to <ProductHome>\working\classes\websphereMQ directory. |
Note: The username & password length should be less than or equal to 12.
To monitor Queue statistics, make sure MONQ value is set to MEDIUM or HIGH for all queues. You can check the current MONQ status using
DISPLAY QSTATUS(Q1)
To modify,
ALTER QL(Q1) MONQ(MEDIUM)
where Q1 is the queue.
To monitor Channel statistics, make sure MONCHL value is set to MEDIUM or HIGH for all channels. You can check the current MONCHL status using
DISPLAY CHANNEL(QM1.TO.QM2)
To modify,
ALTER CHL(QM1.TO.QM2) CHLTYPE(SDR) MONCHL(MEDIUM)
where QM1.TO.QM2 is the channel name and SDR is its type.
IBM WebSphere Message Broker
To discover Message Broker, the following jars are required:
- ConfigManagerProxy.jar located at <Broker Home Directory> \classes directory.
- ibmjsseprovider2.jar located at <Broker Home Directory>\jre\lib directory.
Copy the two jar files to <AppManager Installation>\working\jre\lib\ext directory.
Note: Copy these jar files to <JavaHome>\jre\lib\ext directory if external JDK is configured for AppManager. Restart Applications Manager and try adding the monitor.
For IBM Integration Bus(MessageBroker 10.x):
- The following jars are required to monitor IIB:
IntegrationAPI.jar
jetty-io.jar
jetty-util.jar
websocket-api.jar
websocket-client.jar
websocket-common.jar - IntegrationAPI.jar located at <Broker Home Directory>\common\classes directory.
- jetty-io.jar, jetty-util.jar, websocket-api.jar, websocket-client.jar, websocket-common.jar located at <Broker Home Directory>\common\jetty\lib directory.
- Copy the jar files to <ProductHome>\working\jre\lib\ext directory.
Note: Copy these jar files to <JavaHome>\jre\lib\ext directory if external JDK is configured for AppManager. Restart Applications Manager and try adding the monitor.
WebLogic Integration Server
Note: WebLogic Integration Server needs some additional configuration and conditions to be followed for monitoring.
- For monitoring WebLogic Integration Server 8.x, you should set the weblogic.disableMBeanAuthorization andweblogic.management.anonymousAdminLookup system variable to true for enabling data collection.
- Follow the steps given below:
- Edit startWLS.cmd\sh present in the <WLS_HOME>/server/bin directory and add the following argument -Dweblogic.disableMBeanAuthorization=true and -Dweblogic.management.anonymousAdminLookupEnabled=true (click on the link to view the sample startWLS.cmd\sh file)
- Restart the WebLogic Integration Server for the changes to take effect.
- Copy weblogic.jar from folder /weblogic81/server/lib in Remote WebLogic server version 8 and place it under <AppManager Home >\working\classes\weblogic\version8 folder in the machine where Applications Manager is running.
MS Office SharePoint Server
To monitor MS Office SharePoint Server, the user must have Administrator privileges. Monitoring can be performed using either WMI mode or PowerShell mode, based on your SharePoint environment.
WMI Mode
Using WMI mode, SharePoint Standalone Server can be monitored. To use WMI mode for data collection, refer to the WMI Prerequisites page.
Note:Non-admin users can monitor the SharePoint server with limited access. For configuration steps, refer to this link.
PowerShell Mode
Using PowerShell mode, SharePoint Standalone Servers can be monitored, and SharePoint Servers in a Farm can be discovered and monitored. To use PowerShell mode for data collection, ensure PowerShell remoting is properly configured.
If the SharePoint Standalone Server is part of a Farm or if you want to discover SharePoint Servers in a Farm, follow the steps given below:
Enable CredSSP Authentication:
CredSSP Authentication might be required to fetch data from multiple servers in the SharePoint Farm. Enable the Use CredSSP Authentication option and follow the CredSSP configuration prerequisites.
- Add the monitoring user to the following groups in Server Manager:
- Remote Desktop Users
- WinRMRemoteWMIUsers__
- WSS_ADMIN_WPG
Open the SharePoint Management Shell as Administrator and execute:
winrm set winrm/config/winrs '@{MaxShellsPerUser="25"}'winrm set winrm/config/winrs '@{MaxMemoryPerShellMB="600"}'Get-SPShellAdminGet-SPDatabase | Add-SPShellAdmin DOMAIN\UserNameGet-SPShellAdminSet-PSSessionConfiguration -Name Microsoft.PowerShell32 —ShowSecurityDescriptorUI
To verify the prerequisites, open PowerShell as Administrator in the Applications Manager installed server and run the following commands (Enter the credentials when prompted).
$cred = Get-Credential$s = New-PSSession "SharePointServerName" -Authentication CredSSP -Credential $credInvoke-Command -Session $s -ScriptBlock {Add-PSSnapin Microsoft.SharePoint.PowerShell;}Invoke-Command -Session $s -ScriptBlock {Get-SPContentDatabase}Invoke-Command -Session $s -ScriptBlock {Get-SPServiceInstance}Enter-PSSession -Session $sExit-PSSession
If permission errors occur while running the above commands, troubleshoot accordingly.
Note: For issues related to Add-SPShellAdmin, refer to this link.
Microsoft Message Queue (MSMQ) Server
Below are the prerequisites for monitoring MSMQ server in Applications Manager:
- WMI Mode: WMI access to remote server is required.
- PowerShell Mode: PowerShell remoting should be enabled. For more information, check enable and use remote commands in Windows PowerShell.
To monitor Microsoft Message Queue (MSMQ) Server, the user must have Administrator privileges. To monitor the Microsoft Message Queue (MSMQ) Server, follow the below given steps:
- Install the latest .NET Framework on your Applications Manager machine.
Install/enable .NET Framework 3.5 on Applications Manager installed machine: (This needs to be done even if you have installed the latest version. To know more click here.)
- To know how to enable .NET 3.5 in Windows Server 2008, click here.
- To know how you can enable .NET 3.5 in other Windows Servers, click here.
Note: The .NET Framework 3.5 prerequisite applies only to Applications Manager versions up to 173100.
- Grant access to the following list of ports on the firewall for Microsoft Message Queue (MSMQ) server monitoring:
- Windows Management Instrumentation (WMI) (Default : TCP 445)
- Remote Procedure Call (RPC) (Default :TCP 135)
- Target server uses random port above 1024 by default to respond back for remote communication (DCOM) (Default : TCP 1025 to 1030)
To use Powershell for data collection, make sure the proper steps have been followed to enable Powershell remoting.
Note: If you want to monitor as a non-admin user, follow the steps mentioned in this link.
Microsoft BizTalk Monitoring
To monitor a Microsoft BizTalk Server, the user must have Administrator privileges. To monitor the Microsoft Message Queue (MSMQ) Server, follow the below given steps:
- Install the latest .NET Framework on your Applications Manager machine.
Install/enable .NET Framework 3.5 on Applications Manager installed machine: (This needs to be done even if you have installed the latest version. To know more click here.)
- To know how to enable .NET 3.5 in Windows Server 2008, click here.
- To know how you can enable .NET 3.5 in other Windows Servers, click here.
Note: The .NET Framework 3.5 prerequisite applies only to Applications Manager versions up to 173100.
- Firewall access for monitoring:Following are the list of ports required for monitoring:
- Windows Management Instrumentation (WMI) (Default : TCP 445)
- Remote Procedure Call (RPC) (Default :TCP 135)
- Target server uses random port above 1024 by default to respond back for remote communication (DCOM) (Default : TCP 1025 to 1030)
Note: It is also possible for a non-admin user to monitor Microsoft Biztalk server, except that some of the data may not be available for monitoring. If you want to monitor as a non-admin user, follow the steps mentioned in this link.
To use Powershell for data collection, make sure the proper steps have been followed to enable Powershell remoting.
Enabling Credential Delegation for Biztalk server
If the Biztalk Management Database is on a different server from that where Applications Manager is running, the credentials of the Biztalk Server should be delegated for data collection to happen (Delegation is disabled by default). Refer to know more about Enabling CredSSP Authentication.
Microsoft Skype for Business Server
To monitor a Microsoft Skype for Business Server, the user must have Administrator privileges. To monitor the Microsoft Skype for Business Server, follow the below given steps:
- Install the latest .NET Framework on your Applications Manager machine.
Install/enable .NET Framework 3.5 on Applications Manager installed machine: (This needs to be done even if you have installed the latest version. To know more click here.)
- To know how to enable .NET 3.5 in Windows Server 2008, click here.
- To know how you can enable .NET 3.5 in other Windows Servers, click here.
Note: The .NET Framework 3.5 prerequisite applies only to Applications Manager versions up to 173100.
- Firewall access for monitoring:Following are the list of ports required for monitoring:
- Windows Management Instrumentation (WMI) (Default : TCP 445)
- Remote Procedure Call (RPC) (Default :TCP 135)
- Target server uses random port above 1024 by default to respond back for remote communication (DCOM) (Default : TCP 1025 to 1030)
Note: If you want to monitor as a non-admin user, follow the steps mentioned in this link.
Azure Service Bus
To add an Azure Service Bus Namespace in Applications Manager, a .pfx file (which contains the cryptographic information of private keys) of the certificate uploaded in Azure Management certificates is required.
In the console, execute the script <APM_HOME>/bin/exportCertificateToAppManager.sh/bat file to export the managed certificate of your account to Applications Manager.
To know more about creating certificates and uploading in Windows Azure portal, click here.
Example: <APM_HOME>/bin/exportCertificateToAppManager.bat [testCertificate.pfx] [password]
Apache ActiveMQ
Using JMX to monitor Apache ActiveMQ
Apache ActiveMQ has extensive support for JMX to allow you to monitor and control the behavior of the broker via the JMX MBeans.
You can enable/disable Remote JMX support as follows:
For Windows
In Service Mode: Add the following entries in wrapper.conf file.
<ActiveMQHome>/bin/win64/wrapper.conf (if 64-bit)
<ActiveMQHome>/bin/win32/wrapper.conf (if 32-bit)wrapper.java.additional.13=-Dcom.sun.management.jmxremotewrapper.java.additional.14=-Dcom.sun.management.jmxremote.port=1099wrapper.java.additional.15=-Dcom.sun.management.jmxremote.authenticate=falsewrapper.java.additional.16=-Dcom.sun.management.jmxremote.ssl=falsewrapper.java.additional.17=-Djava.rmi.server.hostname=<HOSTNAME>In Non-Service Mode: Add the following lines in apachemq.bat file (located under <ActiveMQHome>/bin/ directory) before ACTIVEMQ_CLASSPATHis set.
set ACTIVEMQ_SUNJMX_START=-Dcom.sun.management.jmxremote -Dcom.sun.management.jmxremote.port=1099 -Dcom.sun.management.jmxremote.ssl=false -Dcom.sun.management.jmxremote.authenticate=false -Djava.rmi.server.hostname=<HOSTNAME>
Replace <HOSTNAME> with hostname/IP of ActiveMQ-installed machine.
For Linux
Add the following lines in apachemq.sh file (located under <ActiveMQHome>/bin/ directory) under invoke_start() function:
ACTIVEMQ_SUNJMX_START="-Dcom.sun.management.jmxremote -Dcom.sun.management.jmxremote.port=1099 -Dcom.sun.management.jmxremote.ssl=false -Dcom.sun.management.jmxremote.authenticate=false -Djava.rmi.server.hostname=<HOSTNAME>"
Replace <HOSTNAME> with hostname/IP of ActiveMQ-installed machine.
Apache Kafka
Using JMX to monitor Apache Kafka
To enable JMX monitoring, set the JMX_PORT environment variable in the kafka-run-class.sh/kafka-run-class.bat file or use the standard Java system properties. Alternatively, you can set the KAFKA_JMX_OPTS environment variable in the kafka-run-class.sh/kafka-run-class.bat file to enable JMX monitoring in Applications Manager. The default JMX port is 9999.
For more information on configuring JMX, click here.
RabbitMQ
To monitor RabbitMQ in Applications Manager, the Management plugin has to be enabled in the RabbitMQ server. Kindly execute the following command under <RABBITMQ_HOME>/sbin to enable the Management plugin in the target RabbitMQ server:
rabbitmq-plugins enable rabbitmq_management
After enabling the Management plugin, check if the following URL is accessible from Applications Manager installed machine:
http://<Hostname>:<port>
where,
- Hostname: Hostname of the host in which the RabbitMQ server is present.
- Port: The port number of the Management plugin in the RabbitMQ server (Default value: 15672)
For more information on the Management plugin, kindly refer to this link.
Virtualization
VMware Horizon View Connection Broker
- For VMware Horizon versions 7.x to 7.12, VMware Horizon View Connection Broker monitor uses Windows PowerShell for monitoring. Follow these steps to enable Windows PowerShell Remoting in the Applications Manager server and the remotely monitored Horizon View server:
- Enable and Use Remote Commands in Windows PowerShell
- Horizon View's Domain Server and its components should be accessible (able to ping) from the Applications Manager server.
- For VMware Horizon versions 7.13 and above, VMware PowerCLI is required for monitoring. Learn how to setup VMware PowerCLI
Docker
Since Docker and Docker Container metrics are collected via their REST APIs, it is necessary to enable Docker's REST API to add a Docker Monitor. To enable Docker's remote API on Docker host, follow the steps mentioned in this link.
VMware ESXi / vCenter
Following are the prerequisites for monitoring VMware ESXi servers / vCenter Virtual Infrastructure:
- The host server should be reachable from Applications Manager-installed machine.
- The user should have the Administrator privileges.
Note: In order to add VMWare ESX/ESXi servers for monitoring, we recommend to use the root account. However, in case you are unable to use the root account, you can use a view-onlyprofile to add the servers. This profile has enough rights to be used for monitoring. The user you create must be:
- a member of the group user
- based on the profile 'read only'
Citrix Hypervisor
- The host server URL should be reachable from Applications Manager-installed machine.
- The user should have the Administrator privileges.
KVM
- The KVM host should be reachable via SSH or Telnet from the machine where Applications Manager is installed.
- Ensure the libvirt package is installed on the KVM host.
- Root user privileges must be enabled on the KVM host. This is essential for performing VM start/stop operations from Applications Manager.
- Install the balloon driver on Windows virtual machines to enable memory statistics collection.
- Install qemu-agent on virtual machines to retrieve their IP addresses.
Microsoft Hyper-V Server
Applications Manager makes use of WMI mode to monitor Hyper-V servers. Following are the prerequisites for monitoring Hyper-V servers:
- The host server should be reachable from Applications Manager-installed machine.
- The WMI should be enabled and all its services should be in running state.
- The user should have the Administrator privileges for VM monitoring.
- The user should have privileges for the namespace WMI root\virtualization\v2.
Oracle VM Manager Servers
- The host server URL should be reachable from Applications Manager-installed machine.
- The user should have the Administrator privileges.
Red Hat Virtualization (RHV)
- The host server URL should be reachable from Applications Manager-installed machine with FQDN.
- The user should have the Administrator privileges.
Veeam Enterprise Manager
- Ensure that the Veeam Enterprise Manager host server is reachable from the machine where Applications Manager is installed.
- Verify that the Veeam REST API service port is open and accessible for communication. To check the REST API port:
- Log in to the Veeam Enterprise Manager console.
- Navigate to Configuration → About.
- Under the Veeam REST API Service section, you can find the HTTPS port number used for communication.
Web Server / Services
IIS Server
To add an IIS monitor
- URL for IIS server (http(s)://[Host/IP]:[PORT]) should be accessible from Applications Manager-installed server as we check for the Server header in the response.
- Monitoring IIS Website and Application Pool statistics:
- For Applications Manager versions till 15110, we use the relevant server monitor credential to fetch data from the remote server. So adding Server monitor is mandatory to fetch IIS Website and Application Pool statistics.
- From Applications Manager versions 15120 onwards, IIS server credential should be provided while adding/editing the IIS monitor itself. This is mandatory to monitor Website and Application Pool statistics.
- Mode of Monitoring: Users can choose between two different modes of monitoring - WMI and WinRM:
- WMI: WMI access to remote server is required. Following are the list of ports that are required for monitoring through WMI:
- Windows Management Instrumentation (WMI) (Default : TCP 445)
- Remote Procedure Call (RPC) (Default : TCP 135)
- For remote communication (DCOM), target server uses random port above 1024 by default to respond. (Default : TCP 1025 to 1030)
WinRM: Refer to this page to understand the prerequisites to WinRM mode of monitoring.
Note: WinRM mode is only supported in Applications Manager versions 16820 and above.
- WMI: WMI access to remote server is required. Following are the list of ports that are required for monitoring through WMI:
To collect IIS Website Statistics
User must have the permission to execute WMI queries on 'root\CIMV2' namespace of the IIS Server.
To collect IIS Application Pools Statistics
For Applications Manager versions till 15110, user must have the permission to access 'root\MicrosoftIISv2' and 'root\WebAdministration' WMI namespaces.
From Applications Manager versions 15120 onwards, user must have permission to access 'root\WebAdministration' WMI namespace alone.
- For 'root\WebAdministration' namespace: Install the IIS WMI provider by selecting the IIS Management Scripts and Tools component under Management Tools (or Web Management Tools).
- For 'root\MicrosoftIISv2' namespace: To enable IIS v6 Management Compatibility tools, follow steps 3 & 4 as mentioned in this link.
Note: User account with Administrator permissions is mandatory for monitoring Application Pool Statistics.
Troubleshooting: In case you encounter with issues in IIS server monitoring, refer here.
PHP
Place the phpstats.php file in the webserver's document root. The phpstats.php can be found in <Applications Manager Home>/working/resources directory.
Apache
Enabling the Server status and the Extended-status will give additional information for the Apache server.
To enable the Server Status, follow the steps given below:
- In Apache's httpd.conf file, locate Location /server-status tag.
- Remove the comment in the Location/Server-status tag to enable SetHandler server-status.
- Change the attribute Deny from all to Allow from all.
- Remove the comment in LoadModule status_module modules/mod_status.so.
- Save the conf file and restart the Apache Server.
To enable the Extended-status, follow the steps given below:
- Locate ExtendedStatus attribute in httpd.conf file.
- Remove the comment to enable the status.
- Save the conf file and restart the Apache Server.
Note: Making the above changes will open the /server-status handler with no restrictions. To restrict access to the Applications Manager, make the following changes to the configuration file:
<Location /server-status>
SetHandler server-status
Required host <hostname_of_apm_installed_machine>
Required ip <ip_of_apm_installed_machine>
</Location>
HAProxy
- Open the 'stats' port for collecting the metrics.
To enable metrics collection, add the following content at the bottom of the file /etc/haproxy/haproxy.cfg:
For HAProxy version 1.9 and below
listen stats :9000mode httpstats enablestats hide-versionstats realm Haproxy\ Statisticsstats uri /stats auth Username:Password
For HAProxy version 2.0 and above
listen statsbind :9000mode httpstats enablestats hide-versionstats realm Haproxy\ Statisticsstats uri /stats auth Username:Password- Restart the HAProxy instance. This will open up the stats in the port '9000' (we have specified 9000 as the port in this configuration). You can further add the same HAProxy for monitoring using the hostname and port.
Note:
The default configuration exposes the stats page without restrictions. To restrict access only to the Applications Manager server, use the configuration below:
listen statsbind :9000mode httpstats enablestats hide-versionstats realm Haproxy\ Statisticsstats uri /stats auth Username:Passwordacl allowed_ip src <ip_of_apm_installed_machine>http-request deny if !allowed_ip- You can change the port (9000 by default) to any free port that you wish to use.
- The line number 7 is for setting up basic authentication for this stats url. Users can provide their own username and password.
- We use the following URL to collect metrics: http://[HOSTNAME]:[PORT]/;csv
(Replace [HOSTNAME] and [PORT] with the respective hostname of the HAProxy instance and port which is mentioned in the above configuration)
IBM HTTP Server
Open <IBM_HOME>HTTPServer/conf/httpd.conf and uncomment the following line to enable the mod_status.co module in the target IBM HTTP server:
LoadModule status_module modules/mod_status.soTo add/modify the access handler for the /server-status page add the following lines to the configuration file, and if already present modify it to following context:
<Location /server-status>SetHandler server-statusRequire all granted</Location>Note: Making the above changes will open the /server-status handler with no restrictions. To restrict access to the Applications Manager, make the following changes to the configuration file:
<Location /server-status>
SetHandler server-status
Required host <hostname_of_apm_installed_machine>
Required ip <ip_of_apm_installed_machine>
</Location>
- Enabling the ExtendedStatus is mandatory for monitoring metrics such as requests per second, bytes per second, bytes per request, etc. If the ExtendedStatus has not been enabled, follow the steps given below:
- Locate the line that starts with ExtendedStatus in the configuration file.
- Uncomment the line and set the status to 'On'.
Restart the target IBM HTTP server after performing the above-mentioned steps and check if the URL given below is accessible from the Applications Manager installed machine,
http://<hostname>:<port>/server-status
Oracle HTTP Server
Open <ORACLE_HOME>/user_projects/domains/<domain_name>/config/fmwconfig/components/OHS/<server_component_name>/httpd.conf and uncomment the following line to enable the mod_status.co module in the target Oracle HTTP server:
LoadModule status_module "${PRODUCT_HOME}/modules/mod_status.so"To add/modify the access handler for the /server-status page add the following lines to the configuration file, and if already present modify it according to the following context:
<Location /server-status>SetHandler server-statusRequire all granted</Location>Note: Making the above changes will open the /server-status handler with no restrictions. To restrict access to the Applications Manager, make the following changes to the configuration file:
<Location /server-status>
SetHandler server-status
Required host <hostname_of_apm_installed_machine>
Required ip <ip_of_apm_installed_machine>
</Location>
- Enabling the ExtendedStatus is mandatory for monitoring metrics such as Requests per second, Bytes per second, Bytes per request, etc. If the ExtendedStatus has not been enabled, follow the steps given below:
- Locate the line that starts with ExtendedStatus in the configuration file.
- Uncomment the line and set the status to "On".
Restart the target Oracle HTTP server after performing the above-mentioned steps and check if the URL given below is accessible from the Applications Manager installed machine.
http://<hostname>:<port>/server-status
NGINX
To enable the NGINX status, follow the steps below:
- Configure the /server_status location block in the nginx.conf file located under <NGINX_HOME>/conf/ to enable server_status.
- Ensure that the value of the stub_status directive is set to on.
- Update the access control rule by changing deny all to allow all.
- Save the configuration file and restart the NGINX.
Note: Making the above changes will open the /nginx_status handler with no restrictions. To restrict access only to the Applications Manager, make the following changes to the configuration:
location /nginx_status {
stub_status on;
access_logs off;
allow <ip_of_apm_installed_machine>;
deny all;
}
NGINX Plus
Make sure that the location is defined with the ngx_http_api_module configured for your NGINX Plus server. Learn how to configure the API
Real Browser Monitoring (RBM)
RBM requires network connectivity between the End User Monitoring (EUM) agent and the Applications Manager server. This network connectivity can be ensured with the help of the VPN or NAT or by assigning an direct IP Address to the Applications Manager server. In the case where an agent is deployed within the local network and another one in a remote site, a dual NIC or any one of the above means would be required to ensure this connectivity.
Note:
- Playback using Microsoft Edge WebDriver is supported only in the End User Monitoring (EUM) agent installed on Windows Server with Microsoft Edge support.
- Playback using Google Chrome WebDriver is supported only in the End User Monitoring (EUM) agent installed on Server with Google Chrome support.
- It is recommended to use the latest versions of Chrome and Edge browsers for playback.
- Click here to view the system requirements for the EUM Agent needed to add a Real Browser Monitor.
- Click here to learn about the prerequisites to perform Chrome and Edge playback in an EUM Agent running as Windows service.
- For Real Browser Monitor to function correctly in Linux environments, it is necessary to have Firefox installed.
For any further support please contact appmanager-support@manageengine.com. You can visit Troubleshooting details.
Webpage Analyzer
Following the steps to be done for setting up Webpage Analyzer monitor :
- Download the plugin for Webpage Analyzer.
- After downloading, extract the zip file contents into <Applications Manager Home>/working directory.
System Requirements with plugin
On-premise Setup
| Number of Webpage Analyzer Monitors | OS | Processor | Memory | Hard Disk |
|---|---|---|---|---|
| 1 to 10 | Windows / Linux | 4 Core / 2.4 GHz and above | 8 GB | 40 GB & above |
| 11 to 30 | Windows / Linux | 8 Core / 2.4 GHz and above | 16 GB RAM | 75 GB & above |
Cloud VM Setup
| Number of Webpage Analyzer Monitors | Processor | Hard Disk | AWS recommended instance type | Azure recommended instance size |
|---|---|---|---|---|
| 1 to 10 | 4 Core / 2.4 GHz and above | 40 GB & above | Type: m4.xlarge vCPU: 4 Memory: 16 GB Processor: 2.4 GHZ | Size: D4s_v3 vCPU: 4 Memory: 16 GB Processor: 2.4 GHZ |
| 11 to 30 | 8 Core / 2.4 GHz and above | 75 GB & above | Type: m4.2xlarge vCPU: 8 Memory: 32 GB Processor: 2.4 GHZ | Size: D8s_v3 vCPU: 8 Memory: 32 GB Processor: 2.4 GHZ |
Following are the components that can be found in the ZIP file of the plugin, which are required for data collection in Webpage Analyzer:
- Mozilla Firefox: Used as the browser in which the webpage is loaded.
- Gecko Driver: Used as a proxy that is used to communicate with Firefox.
- PageSpeed Insights: Used to retrieve PageSpeed results.
- Extension: Used to capture various performance metric data.
Note:
- Without the plugin, Webpage Analyzer monitors webpage similar to that of the HTTP URL monitor, with the exception that only the main URL will be monitored and not the underlying page components.
- To install PageSpeed Insights in Linux, open the terminal from <Applications Manager Home>/working/wpaAddons/PageSpeedInsights directory and execute the following command:
chmod a+x pagespeed_bin
Real User Monitor
To learn how to set up Real User Monitoring in Applications Manager, refer here.
Web Services
The WSDL URL and endpoint URL should be accessible from the machine where Applications Manager server is running. Make sure that the required credentials are provided for reading the WSDL and endpoint URL response while adding the monitor.
HTTP(s) URLs
The URL should be accessible from the machine where Applications Manager server is running. Make sure that the required credentials are provided for reading the URL response while adding the monitor.
Website Content Monitor
The URL should be accessible from the machine where Applications Manager server is running. Make sure that the required credentials are provided for reading the URL response while adding the monitor.
WebSocket Monitor
The WebSocket endpoint must be accessible from the machine where the Applications Manager server is running. Ensure that the required credentials are provided to read the WebSocket response when adding the monitor.
REST API Monitor
The API should be accessible from the machine where Applications Manager server is running. Make sure that the required credentials are provided for reading the API response while adding the monitor.
ManageEngine ADManager Plus
Mode of Monitoring: Remote JMX
Security/Firewall Requirements:
- To monitor ADManager Plus, allow Applications Manger installed server to access the JMX port used by the ADManager Plus server.
- To monitor PostgreSQL DB of ADManager Plus, allow Applications Manager installed server to access the port in which Postgres DB server of ADManager Plus is running.
User Privilege: To monitor PostgreSQL DB of ADManager Plus, the user provided for monitoring should have at least read-only access to statistics collector.
1. Add below entries in wrapper.conf (D:\ManageEngine Products\ADManager Plus\conf\wrapper.conf) or run.bat (D:\ManageEngine Products\ADManager Plus\bin\run.bat) file:
#Enable Remote JMXwrapper.java.additional.16=-Dcom.sun.management.jmxremotewrapper.java.additional.17=-Dcom.sun.management.jmxremote.port=1999wrapper.java.additional.18=-Dcom.sun.management.jmxremote.ssl=falsewrapper.java.additional.19=-Dcom.sun.management.jmxremote.authenticate=false
2. To monitor PostgreSQL DB, implement the following changes:
- D:\ManageEngine Products\ADManager Plus\pgsql\data\postgresql.conf
Uncomment and update IP address: listen_addresses = '172.22.168.171' D:\ManageEngine Products\ADManager Plus\pgsql\data\pg_hba.conf
# IPv4 local connections:
#host all all 127.0.0.1/32 trust
host all all 0.0.0.0/0 trust- For ADManager Plus v6633 and above, add a new line host all all 0.0.0.0/0 trust in pg_hba.conf file to allow all the machines with proper password authentication to access PostgreSQL database server. Click here for more details on configuring pg_hba.conf file.
- Update the hostname / ipaddress instead of localhost in database_params.conf file located under D:\ManageEngine Products\ADManager Plus\conf\ directory.
For PostgreSQL/MS SQL database, statistics will be collected by connecting to the database.
ManageEngine ServiceDesk Plus
Security/Firewall Requirements:
- To monitor ServiceDesk Plus, allow Applications Manger installed server to access the ports (HTTP and HTTPS) used by the ServiceDesk Plus server.
- To monitor PostgreSQL DB of ServiceDesk Plus, allow Applications Manager installed server to access the port in which PostgreSQL DB server of ServiceDesk Plus is running.
User Privilege:
- To monitor ServiceDesk Plus, the user provided should be authenticated in ServiceDesk Plus.
- To monitor PostgreSQL DB of ServiceDesk Plus, the user provided for monitoring should have at least read-only access to statistics collector.
To monitor PostgreSQL DB, implement the following changes:
- C:\ManageEngine\ServiceDesk\pgsql\data\postgresql.conf
Uncomment and update ip address: listen_addresses = '172.22.168.171' C:\ManageEngine\ServiceDesk\pgsql\data\pg_hba.conf
# IPv4 local connections:
#host all all 127.0.0.1/32 trust
host all all 0.0.0.0/0 trust- For ServiceDesk Plus v10500 and above, add a new line host all all 0.0.0.0/0 trust in pg_hba.conf file to allow all the machines with proper password authentication to access PostgreSQL database server. Click here for more details on configuring pg_hba.conf file.
The below given step should be followed for SDP versions below 9400:
- Update the hostname / ipaddress instead of localhost in postgres-ds.xml file located under <SDP_HOME>\ServiceDesk\server\default\deploy\ directory.
Whereas, for SDP versions 9400 and above, the step to be followed is:
- Update the hostname / ipaddress instead of localhost in database_params.conf file located under <SDP_HOME>\ServiceDesk\conf\
ManageEngine OpManager
Mode of Monitoring: Remote JMX
Prerequisites for monitoring ManageEngine OpManager:
For Windows:
In Service Mode:
1. Add below entries in wrapper.conf file.
C:\ManageEngine\OpManager\conf\wrapper.conf
# Enable Remote JMX wrapper.java.additional.16=-Dcom.sun.management.jmxremote wrapper.java.additional.17=-Dcom.sun.management.jmxremote.port=1999 wrapper.java.additional.18=-Dcom.sun.management.jmxremote.ssl=false wrapper.java.additional.19=-Dcom.sun.management.jmxremote.authenticate=false wrapper.java.additional.20=-Dcom.sun.management.jmxremote.rmi.port=1999 wrapper.java.additional.21=-Djava.rmi.server.hostname=<Hostname/IP address of OpManager>
2. After adding the above entries, save the file and restart OpManager.
In Non-Service Mode:
Append the following parameters to JAVA_OPTS:
set JAVA_OPTS= %JAVA_OPTS% -Dcom.sun.management.jmxremote -Dcom.sun.management.jmxremote.port=1999 -Dcom.sun.management.jmxremote.ssl=false -Dcom.sun.management.jmxremote.authenticate=false -Dcom.sun.management.jmxremote.rmi.port=1999-Djava.rmi.server.hostname=<Hostname/IP address of OpManager>
For Linux:
Add the following entry in run.sh:
JAVA_OPTS="$JAVA_OPTS-Dcom.sun.management.jmxremote-Dcom.sun.management.jmxremote.port=1999-Dcom.sun.management.jmxremote.authenticate=false-Dcom.sun.management.jmxremote.ssl=false-Dcom.sun.management.jmxremote.rmi.port=1999-Djava.rmi.server.hostname=<Hostname/IP address of OpManager>"
2. To monitor PostgreSQL DB, do the following changes:
- Open postgresql.conf file under <postgres home>/data directory.
- Check the value of the configuration parameter listen_addresses. It should be "*". Click here for more details on configuring postgresql.conf file.
- Open pg_hba.conf under <postgres home>/data
- Add a new line 'host all all 0.0.0.0/0 trust' to allow all the machines with proper password authentication to acces PostgreSQL database server. Click here for more details on configuring pg_hba.conf file.
- Open C:\ManageEngine\OpManager\conf\database_params.conf file and update the hostname/ipaddress instead of localhost.
Security/Firewall Requirements:
- To monitor ME OpManager, allow the Applications Manger installed server to access the JMX port used by the OpManager server.
- To monitor PGSQL DB of OpManager, allow the Applications Manager installed server to access the port in which Postgres DB server of OpManager is running.
Minimum User privilege:
- To monitor PGSQL DB of OpManager, the user should at least have read-only access to the statistics collector.
APM Insight
Ensure that your environment meets the following prerequisites and configurations for smooth installation and monitoring of the agent.
Java Agent
Version: Ensure the environment has Java version 8 or above.
Note: For Java versions below 8, use Java Agent v5.5, available here.
- Network and Firewall: Allow outbound communication from the agent-installed machine to the Applications Manager (host and port) directly or through a proxy server.
- Permissions: The application user must have full access permissions to the agent directory.
- Uninstall any competing agents tools (Eg: Dynatrace, AppDynamics) before installing this agent.
Note: Please note that it is necessary to restart your application server to start monitoring after the agent installation.
.NET Agent
- Version: Ensure the environment is equipped with Microsoft .NET runtime version 4.0 or later and IIS 7.0 or higher (if onboarding IIS sites).
- Network and Firewall: Allow outbound communication from the agent-installed machine to the Applications Manager (host and port) directly or through a proxy server.
- Permissions: The application user must have full access permissions to the agent directory - C:\ProgramData\DotNetAgent.
- Uninstall any competing agents tools (Eg: Dynatrace, AppDynamics) before installing this agent.
- SharePoint/Multi-Domain environment: Specific configuration changes are required due to security concerns in these environments.
Note: After installing the agent, it is essential to restart your application server for monitoring to begin. For IIS sites, execute the IISRESET command; for Windows services and desktop applications, perform a manual restart of the respective services or apps.
Converged Infrastructure
Cisco UCS
Cisco UCS Manager should be installed and running in the Cisco UCS device while adding the monitor.
Configuring Cisco UCS Manager:
Refer to the following links to learn more about configuring Cisco UCS Manager.
- https://www.cisco.com/c/en/us/products/servers-unified-computing/ucs-manager/index.html
- https://www.cisco.com/c/en/us/td/docs/unified_computing/ucs/ucs-manager/GUI-User-Guides/Getting-Started/4-1/b_UCSM_Getting_Started_Guide_4_1/b_UCSM_Getting_Started_Guide_4_1_chapter_0100.html
- https://www.cisco.com/c/en/us/products/collateral/servers-unified-computing/ucs-manager/whitepaper_c11-697337.html
Custom Monitors
Database Query Monitor
For MSSQL, to run a specific query on a particular database, the database should be provided with "db_datareader" role or "db owner role" or "connect any database" at server level permission for the SQL user account.
File / Directory Monitor
To add a file/directory monitor, ensure that the file or directory has Read permission.
Script Monitor
- To add a script monitor, ensure that the command or script has Executable permission.
- On Windows systems, make sure PowerShell is properly configured. Click here for the steps to enable PowerShell.
SNMP / Network Device
- Ensure that the SNMP port is not blocked in firewall.
- To monitor OIDs for a device, the corresponding MIB files must be available and loaded into Applications Manager. For example, if any hardware belongs to Dell (or) any other vendor, it's MIBs and OIDs that provide specific information needs to be collected from the vendor.
Windows Performance Counter
To monitor a Windows Performance Counter, use the Cluster Domain Administrator username and password, for which the user account should have the permission to execute WMI queries on root\mscluster namespace in cluster server nodes.
Firewall access for monitoring:
Following are the ports required for monitoring via WMI:
- Remote Procedure Call (RPC) (Default :TCP 135)
- Windows Management Instrumentation (WMI) (Default : TCP 445)
- Target server uses random port above 1024 by default to respond back for remote communication (DCOM) (Default : TCP 1025 to 1030)
https://www.manageengine.com/products/applications_manager/help/sap-server-monitor.html https://www.manageengine.com/products/applications_manager/help/creating-threshold-profile.html
