Custom attributes in REST API
Custom attributes in the REST API and REST API Sequence monitors are the attributes that are fetched from the XML/JSON response of the REST API. To fetch these attributes, the XSLT Code or JSON Schema is defined and used to retrieve the attribute from the response, which can then be monitored.
Based on the response obtained, the user can define their attributes to monitor specific values in the API response under the Response Details tab. Browse through the topics given below to learn how to monitor custom attributes based on the response type:
Note: Reports cannot be generated if the custom attributes monitored are in String format.
XML Response
If the response is of XML type, the user can define specific values to be monitored using the XSL transformation. To do so, select XML as the Response Type while adding/editing the monitor. Then click on Add/View XSLT Code located under the Response Details tab in the monitor and define the attributes to be monitored in the following format:
Syntax for XSLT Code
<?xml version="1.0" encoding="UTF-8"?> <xsl:stylesheet version="1.0" xmlns:xsl="http://www.w3.org/1999/XSL/Transform"> <xsl:output method="text"/> <xsl:template match="/"> attributename:<Path to fetch the attribute> </xsl:template> </xsl:stylesheet>
To define specific attributes to be monitored, ensure that the following criterias are met:
The output method should be of type 'text'.
<xsl:output method="text"/>
The final output of the path to fetch the attribute should be of the format attributeName:attributeValue.
Example:Days:<xsl:value-of select="days"/> would create an attribute 'Days' whose value will be the value of the <days> tag present in the API Response.
Upon clicking the Update XSLT Code button, the defined attributes will be fetched and monitored along with their corresponding values in the table below, which can then be used to configure alarms, thresholds, and actions, and generate reports as well.
Example:
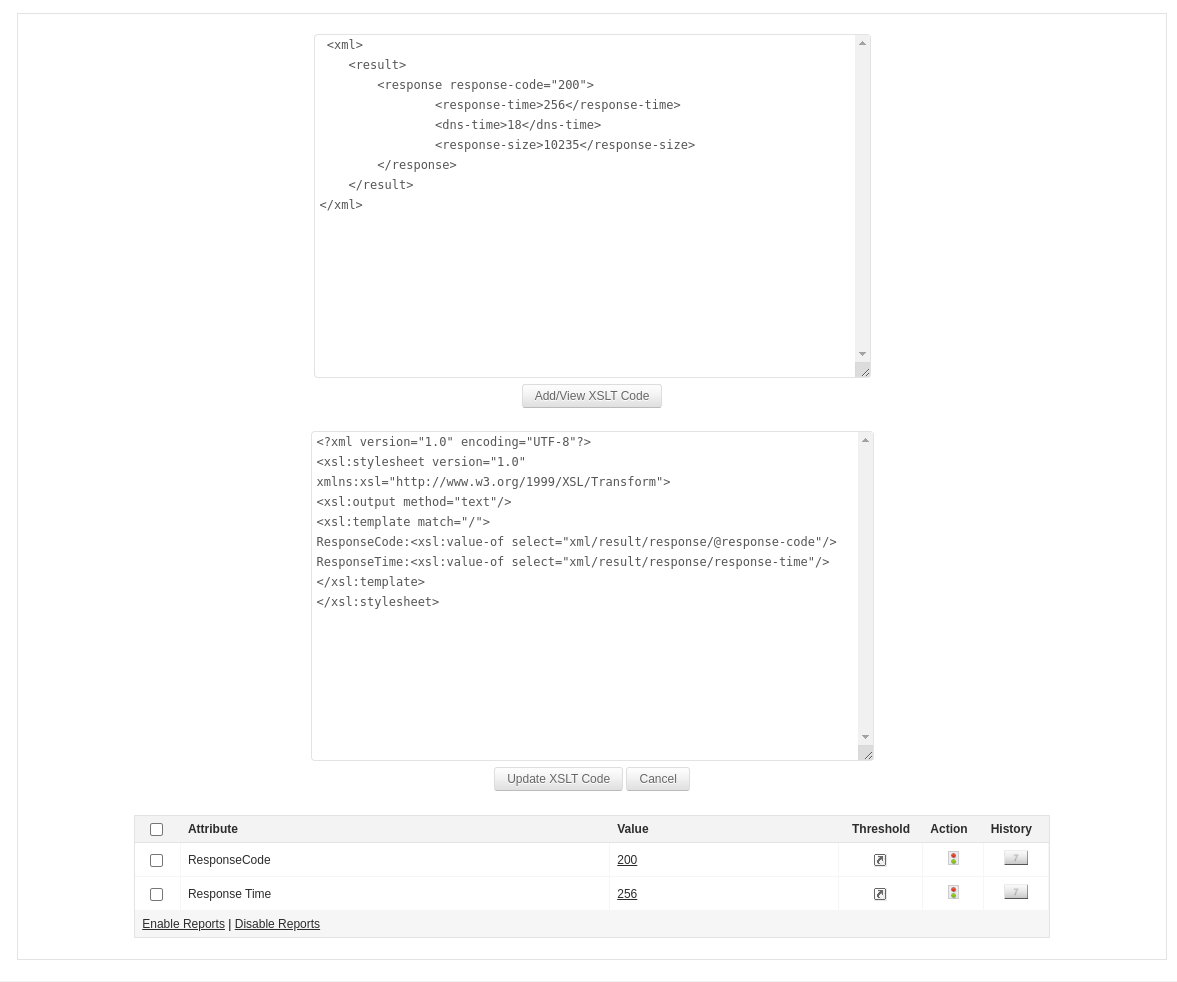
Let us consider the following API response code of XML format which will be displayed upon accessing the Response Details tab:
<xml> <result> <response response-code="200"> <response-time>256</response-time> <dns-time>18</dns-time> <response-size>10235</response-size> </response> </result> </xml>
Let's say you want to monitor the Response Code and Response Time attributes from the API response. To do so, click on Add/View XSLT Code and define the attributes in the following format:
<?xml version="1.0" encoding="UTF-8"?> <xsl:stylesheet version="1.0" xmlns:xsl="http://www.w3.org/1999/XSL/Transform"> <xsl:output method="text"/> <xsl:template match="/"> ResponseCode:<xsl:value-of select="xml/result/response/@response-code"/> ResponseTime:<xsl:value-of select="xml/result/response/response-time"/> </xsl:template> </xsl:stylesheet>
where,
- <xsl:output method="text"/> refers to the output method of XSLT.
- <xsl:template match="/"> refers to select complete XML
- ResponseCode:<xsl:value-of select="xml/result/response/@response-code"/>refers to the path to fetch attribute, in which,
- ResponseCode is the name of the attribute.
- xml/result is used to traverse throught the nodes. Here we are selecting the result node which is inside the xml node.
- response/@response-code is used to select the attribute from the node. Here we are selecting the response-code attribute from the response node.
Similarly, to fetch the response node value, we can define it as xml/result/response in the path which will fetch the response node value.
Upon clicking Update XSLT Code, the attributes ResponseCode and ResponseTime will be monitored along with their corresponsing values in the table, which will then be used to configure alarms, thresholds, and actions, and generate reports as well.
JSON Response
If the response is of the JSON type, you can define specific values to be monitored using the JSON Schema. To do so, select JSON as the Response Type while adding/editing the monitor. Then click on Add/View JSON Schema located under the Response Details tab in the monitor and define the attributes to be monitored in the following format:
Syntax for JSON Schema
<AttributeName>::<Path to fetch the attribute>
To define specific attributes to be monitored, ensure that the following criterias are met:
The attribute should be defined as attributeName::attributeValue.
Example:Temprature::response.weather.temperature would create an attribute Temperature whose value will be the value of the temperature variable present in the API Response.
- If the JSON key contains a dot(.), then it should be replaced with _sep_. This should be done for all the individual keys which contain dot(.) in it.
- In case of multiple JSON Schemas, they should be defined by using new line as the delimiter.
Upon clicking Update JSON Schema button, the defined attributes will be fetched and monitored along with their corresponsing values in the table below, which can then be used to configure alarms, thresholds, and actions, and generate reports as well.
Example:
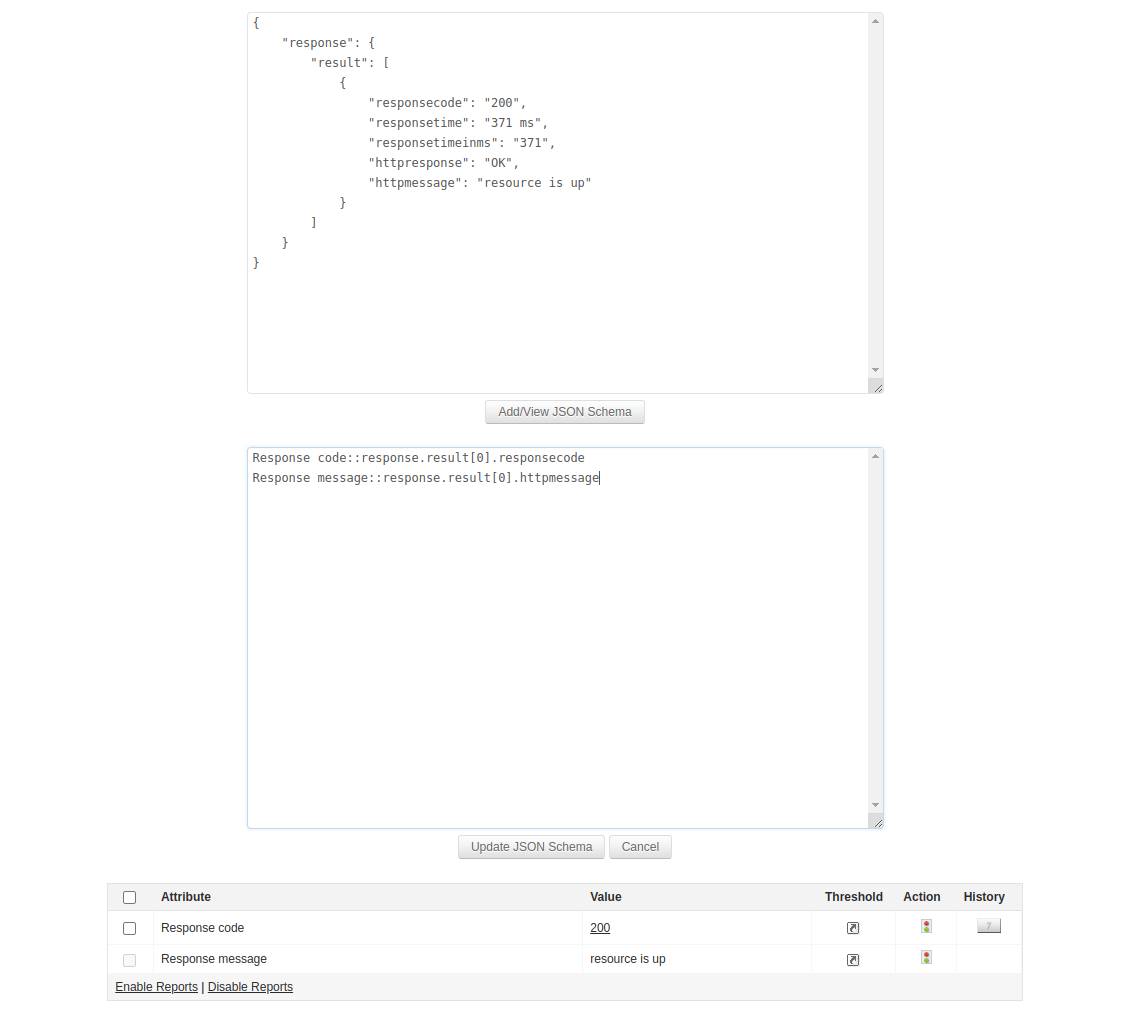
Let us consider the following API response code of JSON format which will be shown upon accessing the Response Details tab:
{ "response": { "result": [ { "responsecode": "200", "responsetime": "371 ms", "responsetimeinms": "371", "httpresponse": "OK", "httpmessage": "resource is up" } ] } }
Let's say you want to monitor the Response Code and Response Message attributes from the API response. To do so, click on Add/View JSON Schema and define the attributes in the following format:
Response Code::response.result[0].responsecode Response Message::response.result[0].httpmessage
where,
- Response Code is the name we are giving for the attribute.
- response.result[0].responsecode refers to the path used to fetch attribute in which,
- response.result is the keyname used to traverse throught the object from the JSON array. Here we are selecting the result object which is inside of the response object.
- result[0] is the array index used to specify the object from the JSON array.
- responsecode is used to select the attribute from the JSON array. Here we are selecting responsecode attribute from result object present under the response object.
Similarly, to fetch response object values, we can define as response.result[0] in the path which will fetch the response object values.
Upon clicking Update JSON Schema, the attributes Response Code and Response Message will be monitored along with their corresponsing values in the table, which can then be used to configure alarms, thresholds, actions, and generate reports as well.