Microsoft Azure SQL Database is a scalable, relational database-as-a-service that provides managed SQL database capabilities to applications running in the Azure cloud. Applications Manager provides SQL Azure monitoring capability by tracking key performance indicators and query statistics while notifying users of events and outages occurring in their system.
Let's take a look at what you need to see for Microsoft Azure SQL database administration from a high availability viewpoint, the performance metrics to gather and how you can ensure that your Azure SQL database is operating as expected:
With Applications Manager's Microsoft SQL Azure performance monitoring feature, track key performance indicators such as DTU usage and R/W utilization to help you determine whether your database has excess capacity or has resources are maxed out. Gather info about resource consumption (CPU, storage, I/O, etc.), and track the general efficiency of your database. Get alerted before maximum capacity is reached.
Lock waits indicate data contention by queries; page IO latch waits indicate slow IO response times; page latch update waits indicate incorrect file layout. Applications Manager's Microsoft Azure SQL monitoring fetches data such as wait time during query execution, historical long running and blocked queries. In addition, it also provides metrics to aid in troubleshooting, such as the count of deadlocks. Receive alerts when SQL deadlocks occur and identify failed processes.
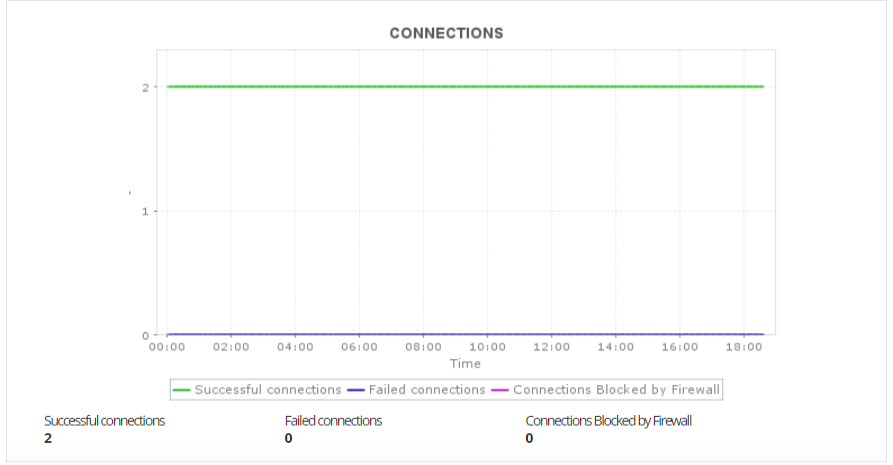
Drill down into each aspect of Azure SQL Monitoring metrics - CPU, reads, writes, number of sessions and client connections, to evaluate how well your workload fits the performance level. Track any data retrieved from the database via custom SQL queries. Visualize how specific activities might impact others and jump to run-time performance graphs, which show specific query performance trends and activity details with our Azure SQL monitoring solution.

Distinguish consistent performance patterns from anomalies, which is critical to ensuring your data platform delivers optimal performance for the end users of your applications. Monitor SQL Azure to get instant notifications of performance issues and bottlenecks. Take quick remedial action before your end-users experience issues.
With Applications Manager's SQL Azure monitoring, you gain system-wide visibility into resource utilization, application performance, and operational health of your MS Azure SQL database and application performance. Explore features of Azure SQL monitoring on your own with Applications Manager’s full-fledged, 30-day free trial edition.
Applications Manager also offers support for other Microsoft Azure services like Azure monitoring and Azure Storage monitoring.
It allows us to track crucial metrics such as response times, resource utilization, error rates, and transaction performance. The real-time monitoring alerts promptly notify us of any issues or anomalies, enabling us to take immediate action.
Reviewer Role: Research and Development
Trusted by over 6000+ businesses globally