Managing Log Processors
Last updated on:
In this page
Overview
This page explains how to manage Log Processors in your deployment. You can modify processor configurations, update settings, monitor performance and health, assign or modify custom roles, and remove processors or roles when they are no longer required.
Modifying roles
You can update the Log Processor to change its assigned roles: Log Collection, Log Processing, or both, depending on your deployment needs. This allows you to enable or disable specific roles for the Log Processor as required.
To modify the roles of a Log Processor:
- Navigate to the Log Processors page and click the
 icon next to the processor you want to update.
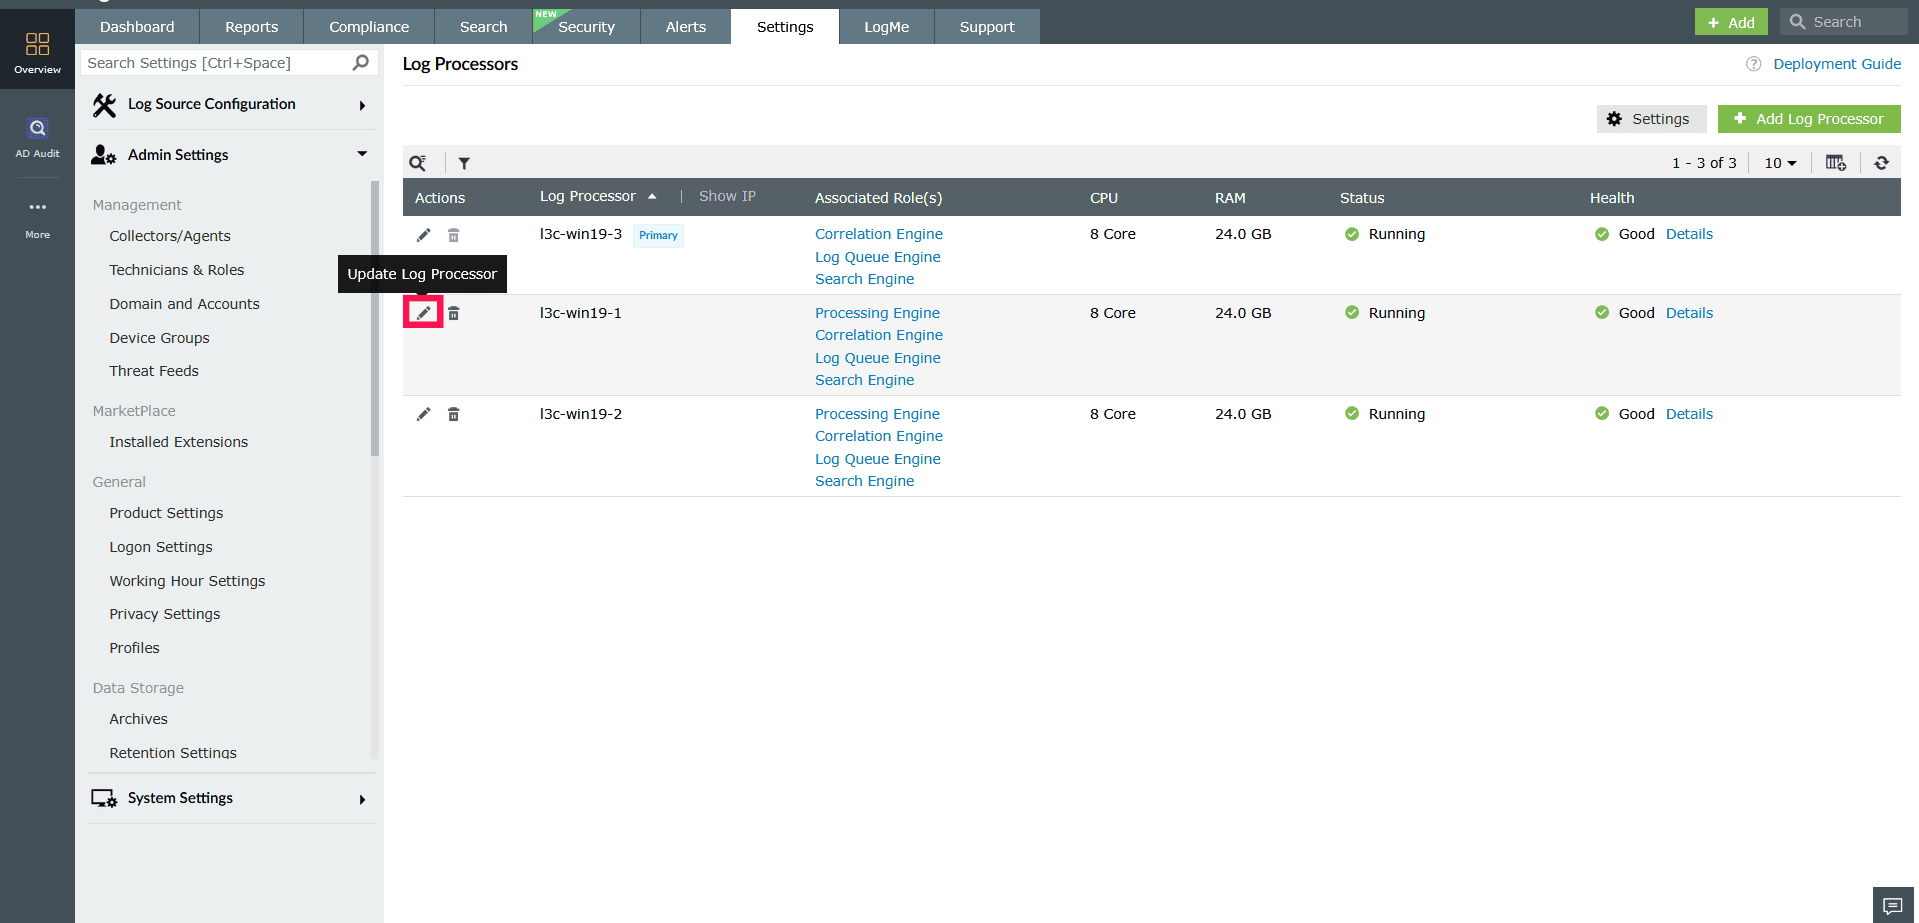
Figure 1: Modifying roles in a Log Processor - In the Edit Log Processor window, the Display Name of the selected Log Processor will appear. If needed, you can edit the Log Processor display name.
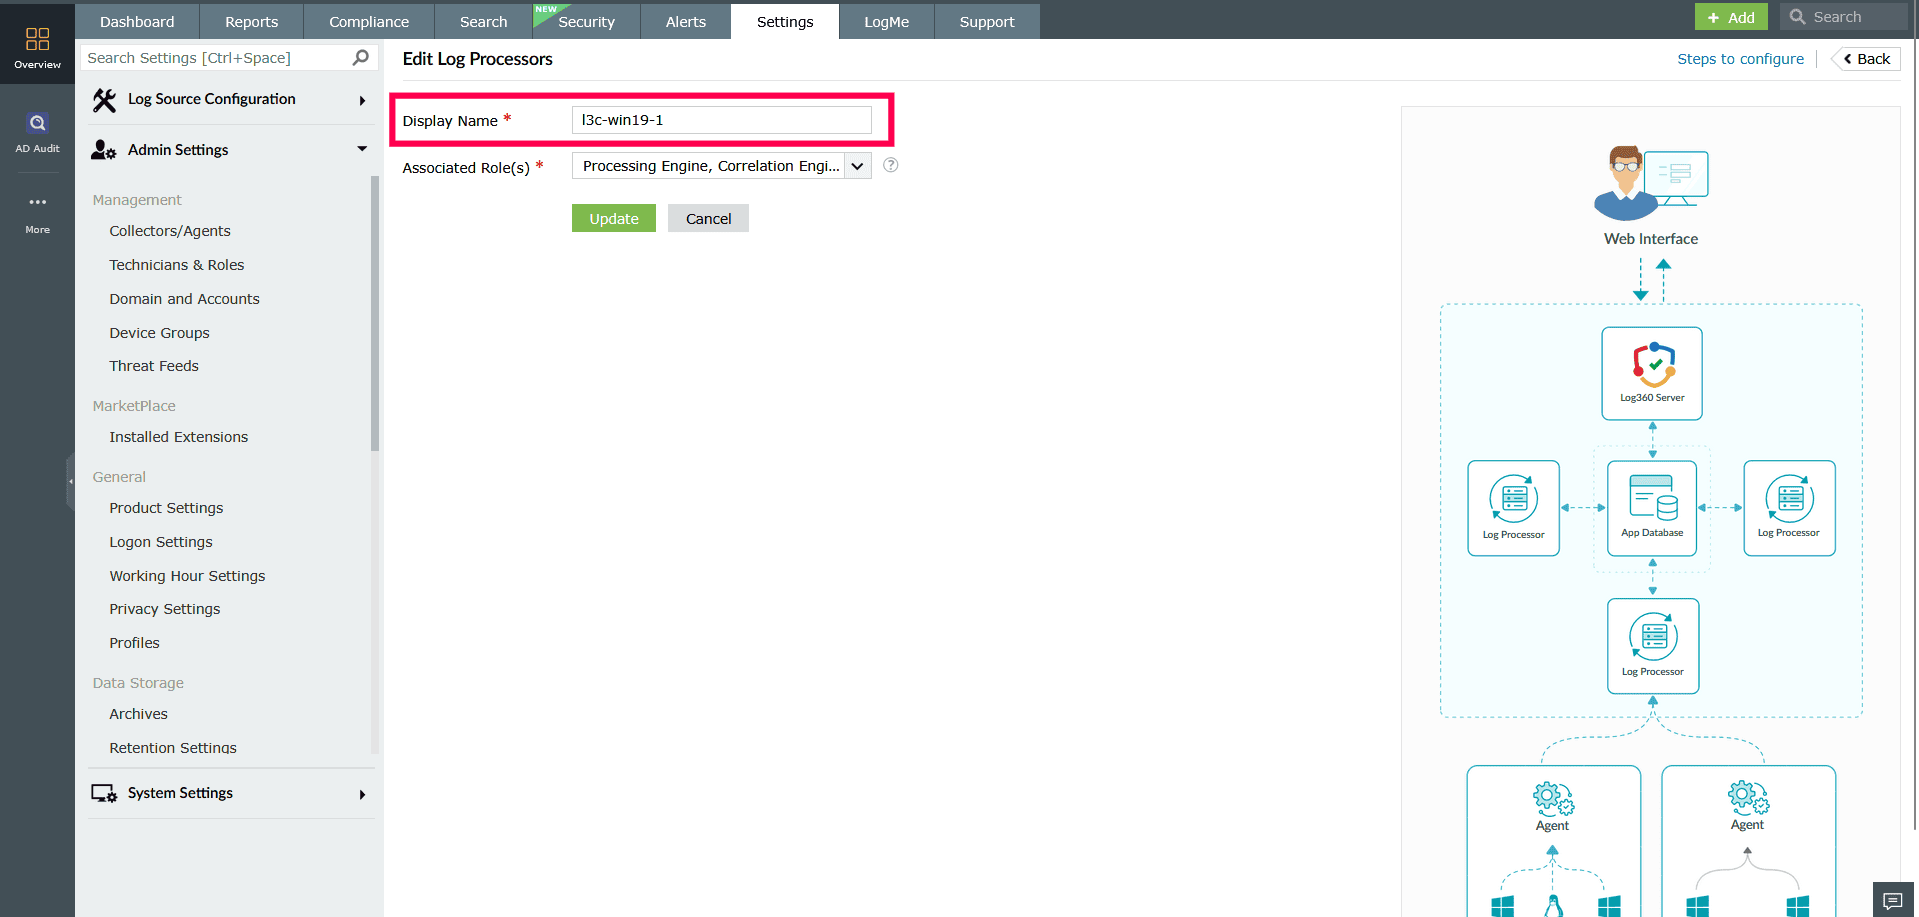
Figure 2: Modifying roles in a Log Processor NOTE You can configure the associated roles only when the cluster has three or more Log Processors This is because certain functions, such as Log Queue Engine and Search Engine, require at least two Log Processors in the cluster.
- In the Associated Role(s) checklist, select or unselect roles based on your deployment needs. Available roles include:
- Processing Engine
- Correlation Engine
- Search Engine
- Log Queue Engine
- Custom roles such as Log Forwarding or Alerts
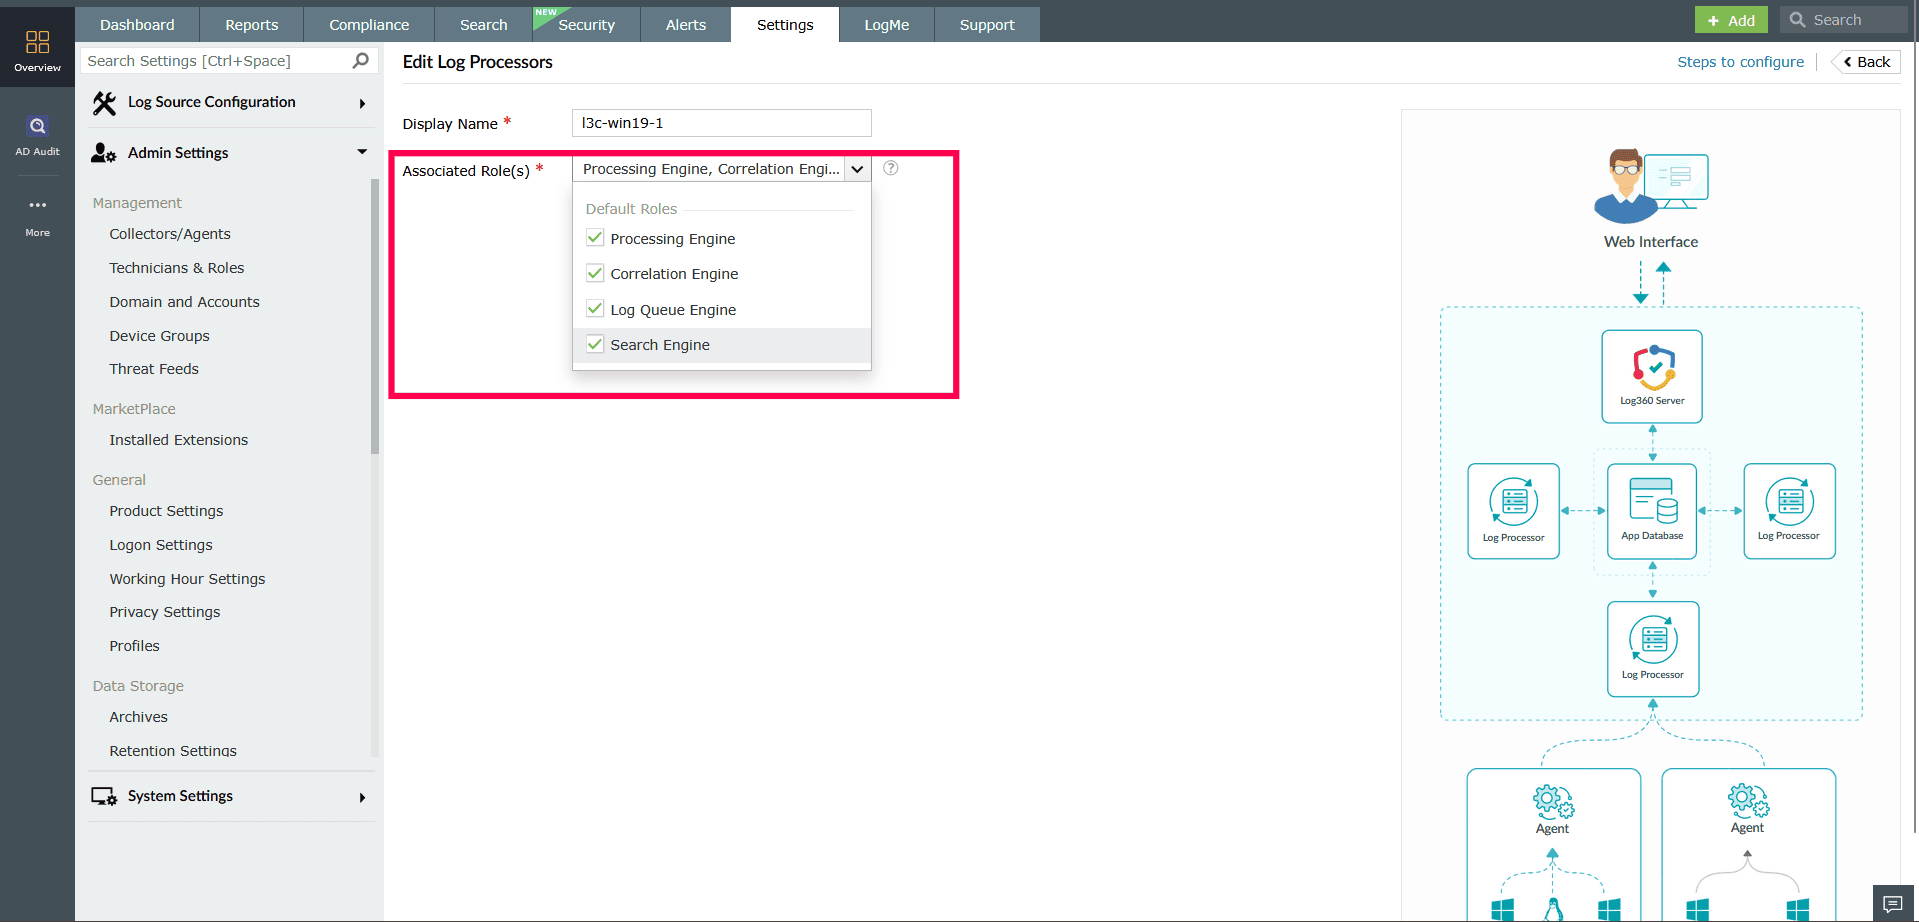
Figure 3: Modifying roles in a Log Processor NOTE A Log Processor must have at least one role assigned. It cannot be saved with all roles disabled.
- Click Update to apply the changes.
Updating Log Processor settings
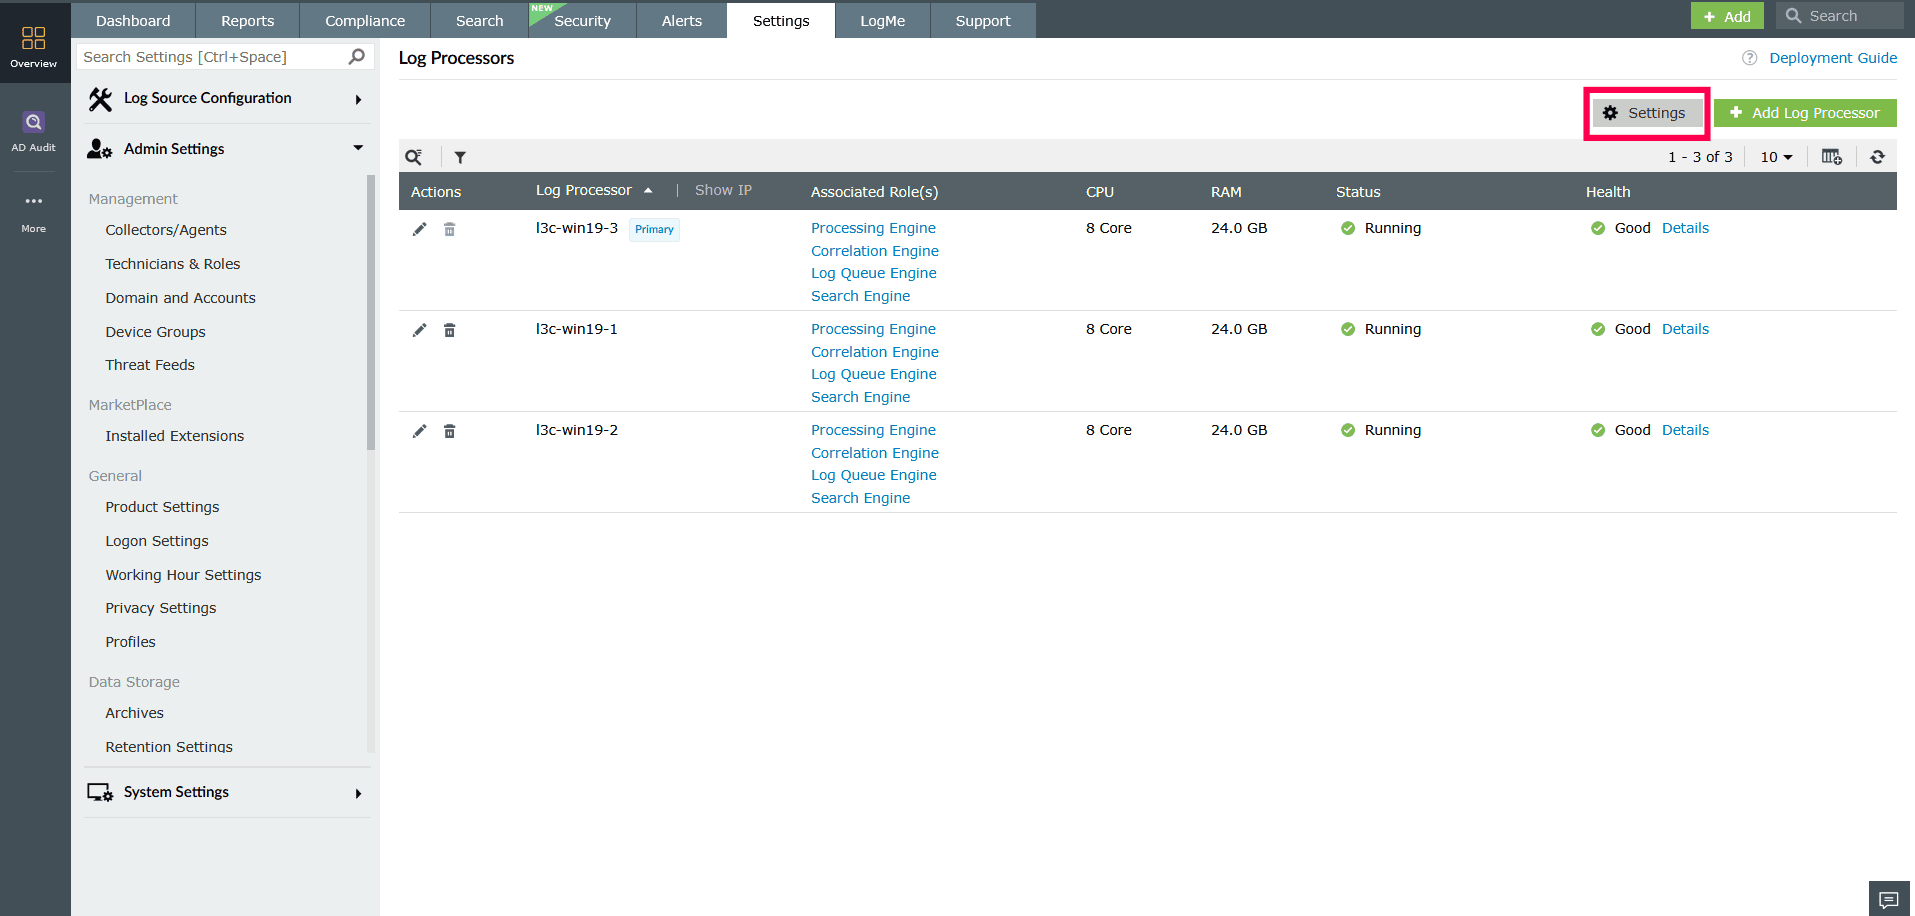
In the Log Processors page, click Settings in the top-right corner. This opens the Log Processor Settings window with the following tabs.
- Shared Storage Location
- Enter the shared folder path.
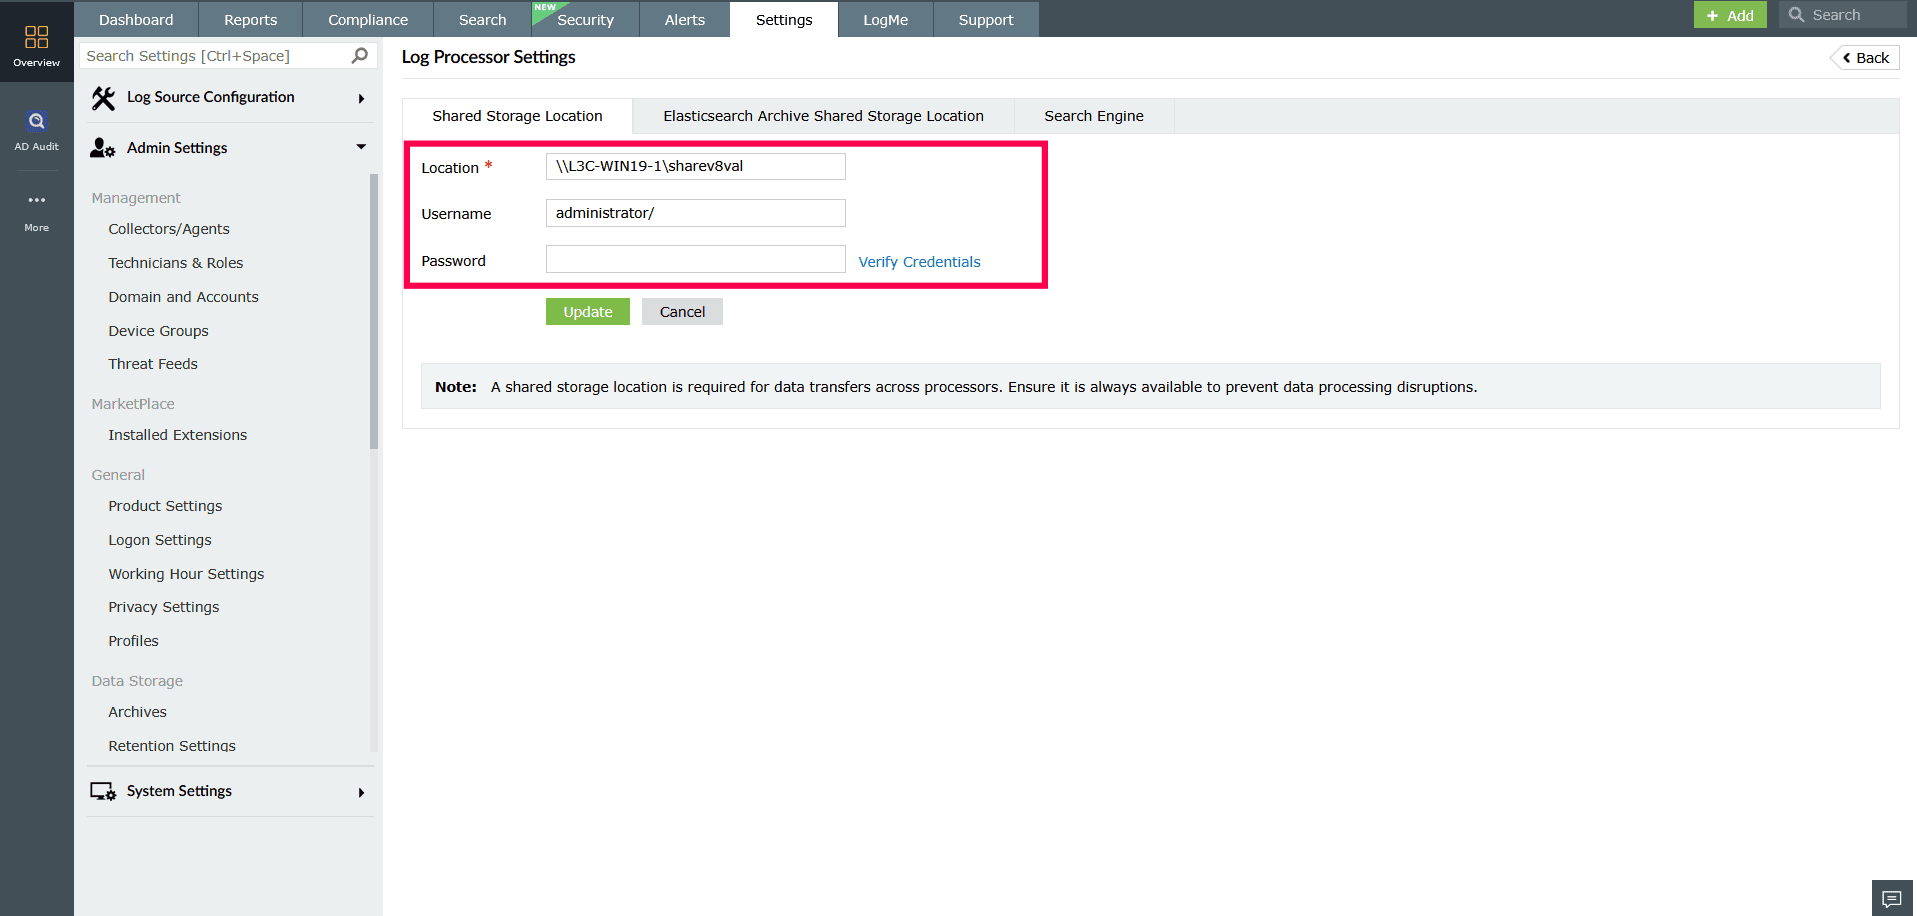
Figure 5: Configuring Shared Storage Location - Enter the Username and Password.
- Click Verify Credentials to validate access.
- Click Update to save changes.
NOTE Shared storage is required for transferring data between processors. Ensure the path is accessible always to avoid interruptions in log processing.
- Enter the shared folder path.
- Elasticsearch Archive Shared Storage Location
- Enter the archive path.
- Enter the Username and Password.
- Click Verify Credentials to validate access.
- Click Update to save changes.
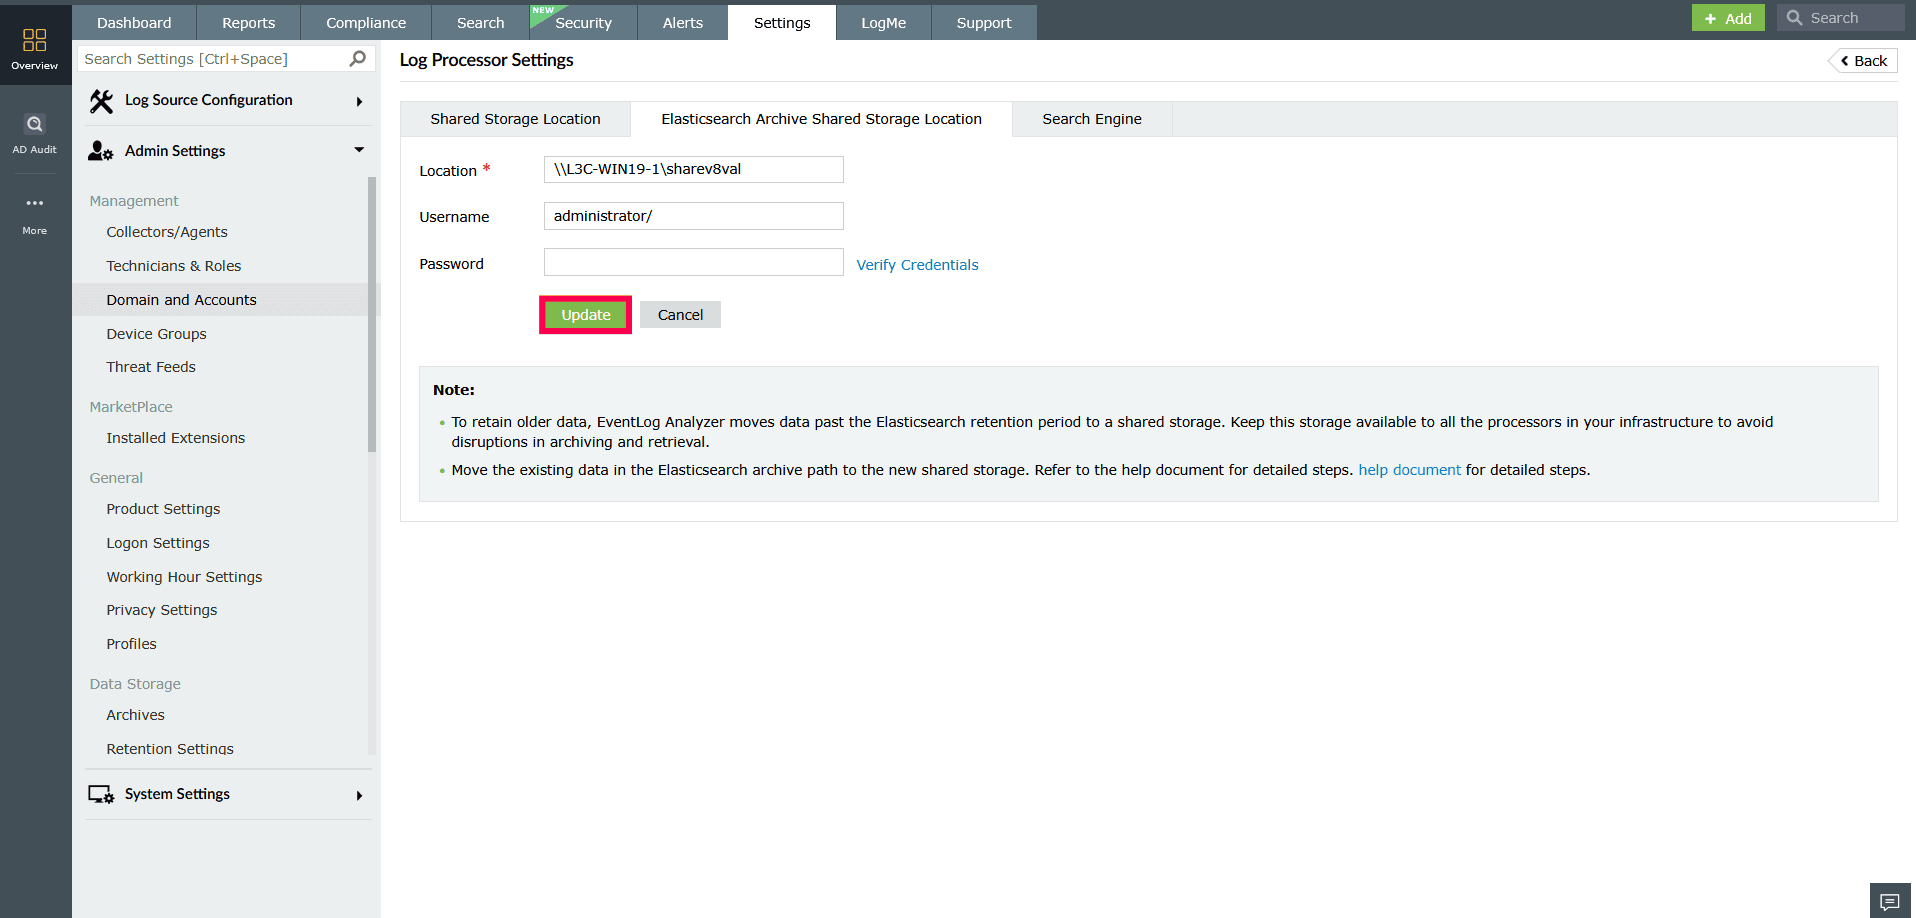
Figure 6: Configuring Elasticsearch Archive Shared Storage Location NOTE This path is used to store archived Elasticsearch data. Ensure the location is accessible from all Log Processors and has enough storage capacity to accommodate archived data over time.
- Search Engine
- Check Enable Replica(s) to create a backup copy of indexed data.
- Click Update to apply all changes.
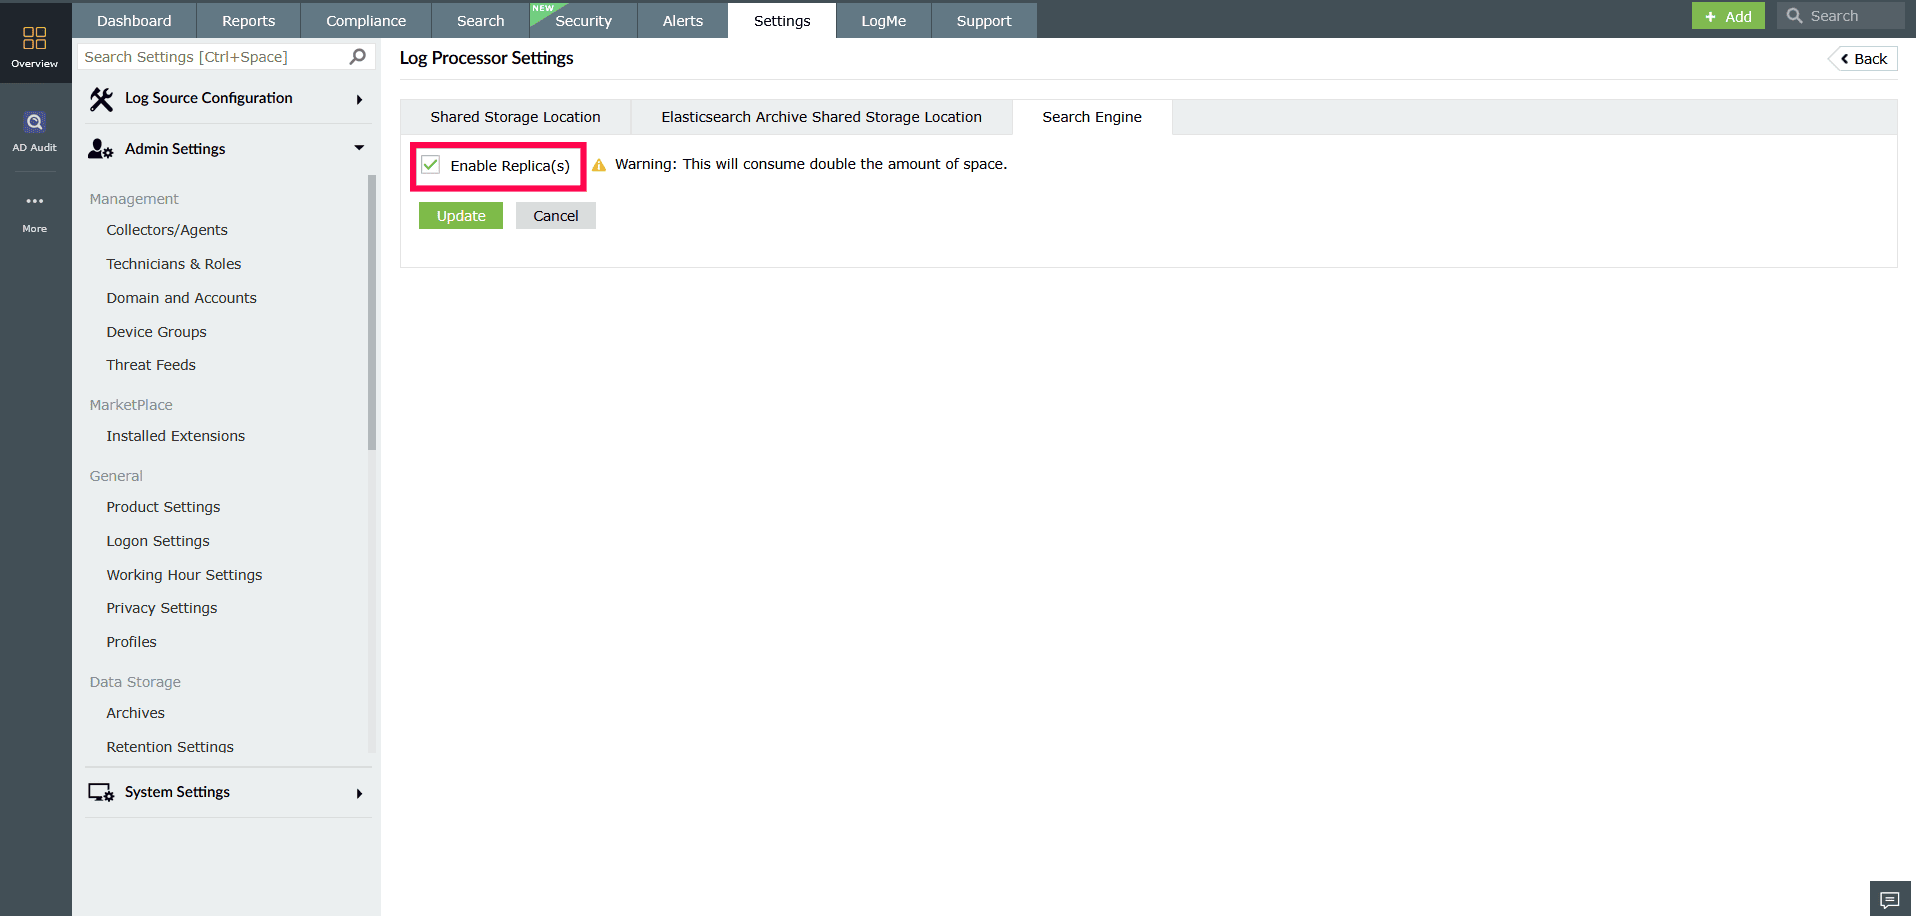
Figure 7: Configuring Search Engine NOTE Enabling replicas will store duplicate copies of search indexes, which requires additional disk space.
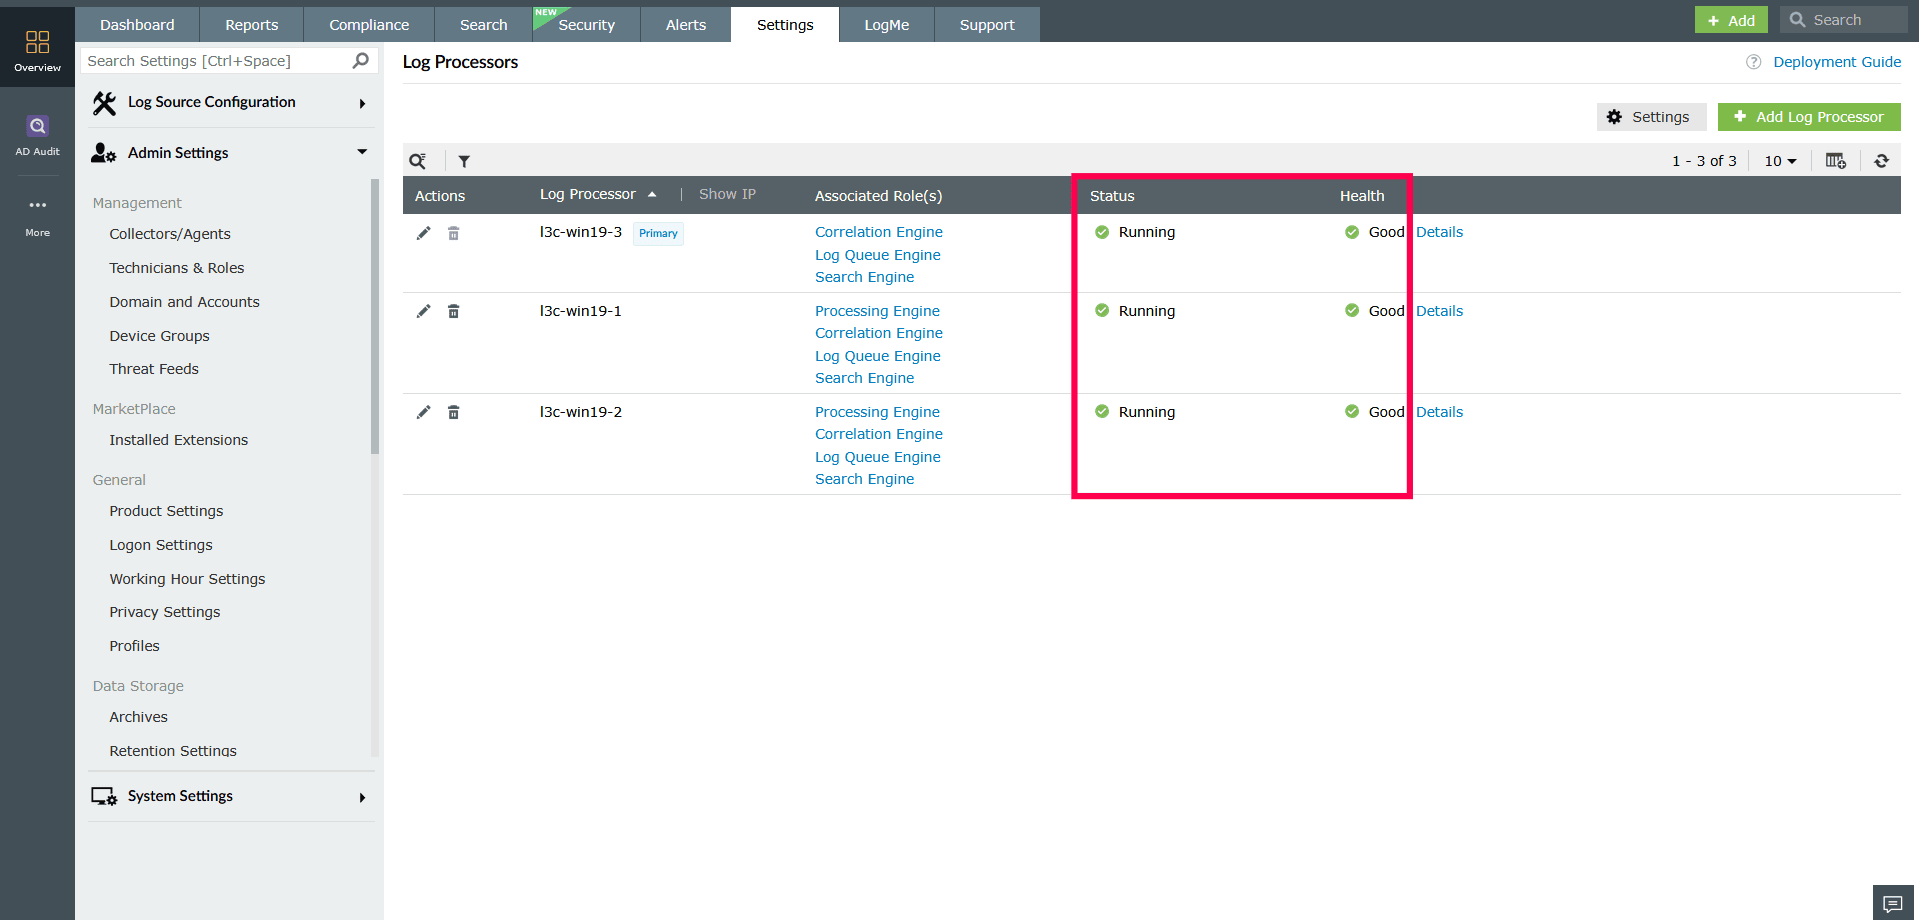
Monitoring status and performance
The Log Processors page provides real-time insights into the operational status and resource health of each processor in your deployment.
Status indicators:
- Running - The Log Processor is online and functioning normally.
- Down - The Log Processor is unreachable or has been shut down.
- Service Status Unavailable - The processor is reachable, but internal services are not reporting properly.
Health indicators:
- Good - The processor is operating without issues.
- Needs Attention - Minor issues or misconfigurations have been detected, or certain modules may not be functioning properly.
- Critical - Major issues are affecting processor functionality.
Viewing Performance Metrics
To enable CPU and RAM monitoring:
- In the Log Processor list view, click the
 icon on the right.
 - Select the CPU and RAM checkboxes.
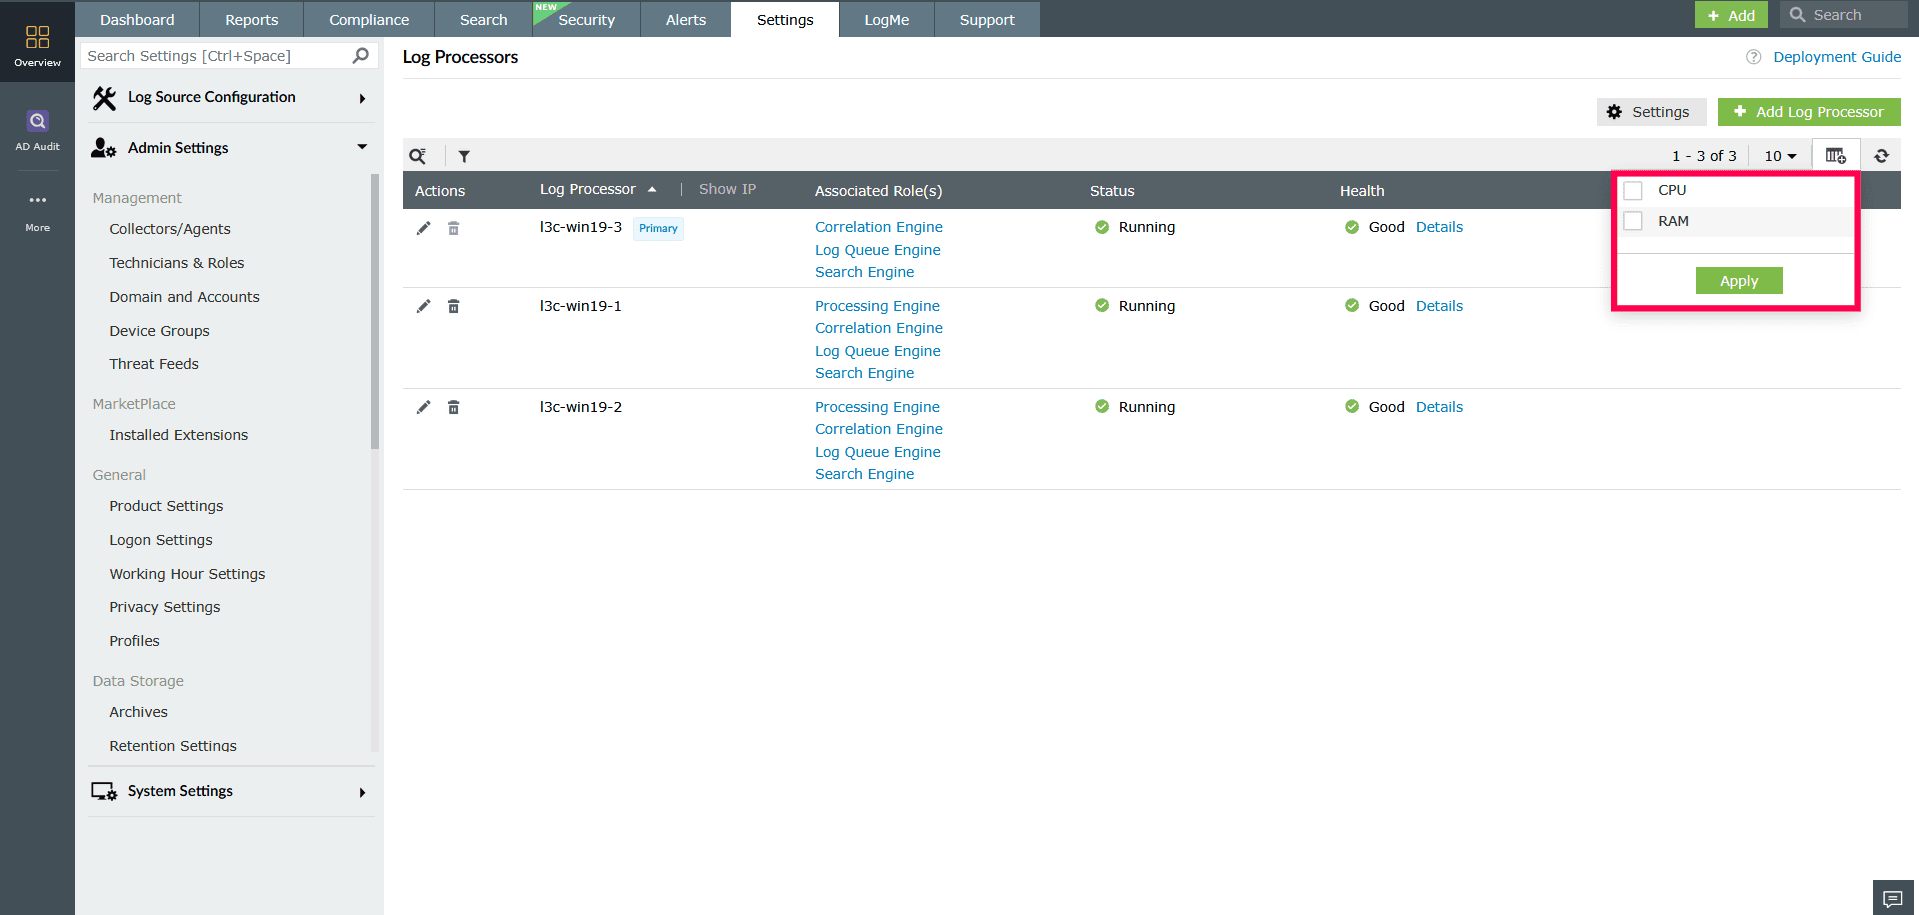
Figure 9: Enabling CPU and RAM monitoring - Click Apply to display these columns for all processors.
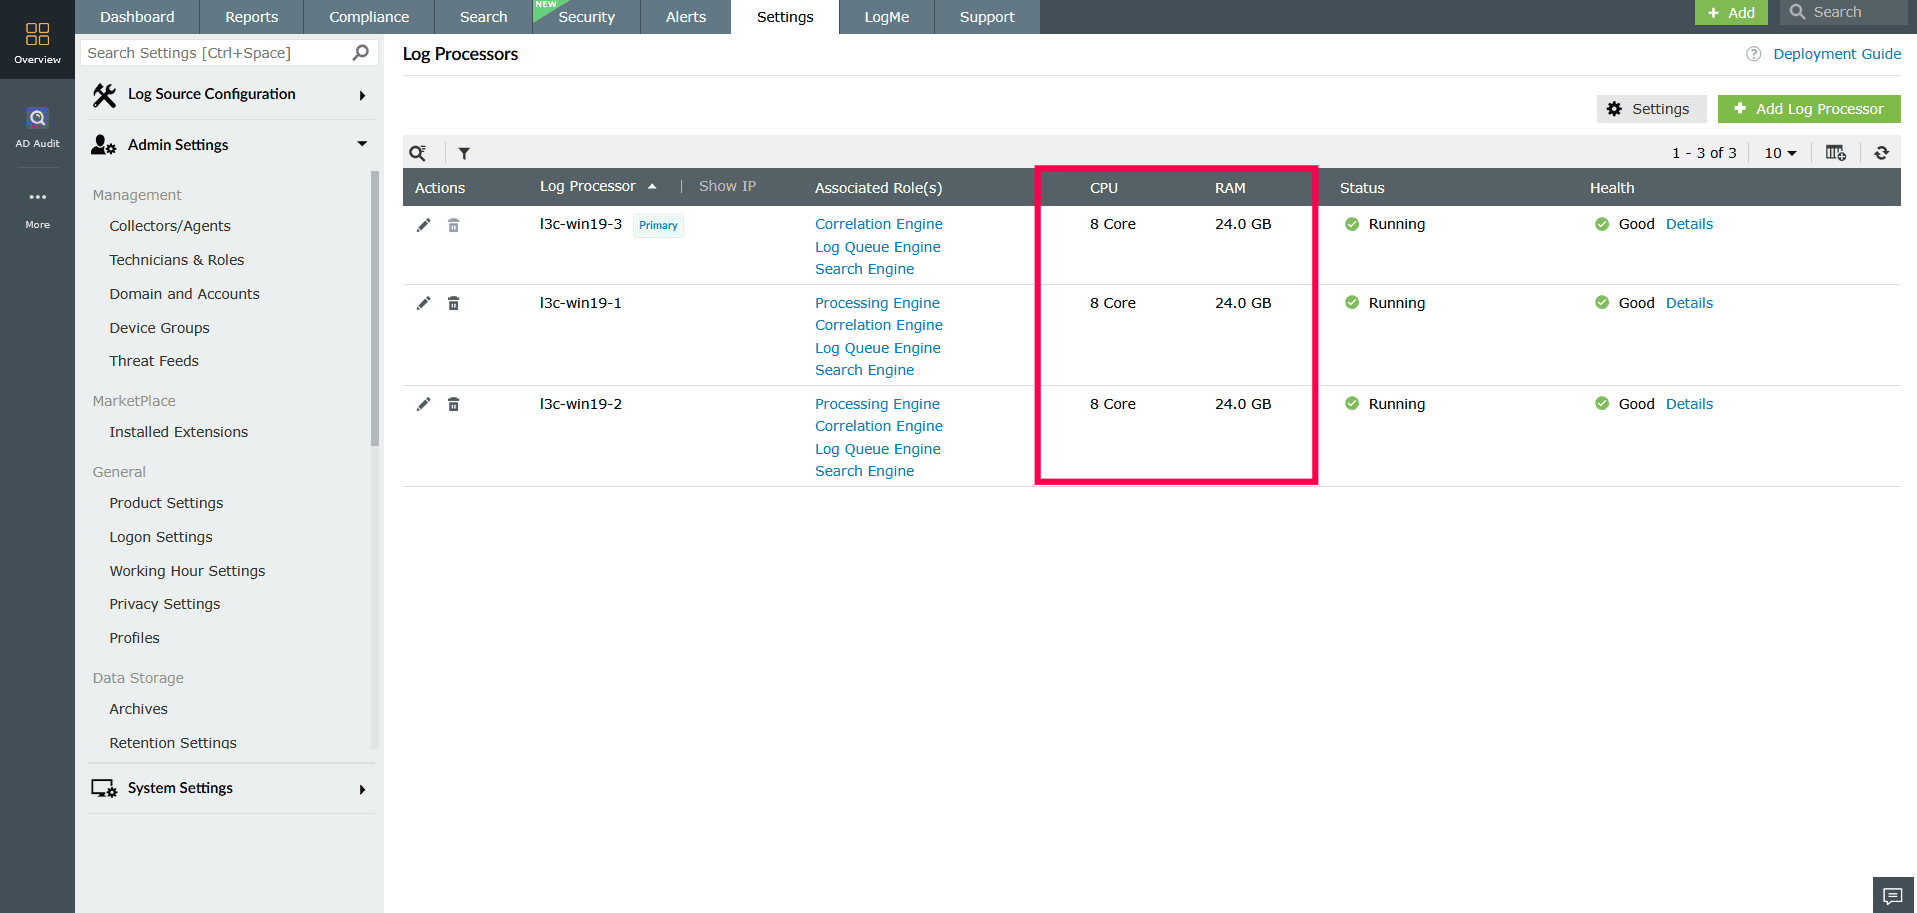
Figure 10: Enabling CPU and RAM monitoring
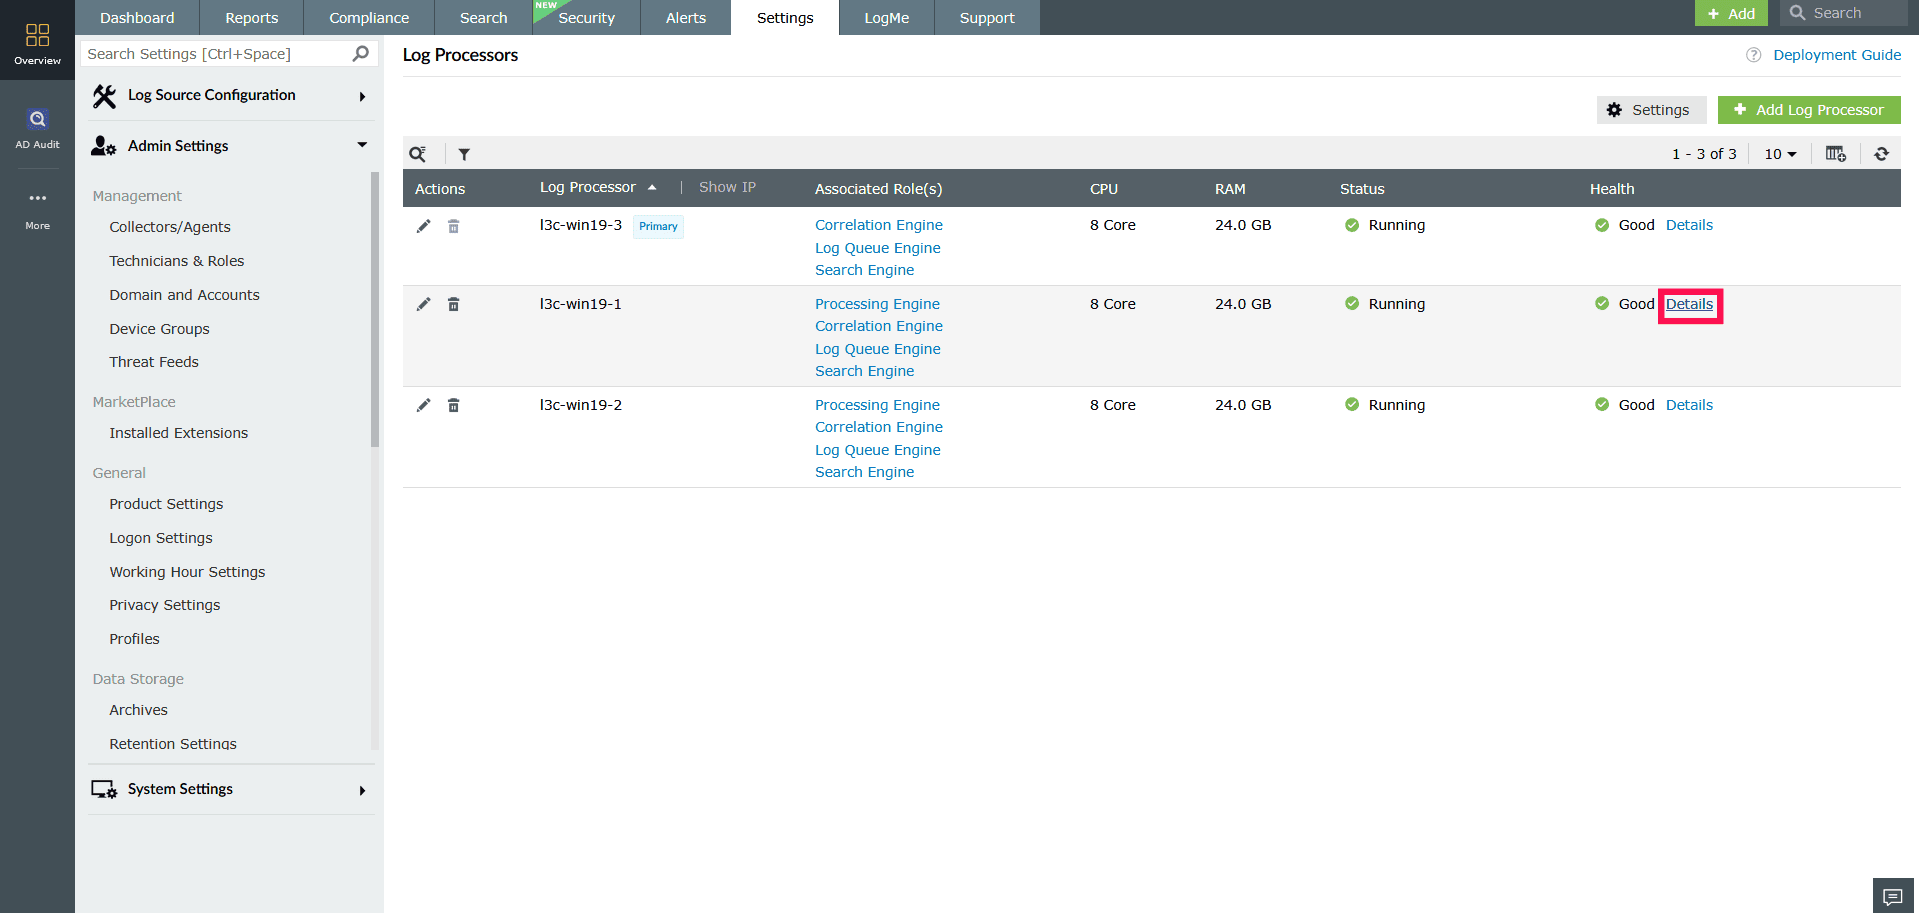
To view detailed metrics:
Click Details next to a Log Processor to view detailed information about its configuration, performance, and module health. The details are grouped under the following tabs.
- Health
Shows the status of modules such as Archive, Index, Alerts, and Workflow. Each module is marked as active, inactive, or not reachable.
NOTE You can click the Detailed Usage Report link next to the Correlation module to view in-depth performance statistics and usage history.
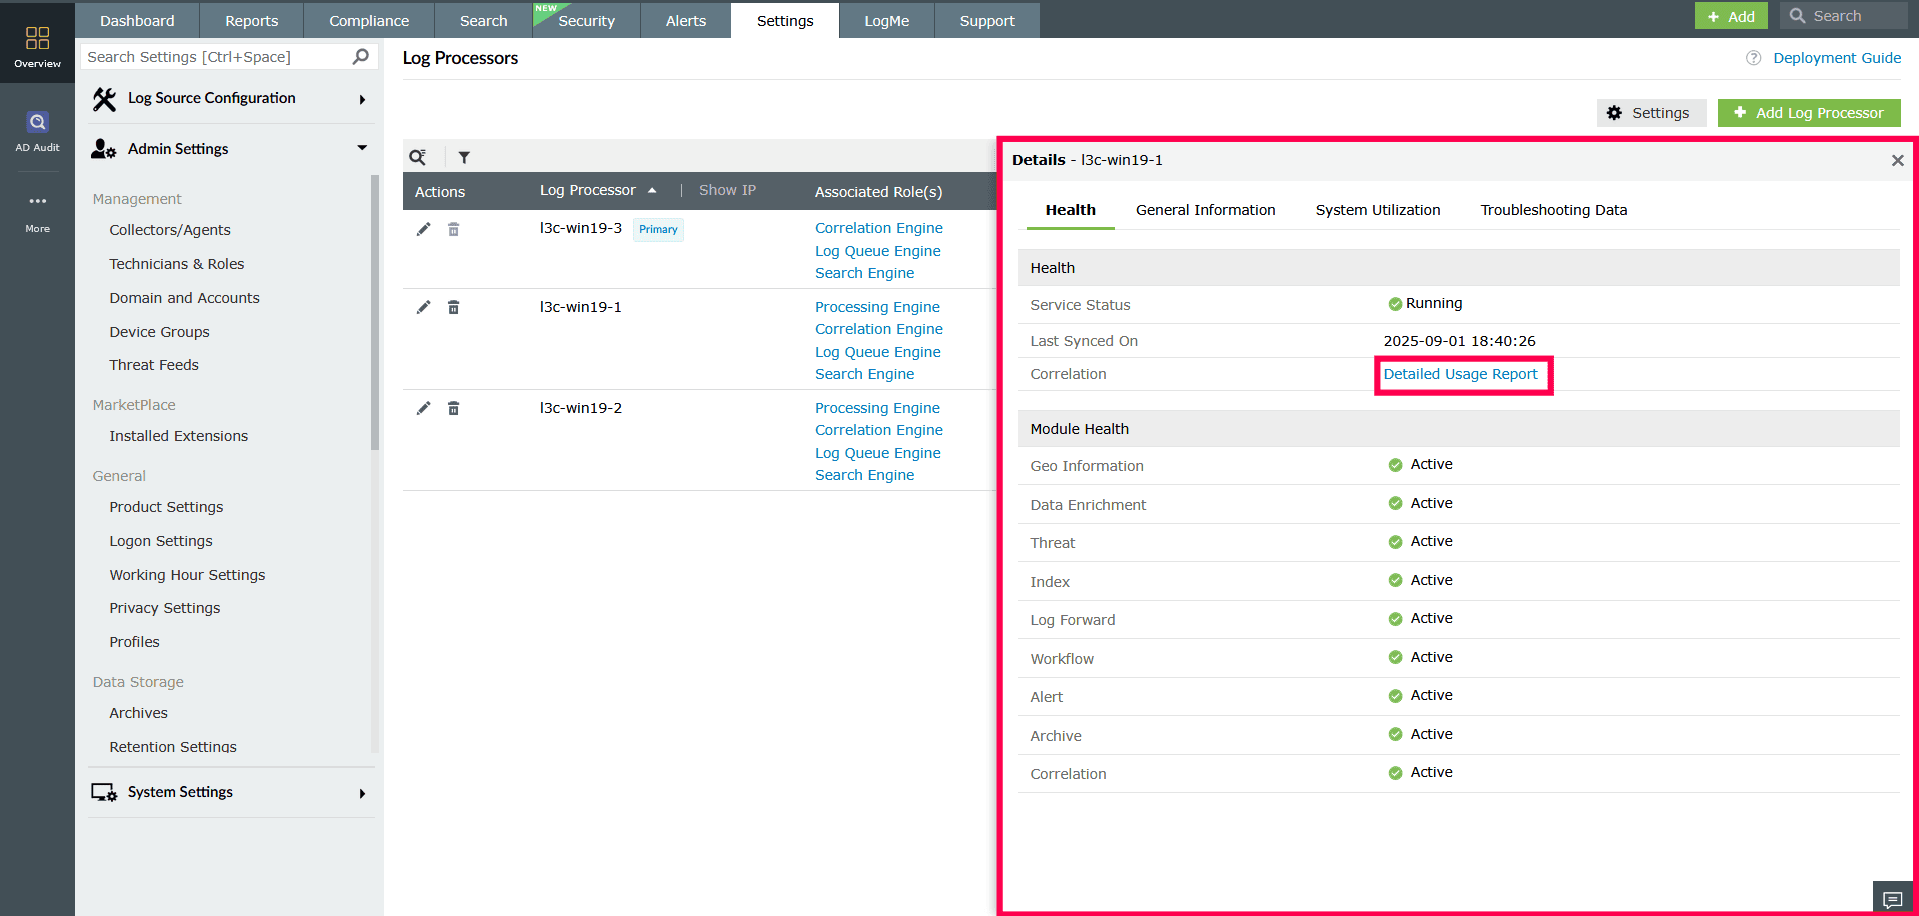
Figure 12: Viewing health metrics of Log Processors - General Information
Displays system-level information including display name, IP address, operating system, JVM memory usage, working directory, number of CPU cores, total RAM, system uptime, and product version.
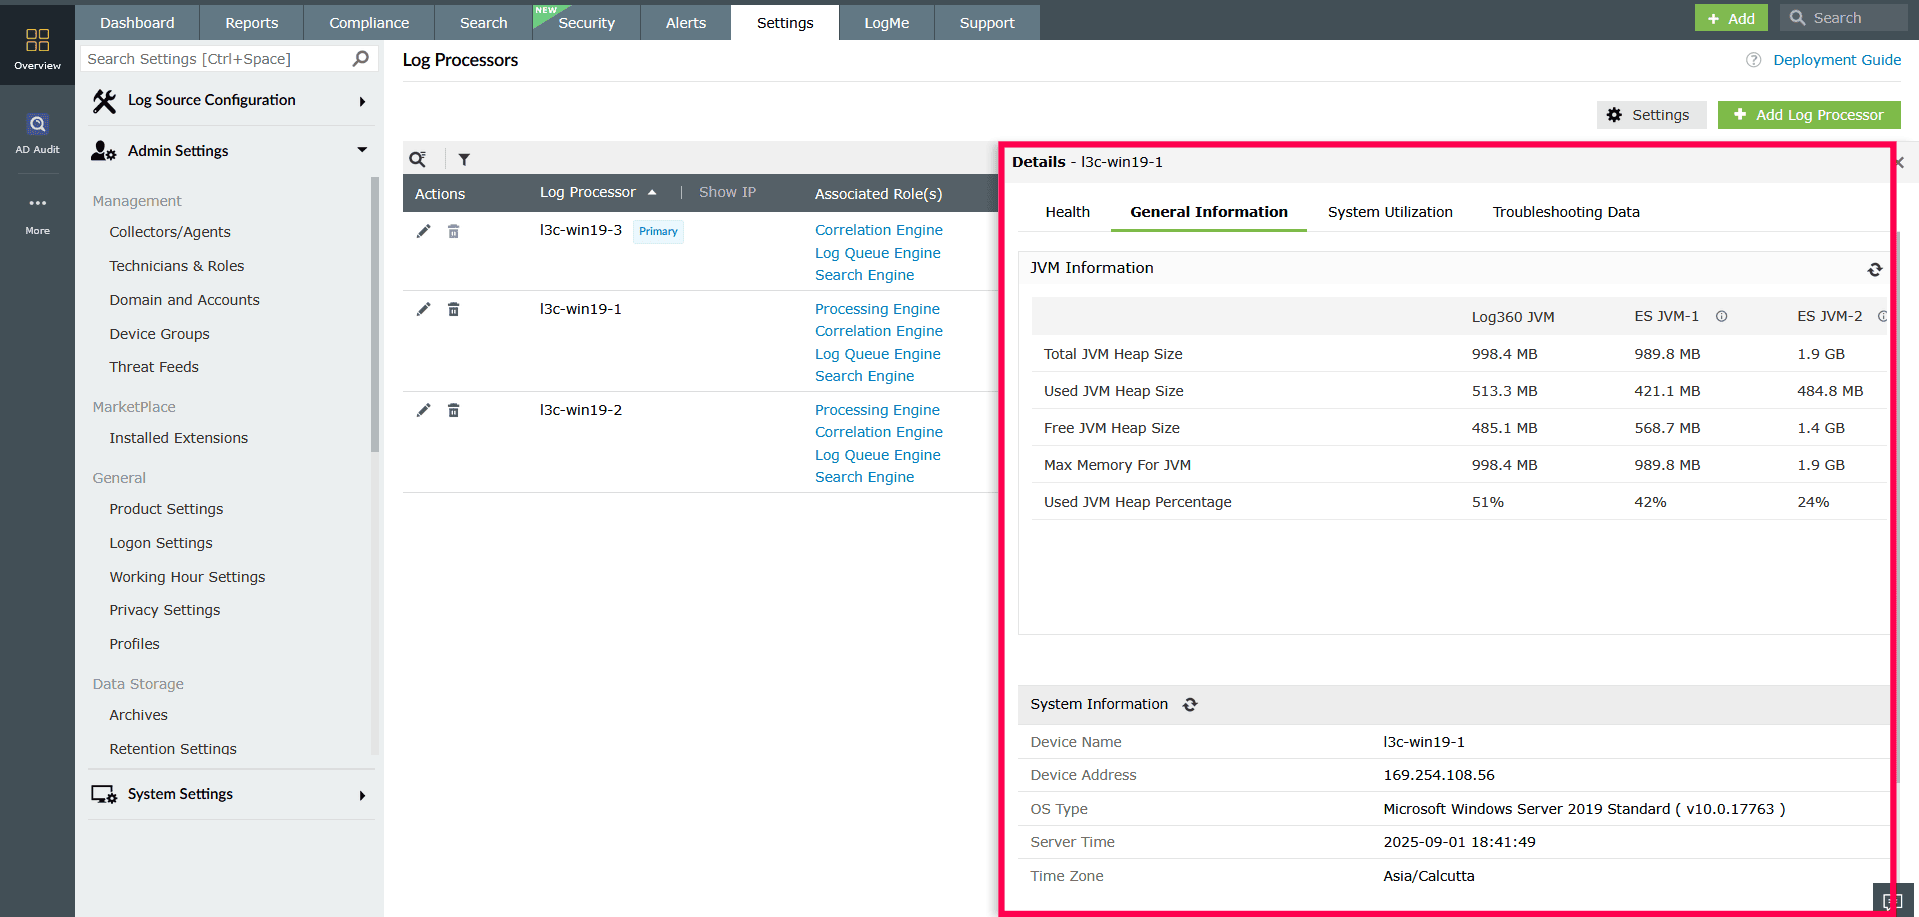
Figure 13: Viewing system information of a Log Processor - System Utilization
Provides real-time metrics including total disk usage categorized by raw logs, index, archive, and database, along with CPU usage and indexed log count.
- In the System Utilization tab, you can switch between Today and Trend views.
- The Today view shows current usage metrics.
- The Trend view allows you to analyze data for up to the last 30 days.
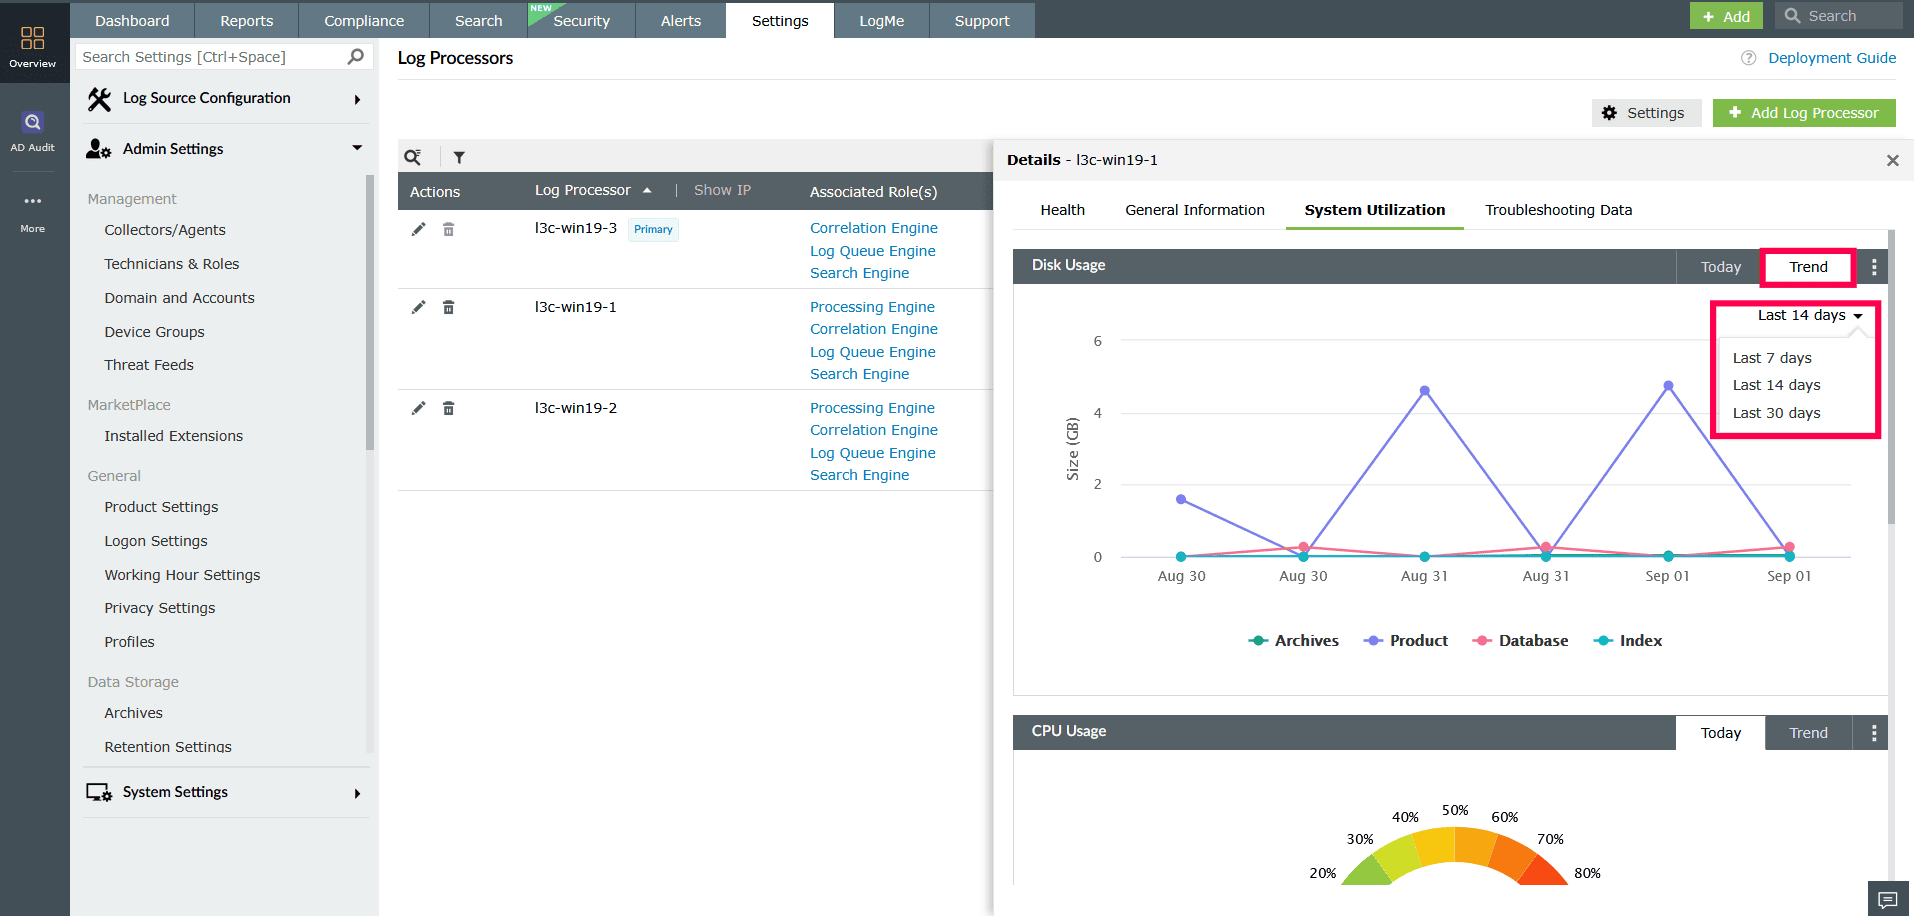
Figure 14: Monitoring resource usage in a Log Processor - Click the
 icon in the top-right corner to refresh the chart or pin it to the dashboard for easier monitoring.
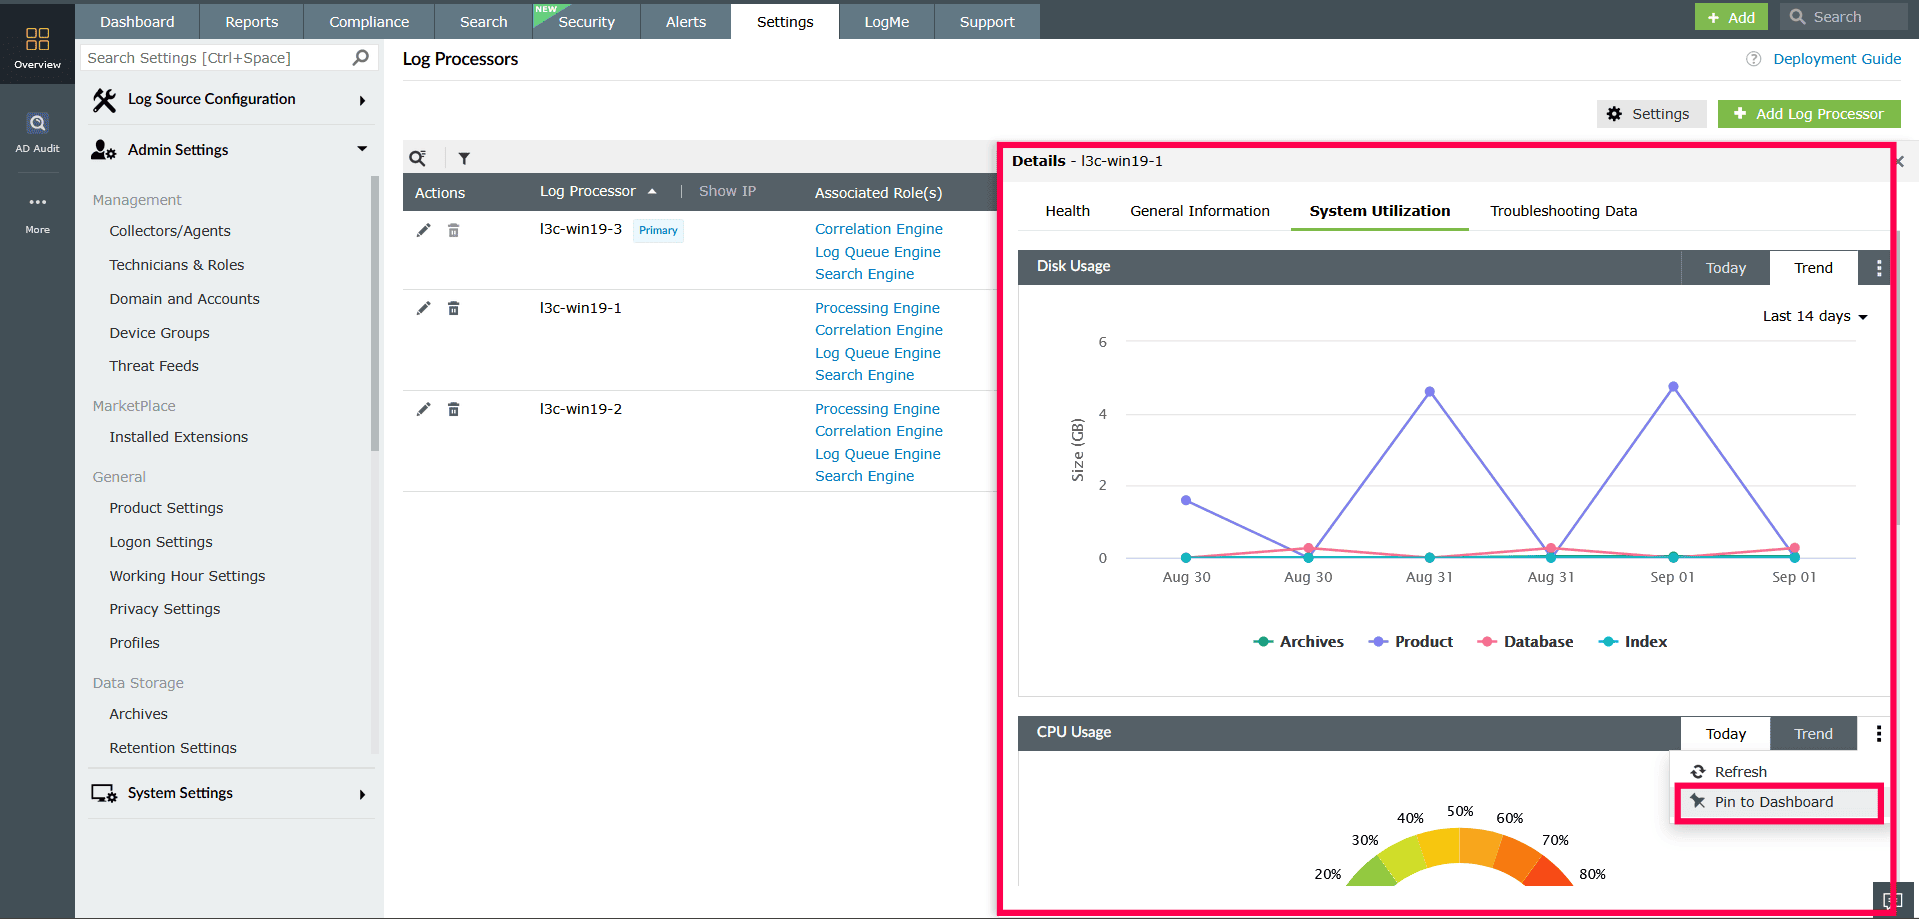
Figure 15: Monitoring resource usage in a Log Processor
- In the System Utilization tab, you can switch between Today and Trend views.
- Troubleshooting Data
This section allows you to generate and download diagnostic files such as server logs, thread dumps, and memory dumps.
- Select the required options from the checklist and click Generate to initiate the process.
NOTE Agent logs are generated only for the Primary Log Processor.
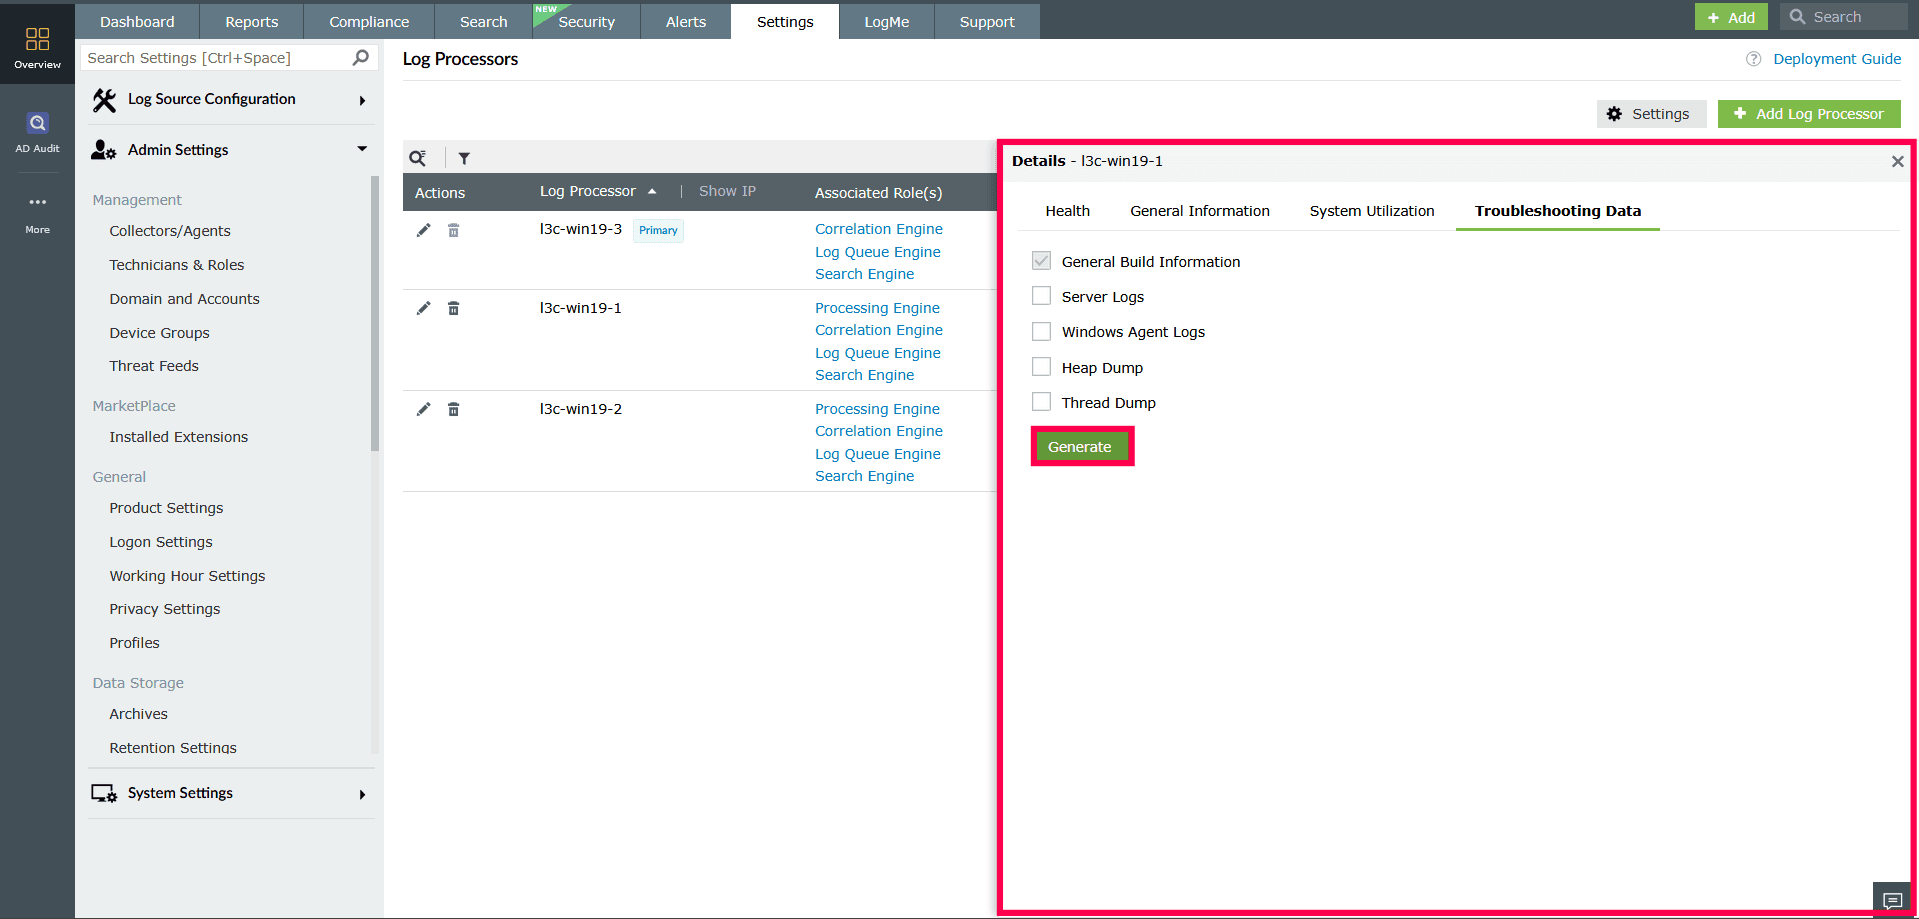
Figure 16: Generating diagnostic files for troubleshooting
Filtering Log Processors
Use the filter bar in the Log Processors page to view processors based on their assigned roles and current operational status.
To apply filters:
- In the Log Processor page, select
 icon above the Log Processors list.
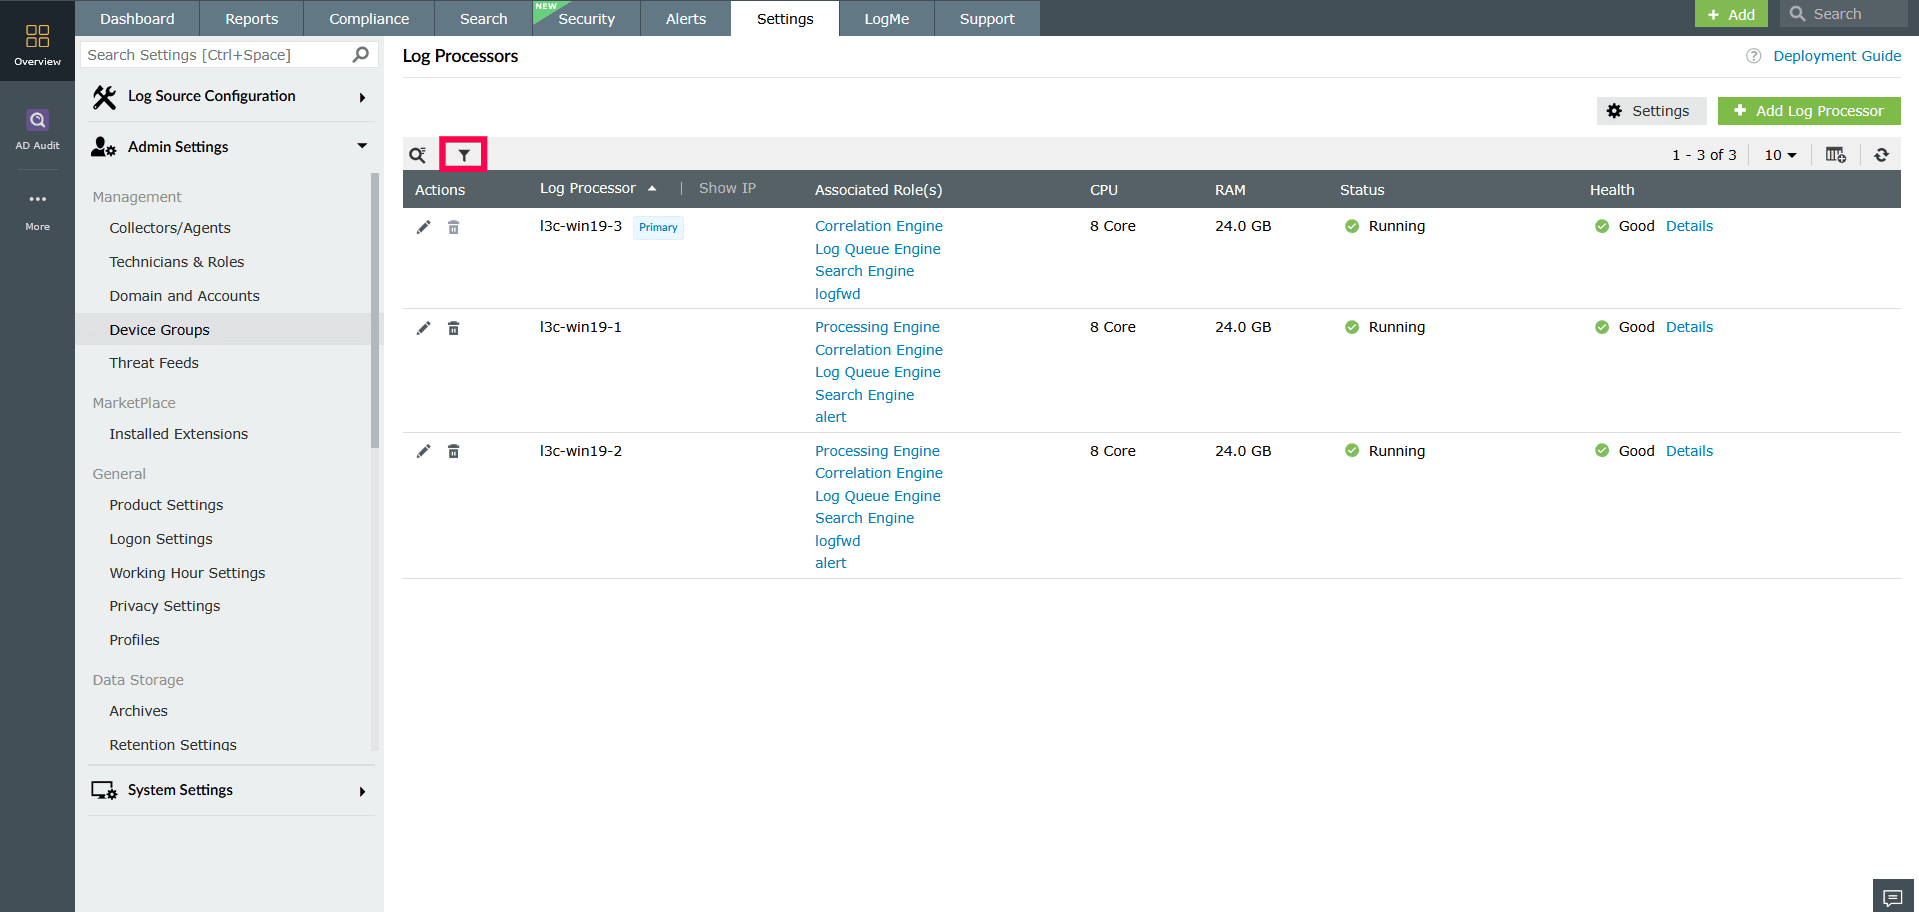
Figure 17: Applying filters to Log Processors - Use the Roles filter to view processors assigned to a specific role, or select All to display processors across all roles.
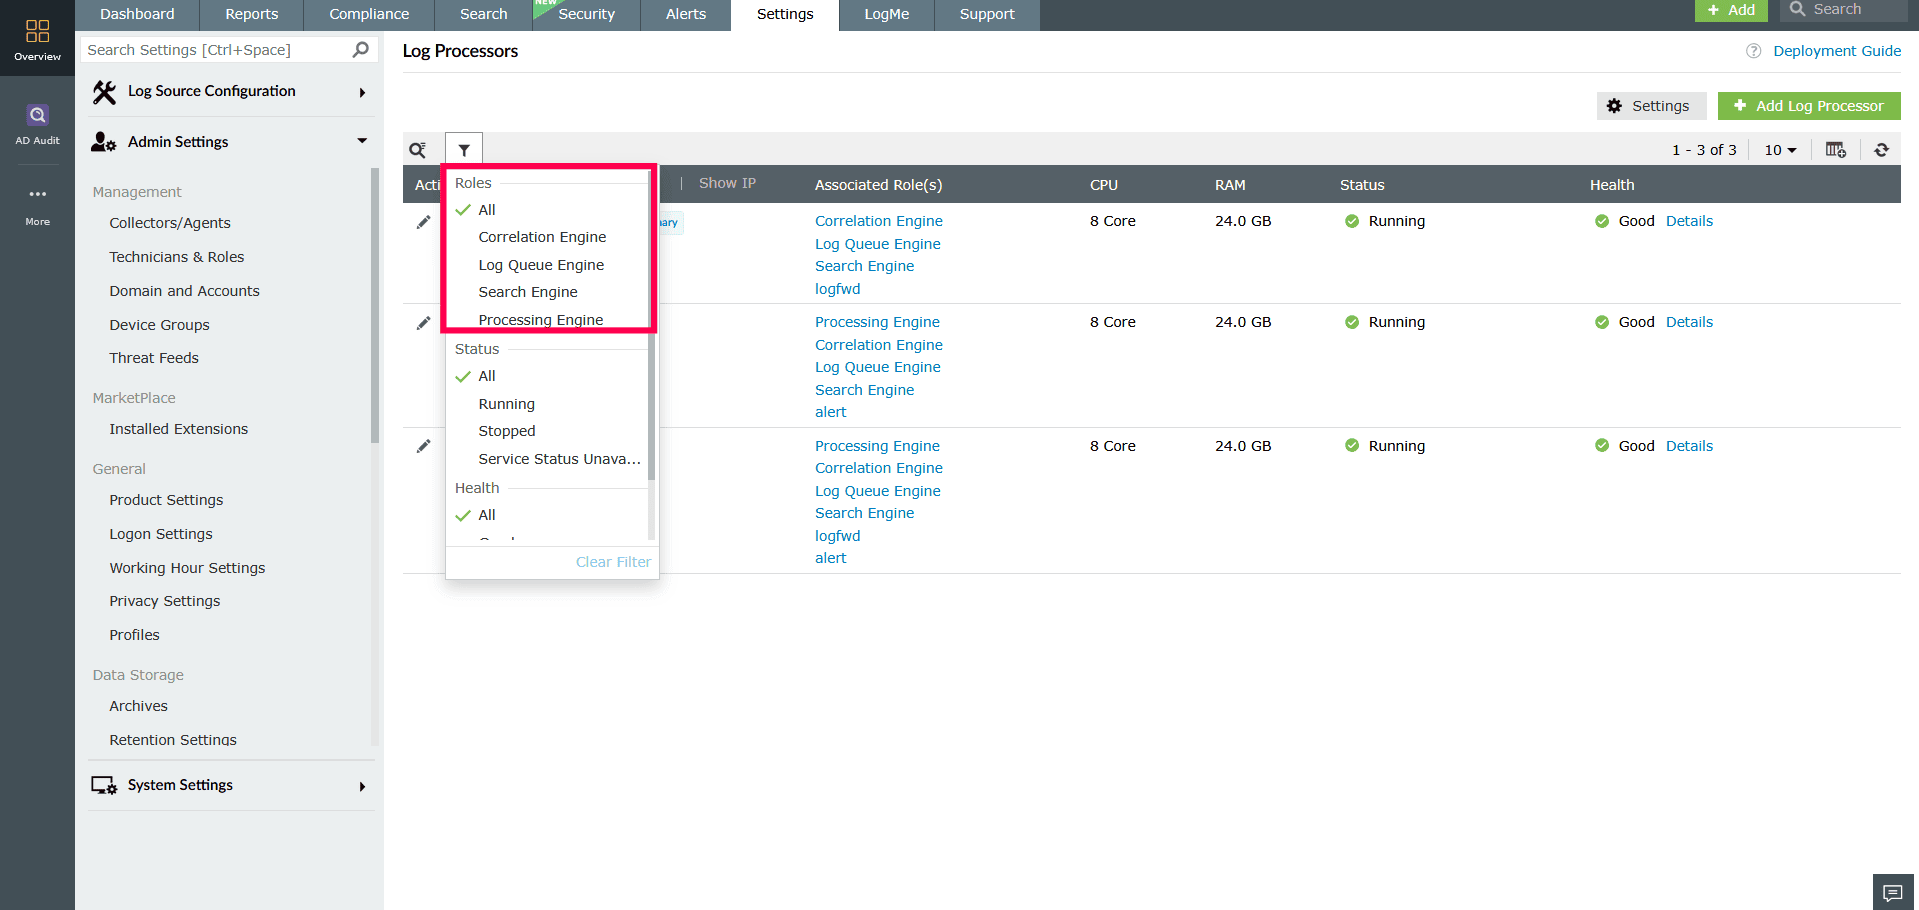
Figure 18: Applying filters to Log Processors - Use the Status filter to display Log Processors with a specific status, or choose All to view processors of all statuses.
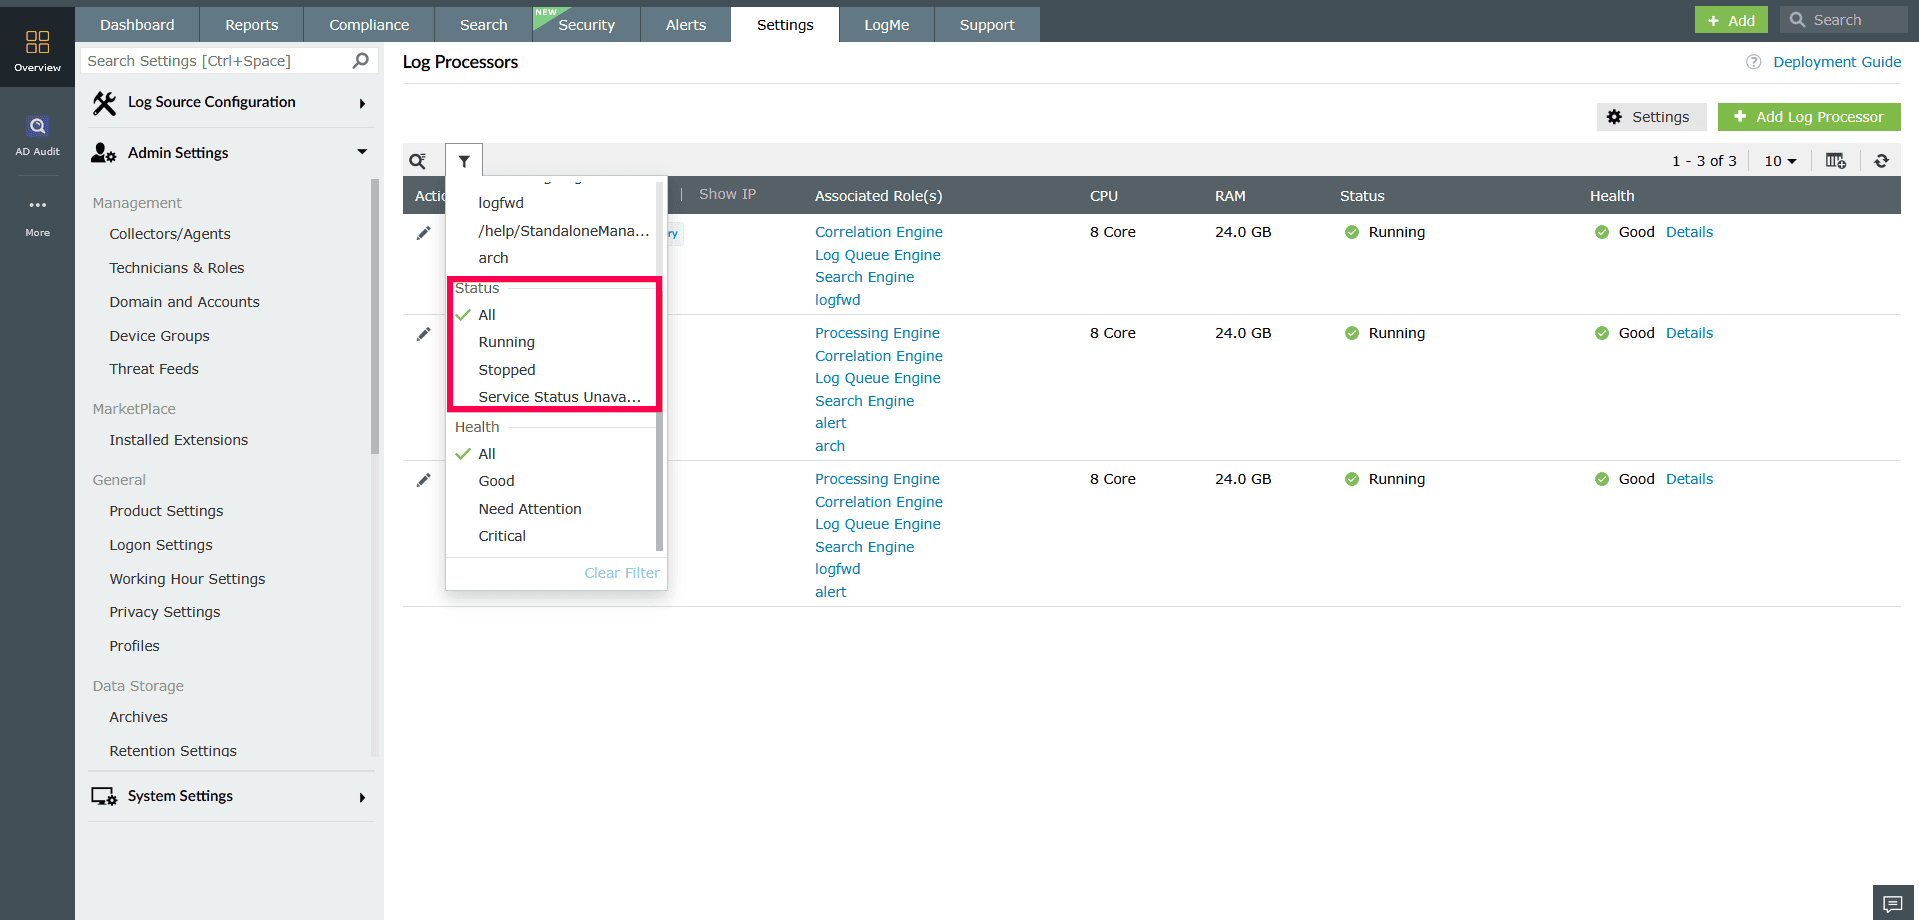
Figure 19: Applying filters to Log Processors - Use the Health filter to display Log Processors with a specific health status, or select All to include processors of all health states.
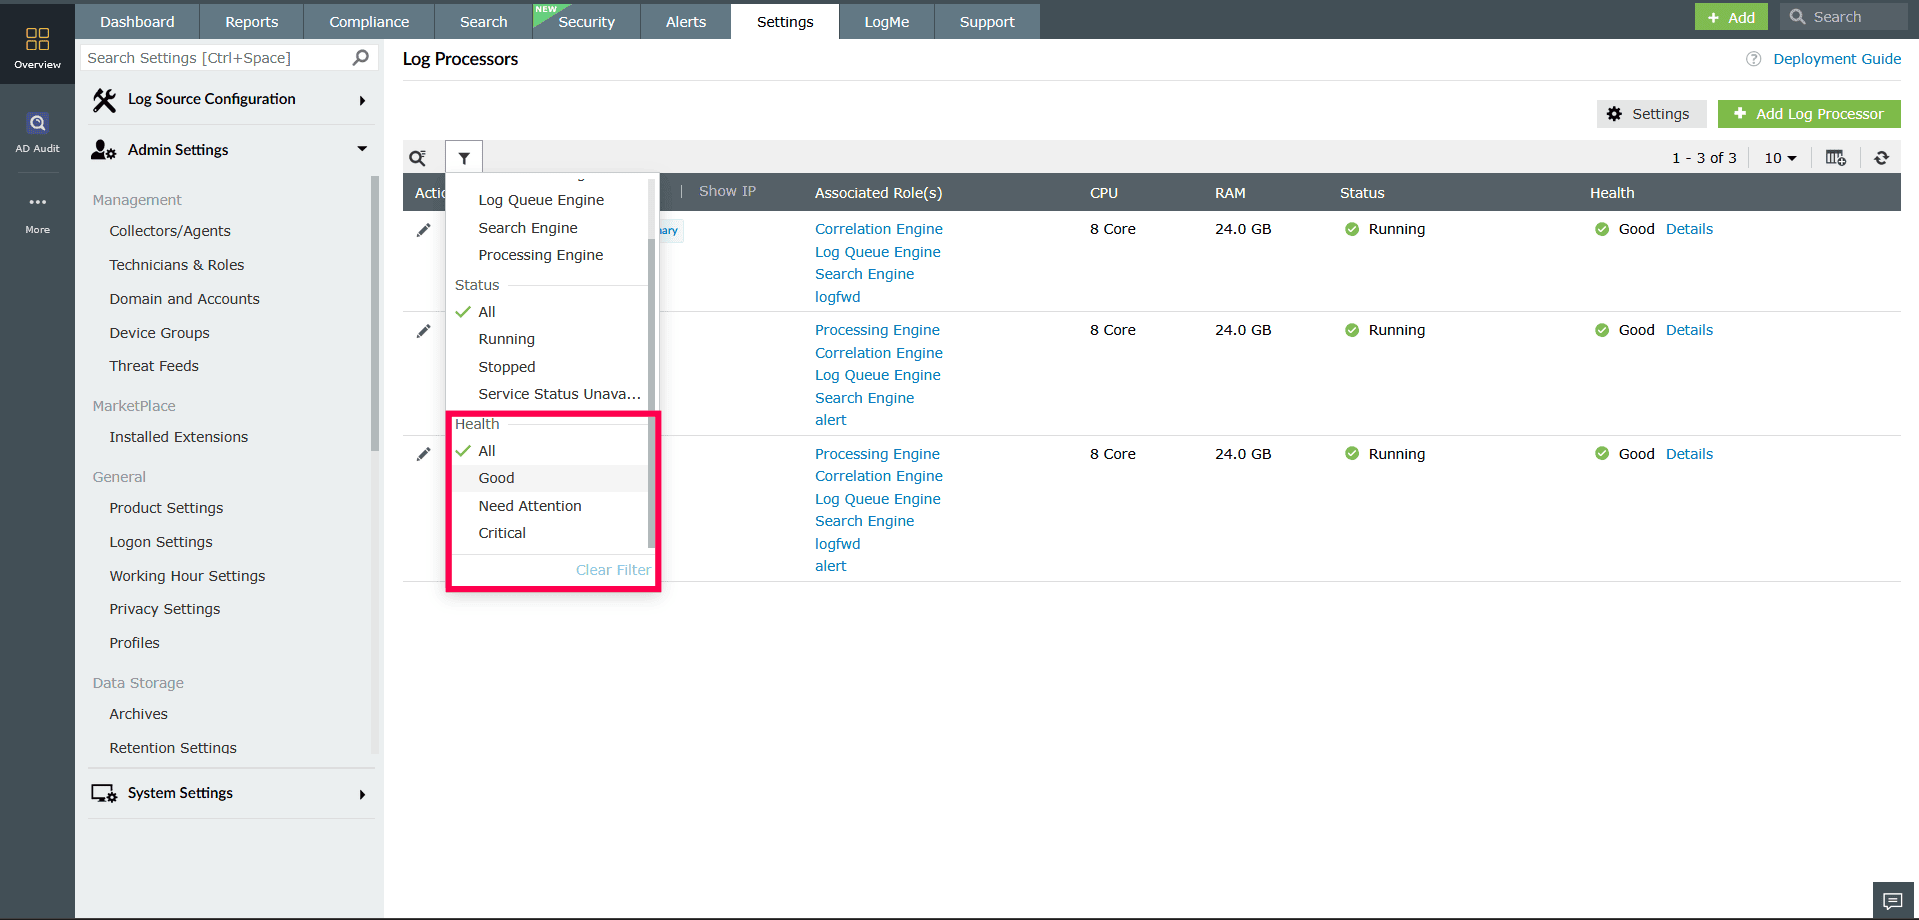
- The list updates automatically to reflect your selections.
NOTE You can also use the
 icon near the filter bar to search for a Log Processor by name.
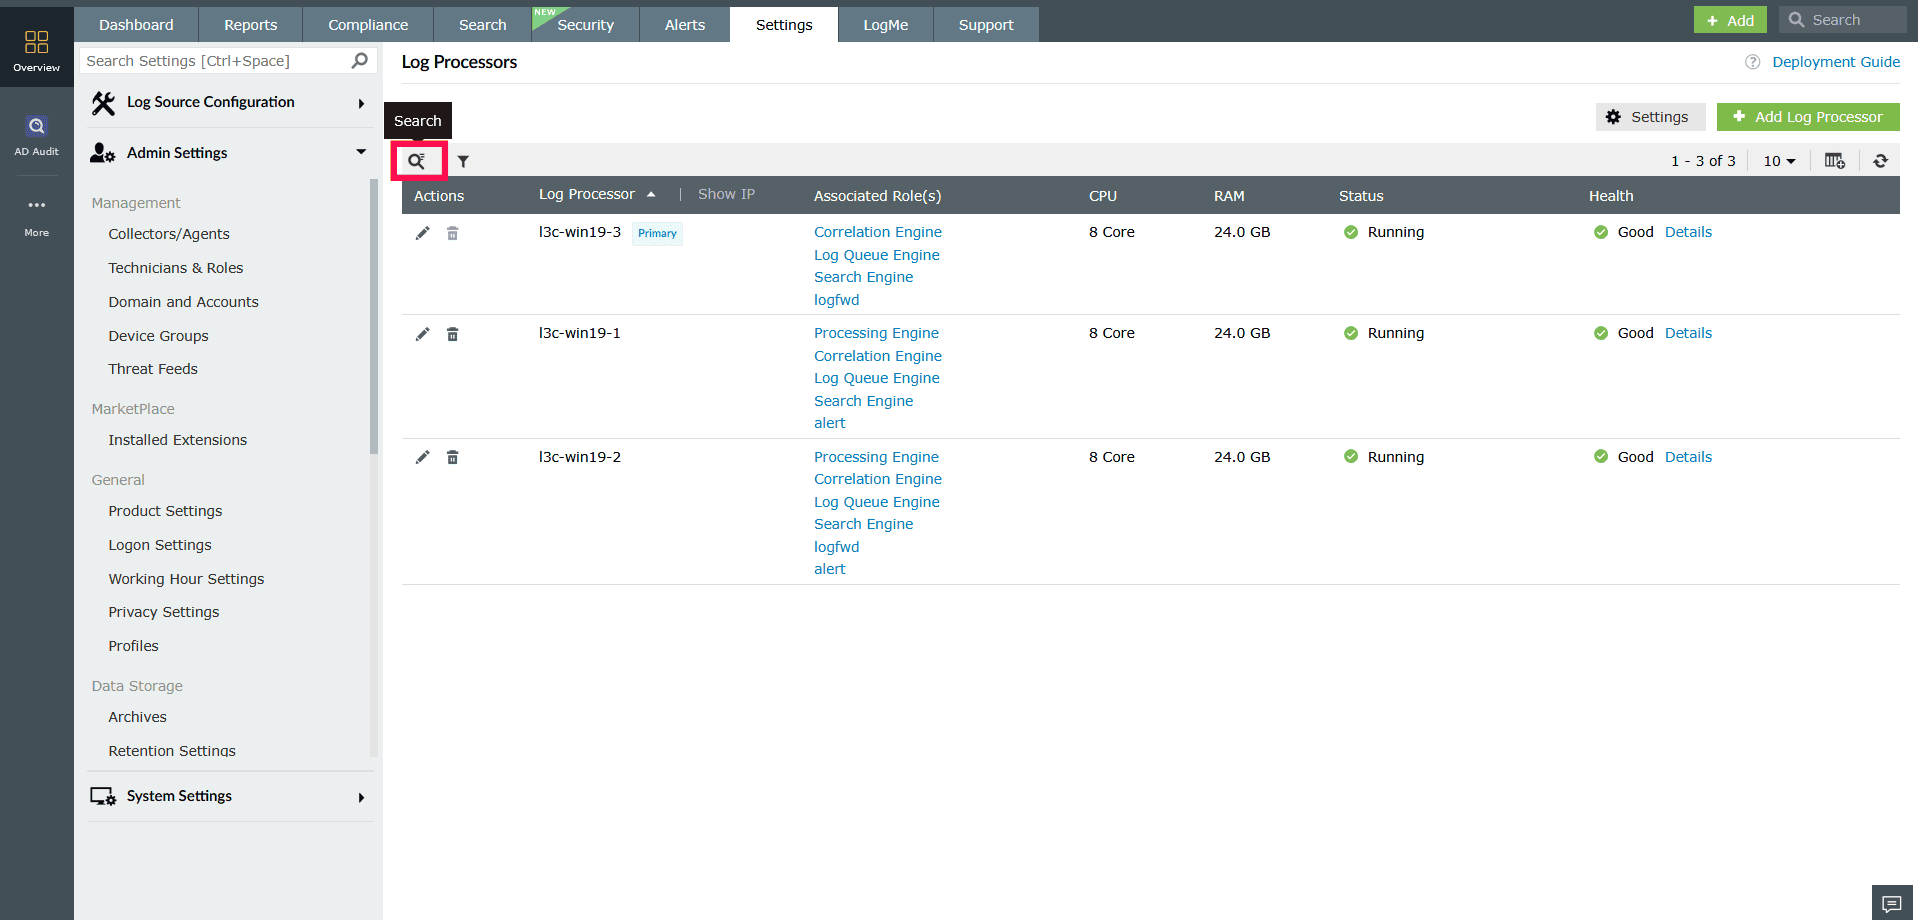
Figure 20: Locating specific Log Processors using Search
Managing roles
- In the Log Processors page, click any role listed under Associated Role(s).
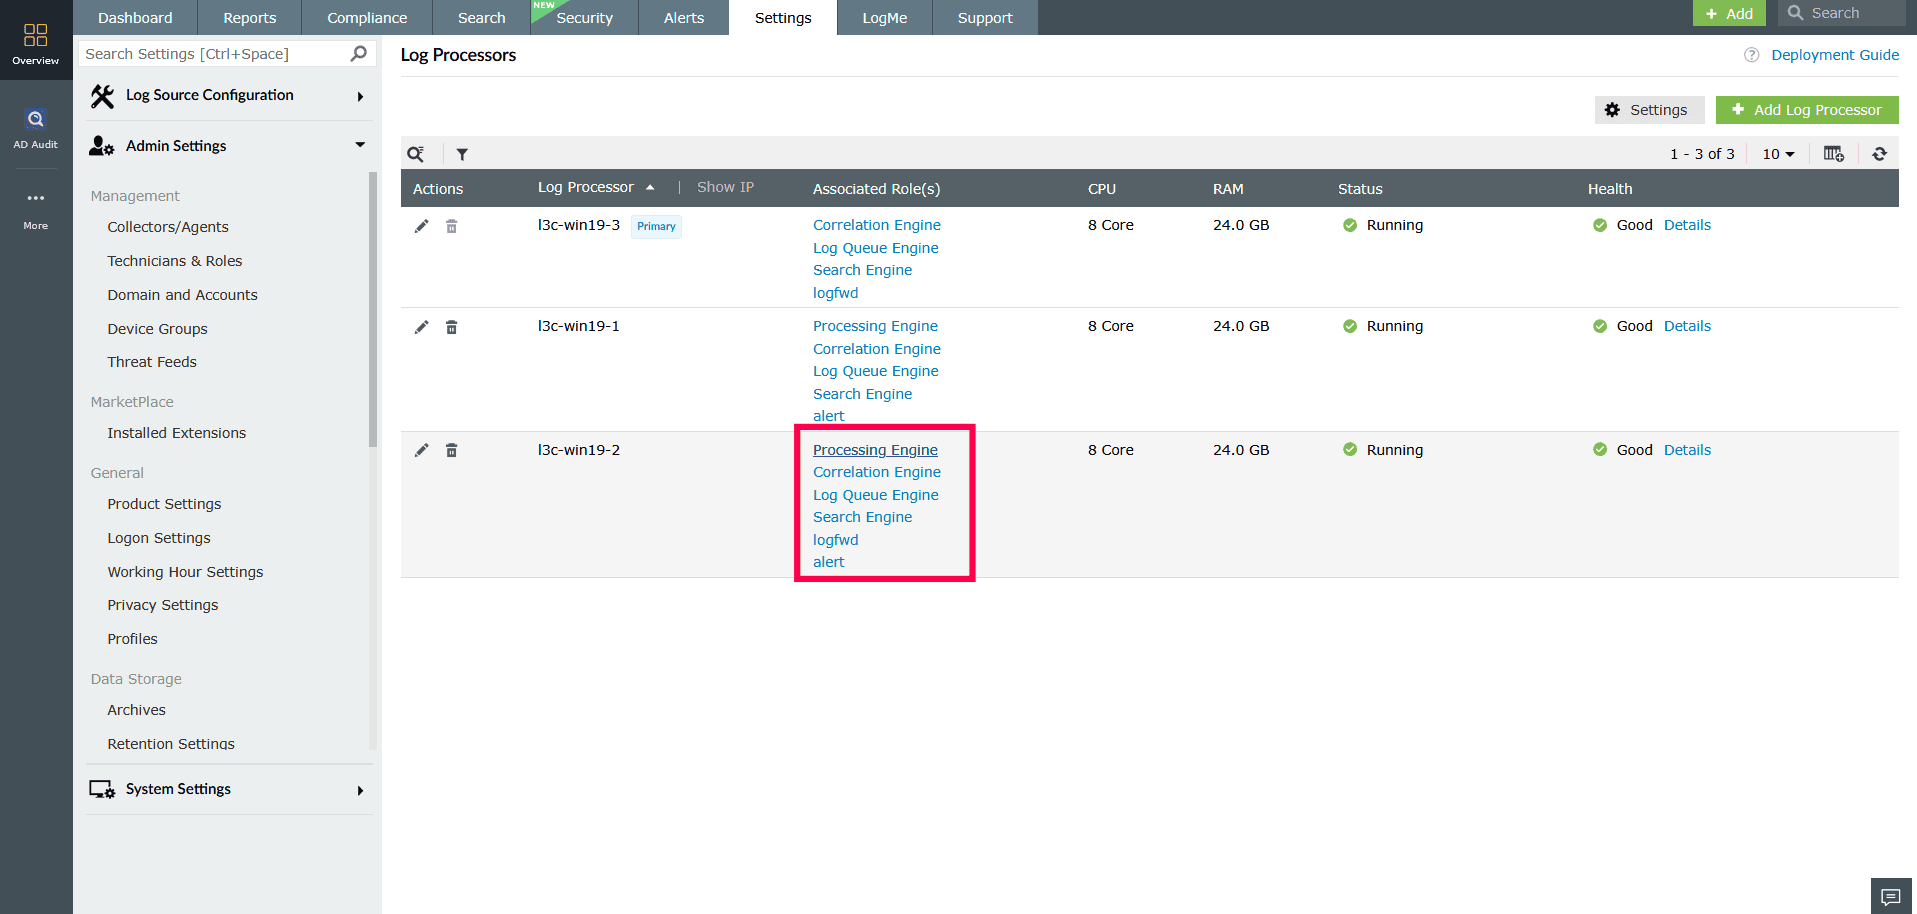
Figure 21: Managing roles - The Manage Roles window will open for the selected processor.
- In the Manage Roles window, you can view the list of modules assigned to each role.
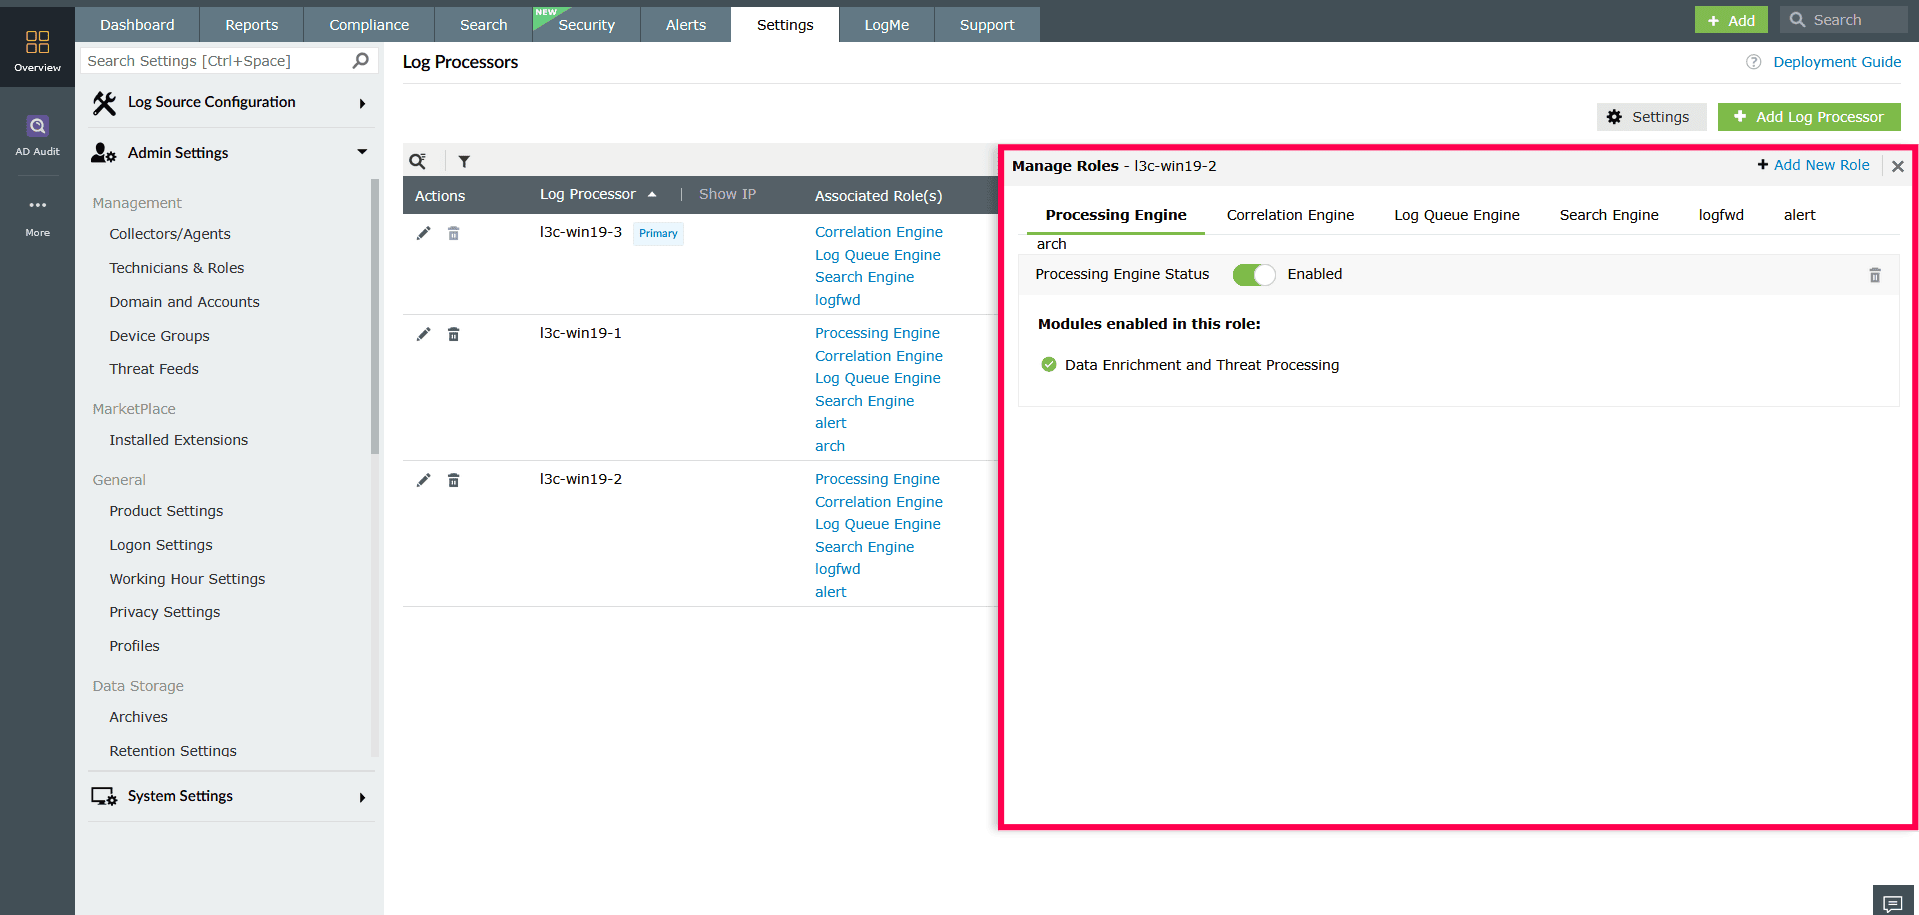
Figure 22: Managing roles NOTE Refer to this section to modify the roles assigned to a Log Processor. The Log Queue Engine and Search Engine roles can be disabled only here.
Adding a custom role
- In the Manage Roles window, click Add New Role.
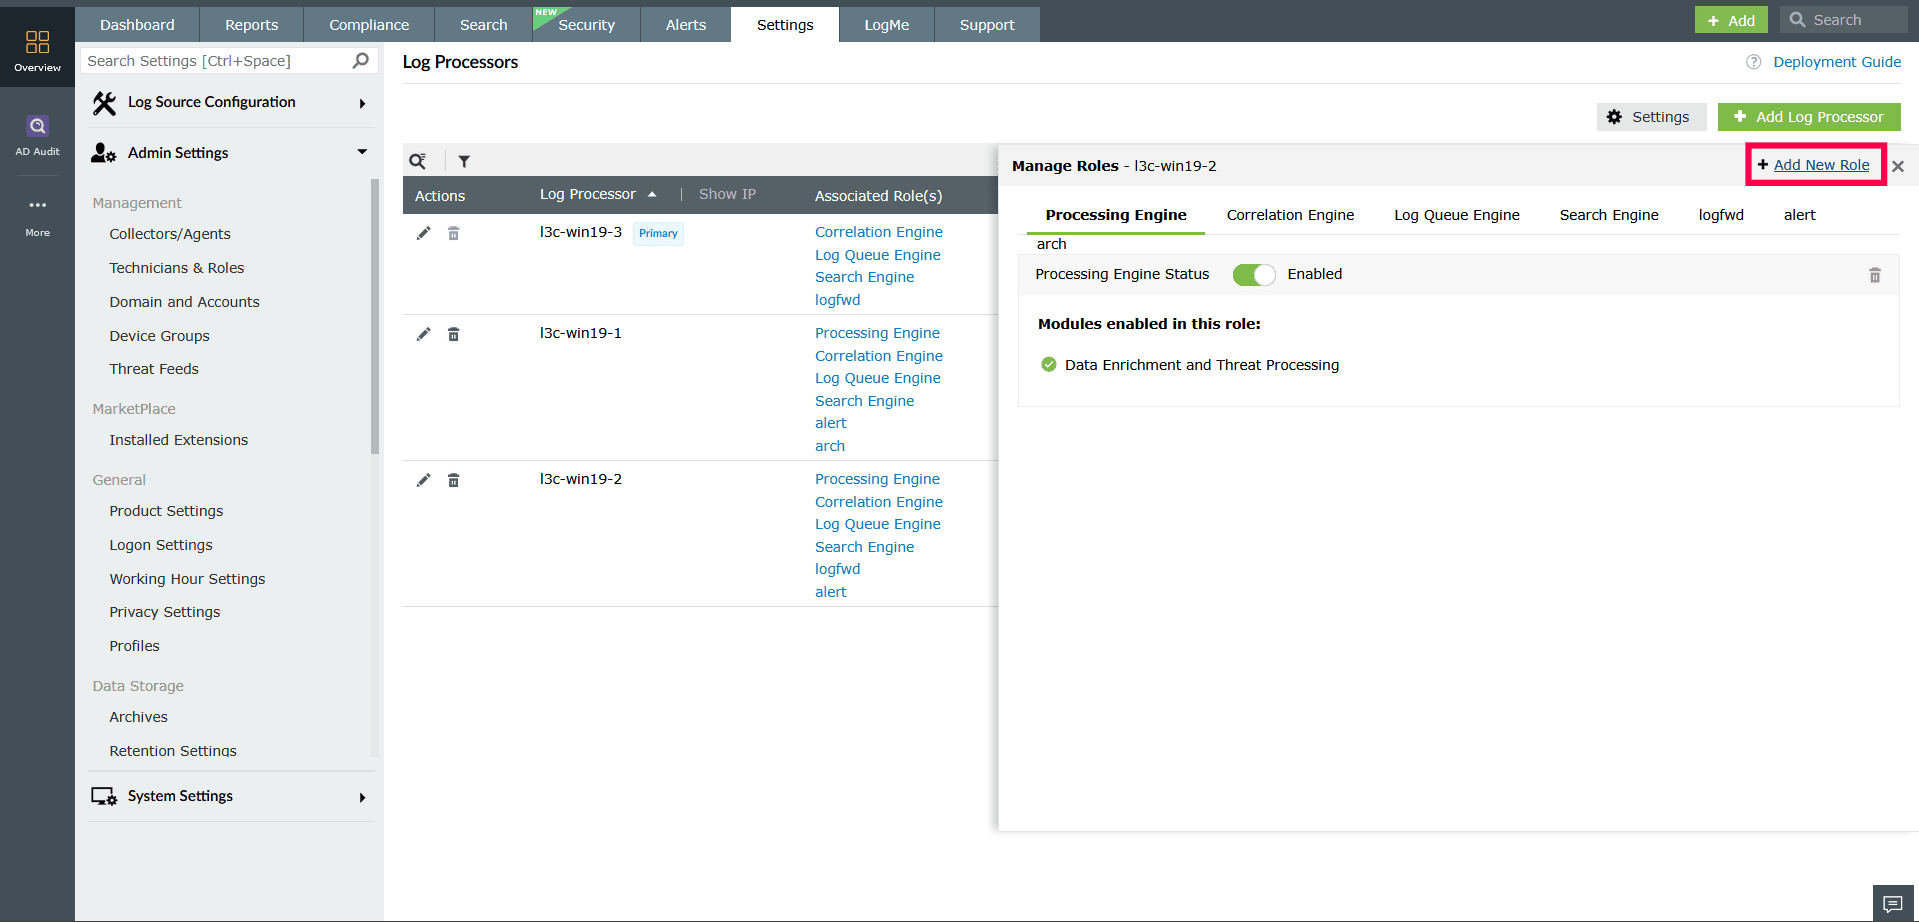
Figure 23: Adding a new role - Enter a name for the new role.
- Select the required modules from the list.
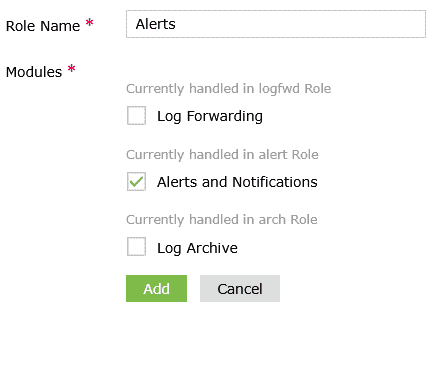
Figure 24: Adding a new role - Click Add to create the role.
- Click Proceed in the confirmation popup to complete the role creation.
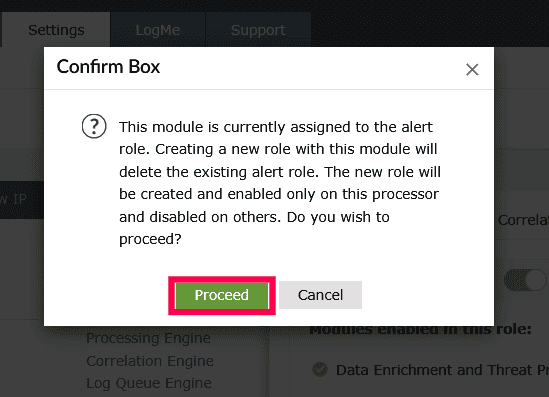
Figure 25: Adding a new role
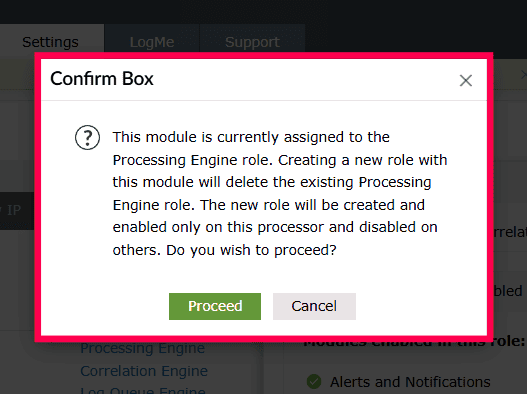
If a selected module is already assigned to another role, it will be removed from the existing role and reassigned to the new one.
Refer to the following examples to understand how this reassignment works:
-If the Log Archive module is currently part of the Processing Engine role and the Alerts and Notification module is part of the Alerts role, and you include both while creating a new role named Archive and Alerts, the modules will be moved from their existing roles to the new role.
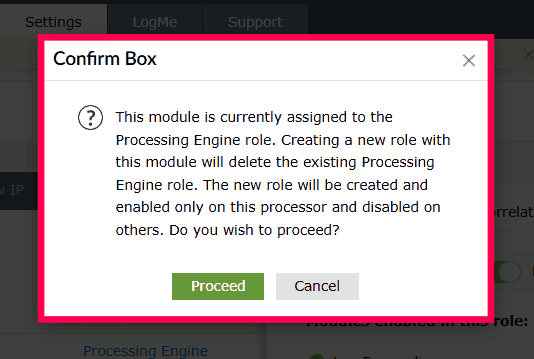
- If the Log Archive module is currently part of the Processing Engine role, Log Forwarding is part of the Log Forwarding role, and Alerts and Notification is part of the Alerts role, and all three modules are selected to create a new role named Archive and Alerts, then:
- Log Archive will be removed from the Processing Engine role,
- Log Forwarding will be deleted from the Log Forwarding role,
- Alerts and Notification will be deleted from the Alerts role, and all three (Log Archive, Log Forwarding, Alerts and Notification) will be reassigned to the new role Archive and Alerts.
Editing custom roles
- In the Manage Roles window, go to the role tab you want to edit.
- Click the icon on the top right corner.
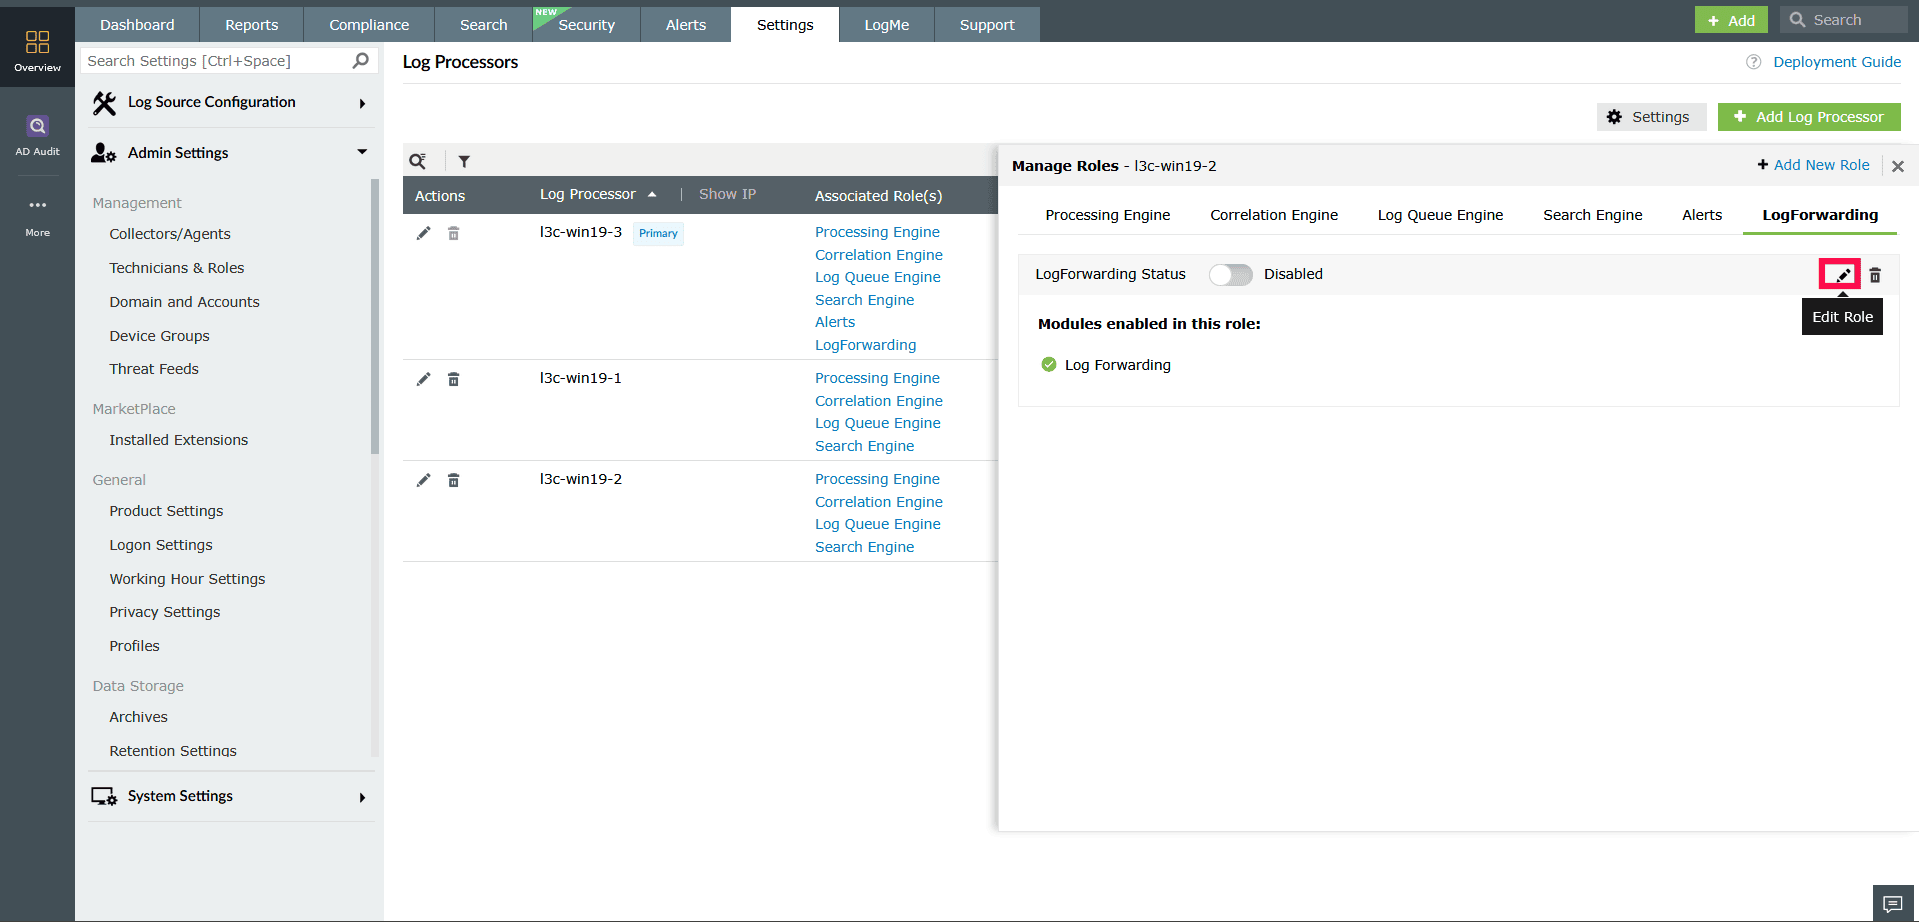
Figure 28: Editing custom modules - In the Edit Role panel, select or deselect the modules as needed.
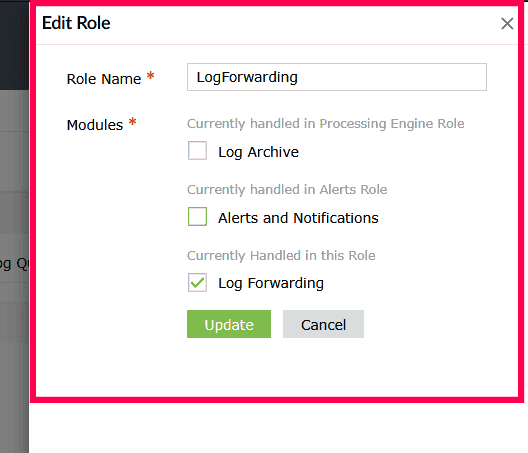
Figure 29: Editing custom modules - Click Update to save the changes.
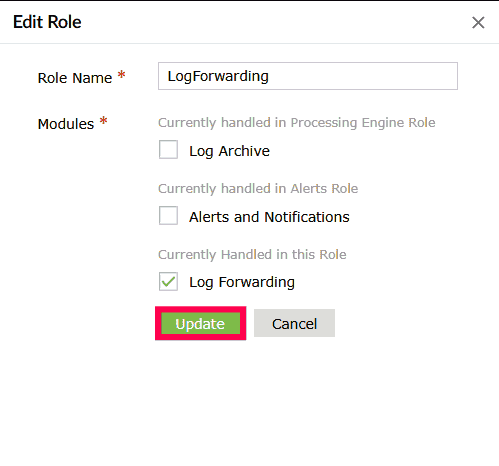
Figure 30: Editing custom modules
Deleting Log Processors
When managing Log Processors, you can delete a specific Log Processor based on your operational requirements. If you prefer to retain the Log Processor but temporarily stop its functions, you also have the option to disable specific roles.
Disabling roles
You can disable certain roles, such as the Correlation Engine, while keeping essential roles like the Log Queue Engine and Search Engine enabled. This allows the Log Processor to continue handling core operations such as queuing and indexing, even if other functions are disabled.
To disable roles:
- In the Log Processors page, click the
 icon next to the Log Processor you want to modify.
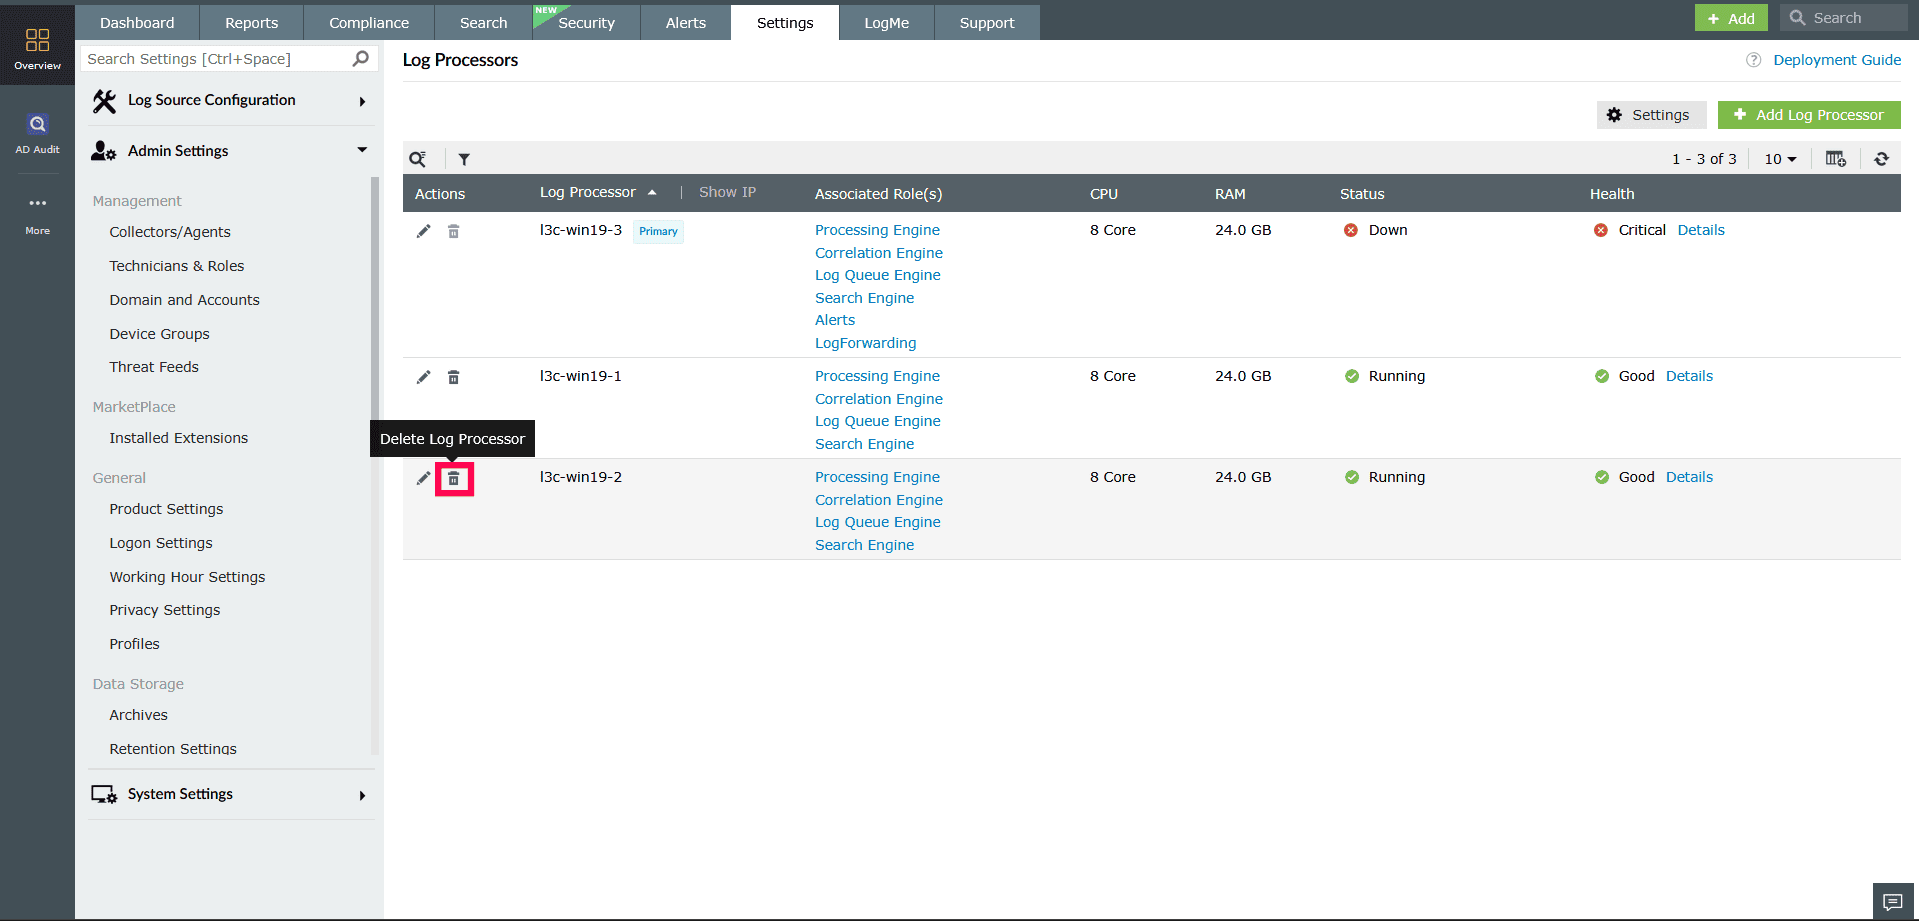
Figure 31: Disabling roles in a Log Processor - In the Confirm Deletion popup, click Disable Roles.
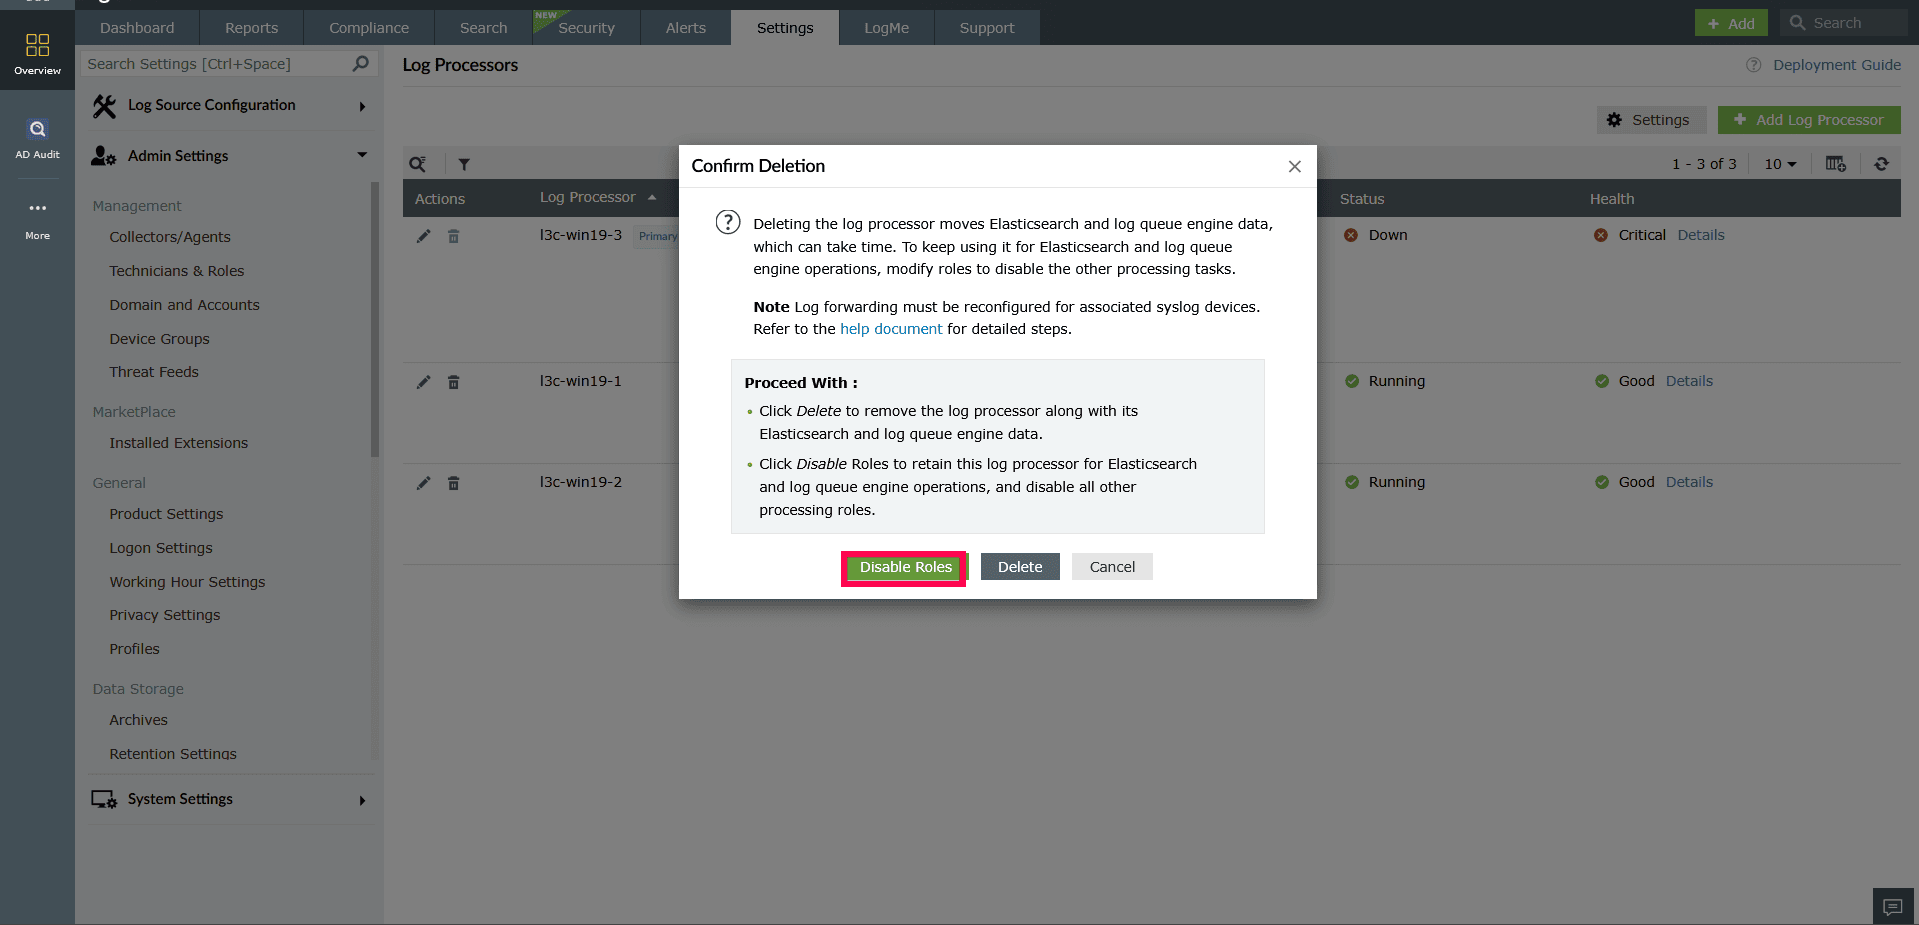
Figure 32: Disabling roles in a Log Processor
Deleting Log Processors
If a Log Processor is no longer required, you can delete it completely along with all its associated roles and data.
To delete a Log Processor:
- In the Log Processors page, click the icon next to the processor.
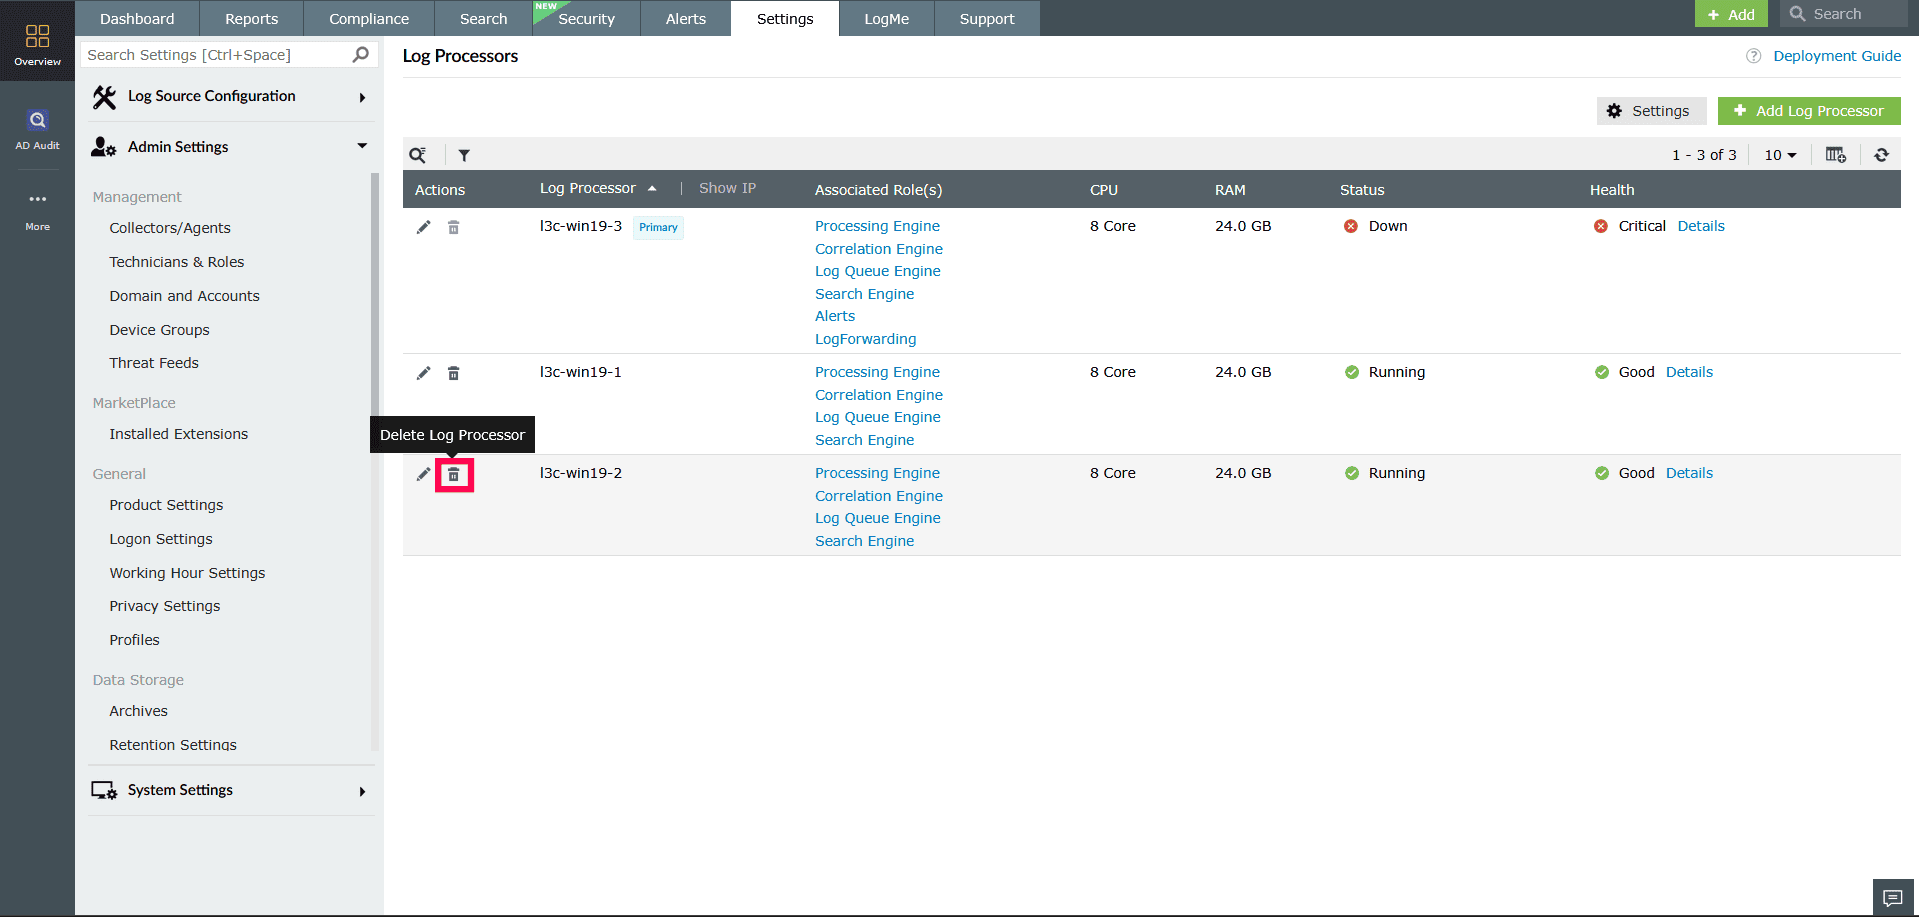
Figure 33: Deleting a Log Processor - In the Confirm Deletion popup, click Delete.
NOTE After deletion, you must reconfigure log forwarding for any syslog devices that were associated with the deleted Log Processor.
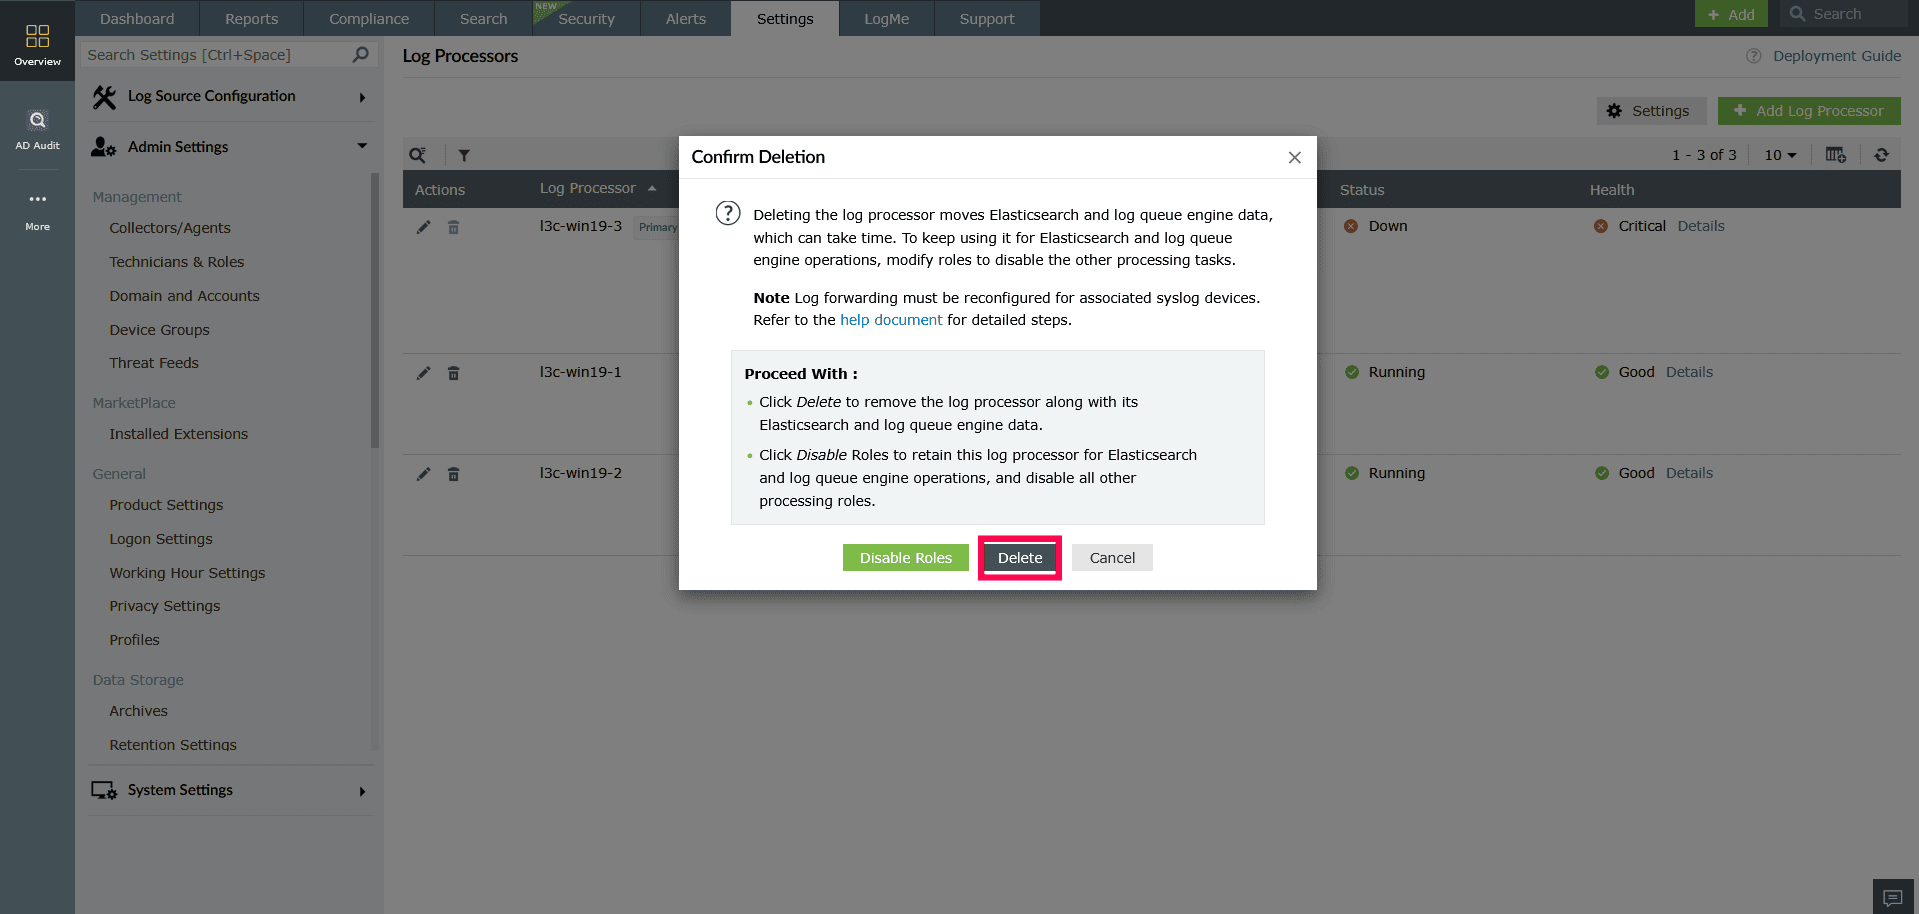
Figure 34: Deleting a Log Processor NOTE Deleting a Log Processor is irreversible, removes all associated Elasticsearch and Log Queue Engine data, may take time based on the volume of stored data, and requires.
Deleting custom roles in a Log Processor
- Select the tab for the role you want to remove
- Click the icon in the top-right corner of the role tab.
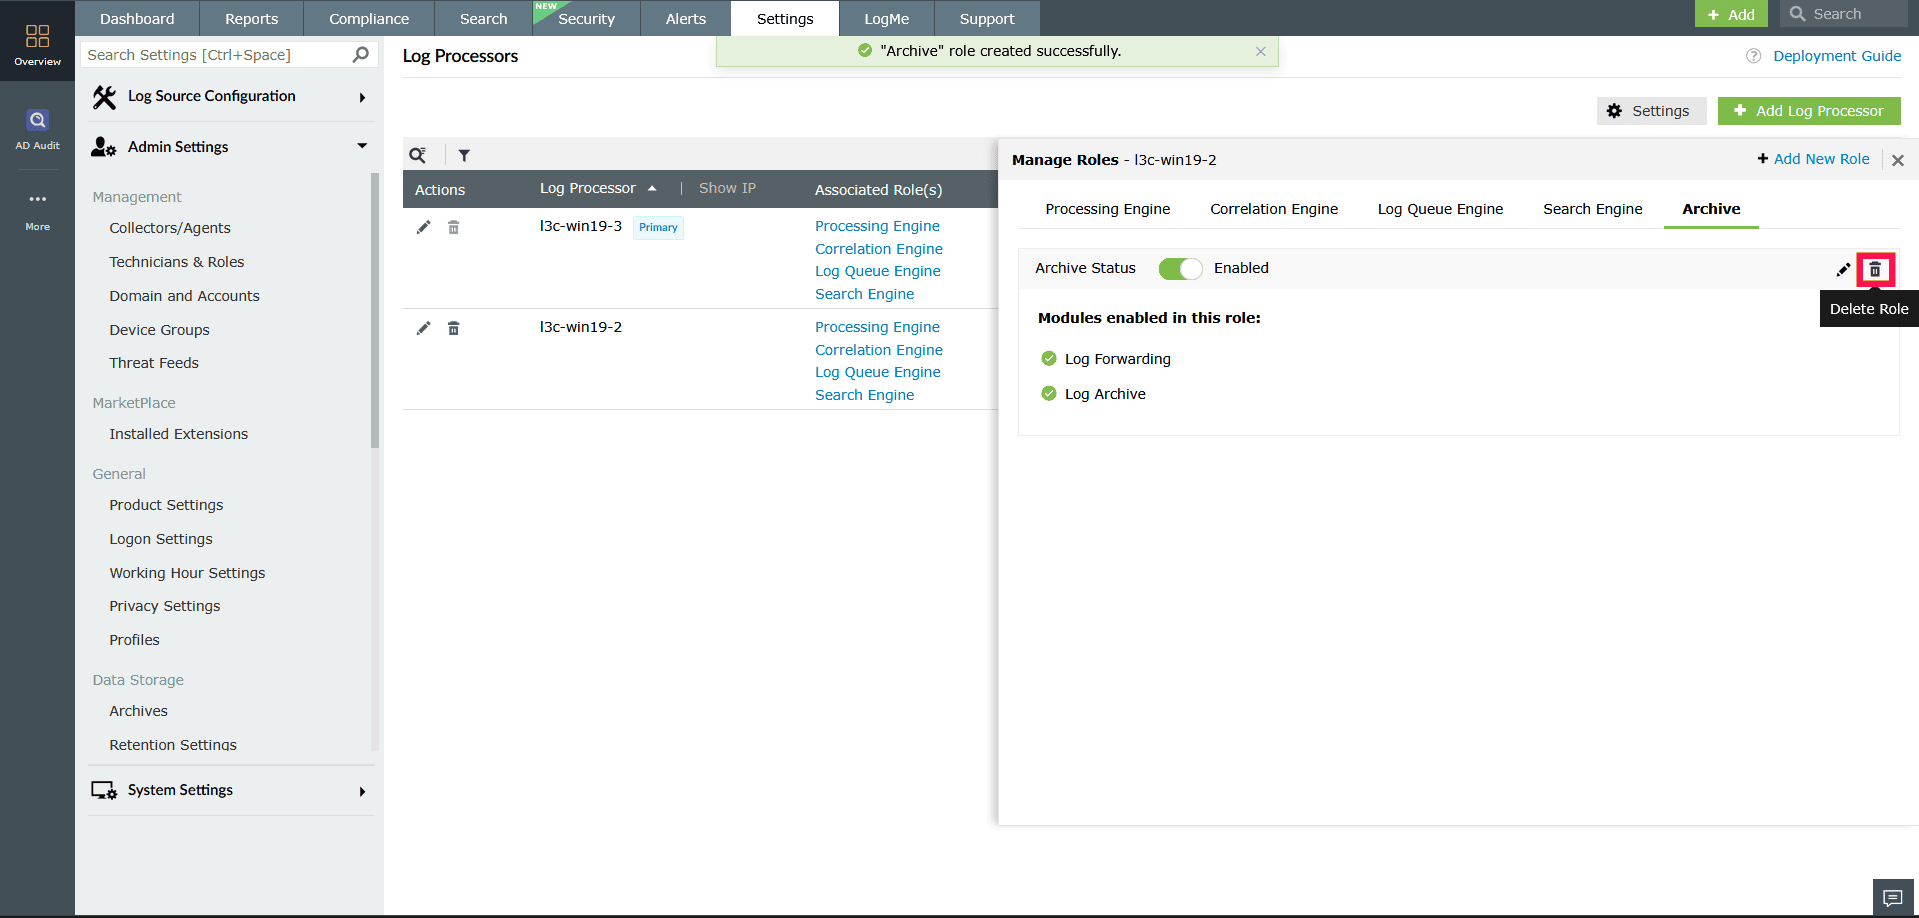
Figure 35: Deleting roles in a Log Processor - In the Confirm Deletion popup, click Proceed.
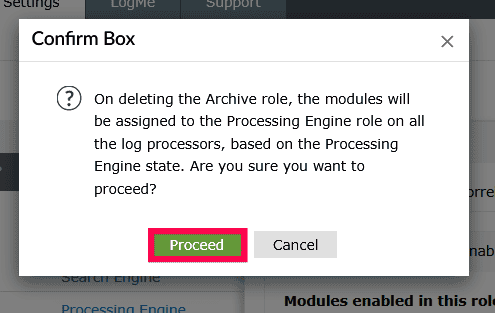
Figure 36: Deleting roles in a Log Processor NOTE Default roles such as Processing Engine, Correlation Engine, Search Engine, and Log Queue Engine cannot be deleted. Only custom roles, like Archive and Alerts, can be removed.
Read also
This document explained how to manage Log Processors in the product console. For a comprehensive overview of scalability and instructions on how to leverage its capabilities effectively, refer to the following articles: