GPU monitoring tool for AI infrastructure
Optimize your AI workloads with ManageEngine's real-time GPU monitoring tool: OpManager.
- Monitor GPU performance and power usage to optimize IT spending
- Track GPU temperature to prevent thermal throttling
- Prevent silent GPU failures with proactive alerting
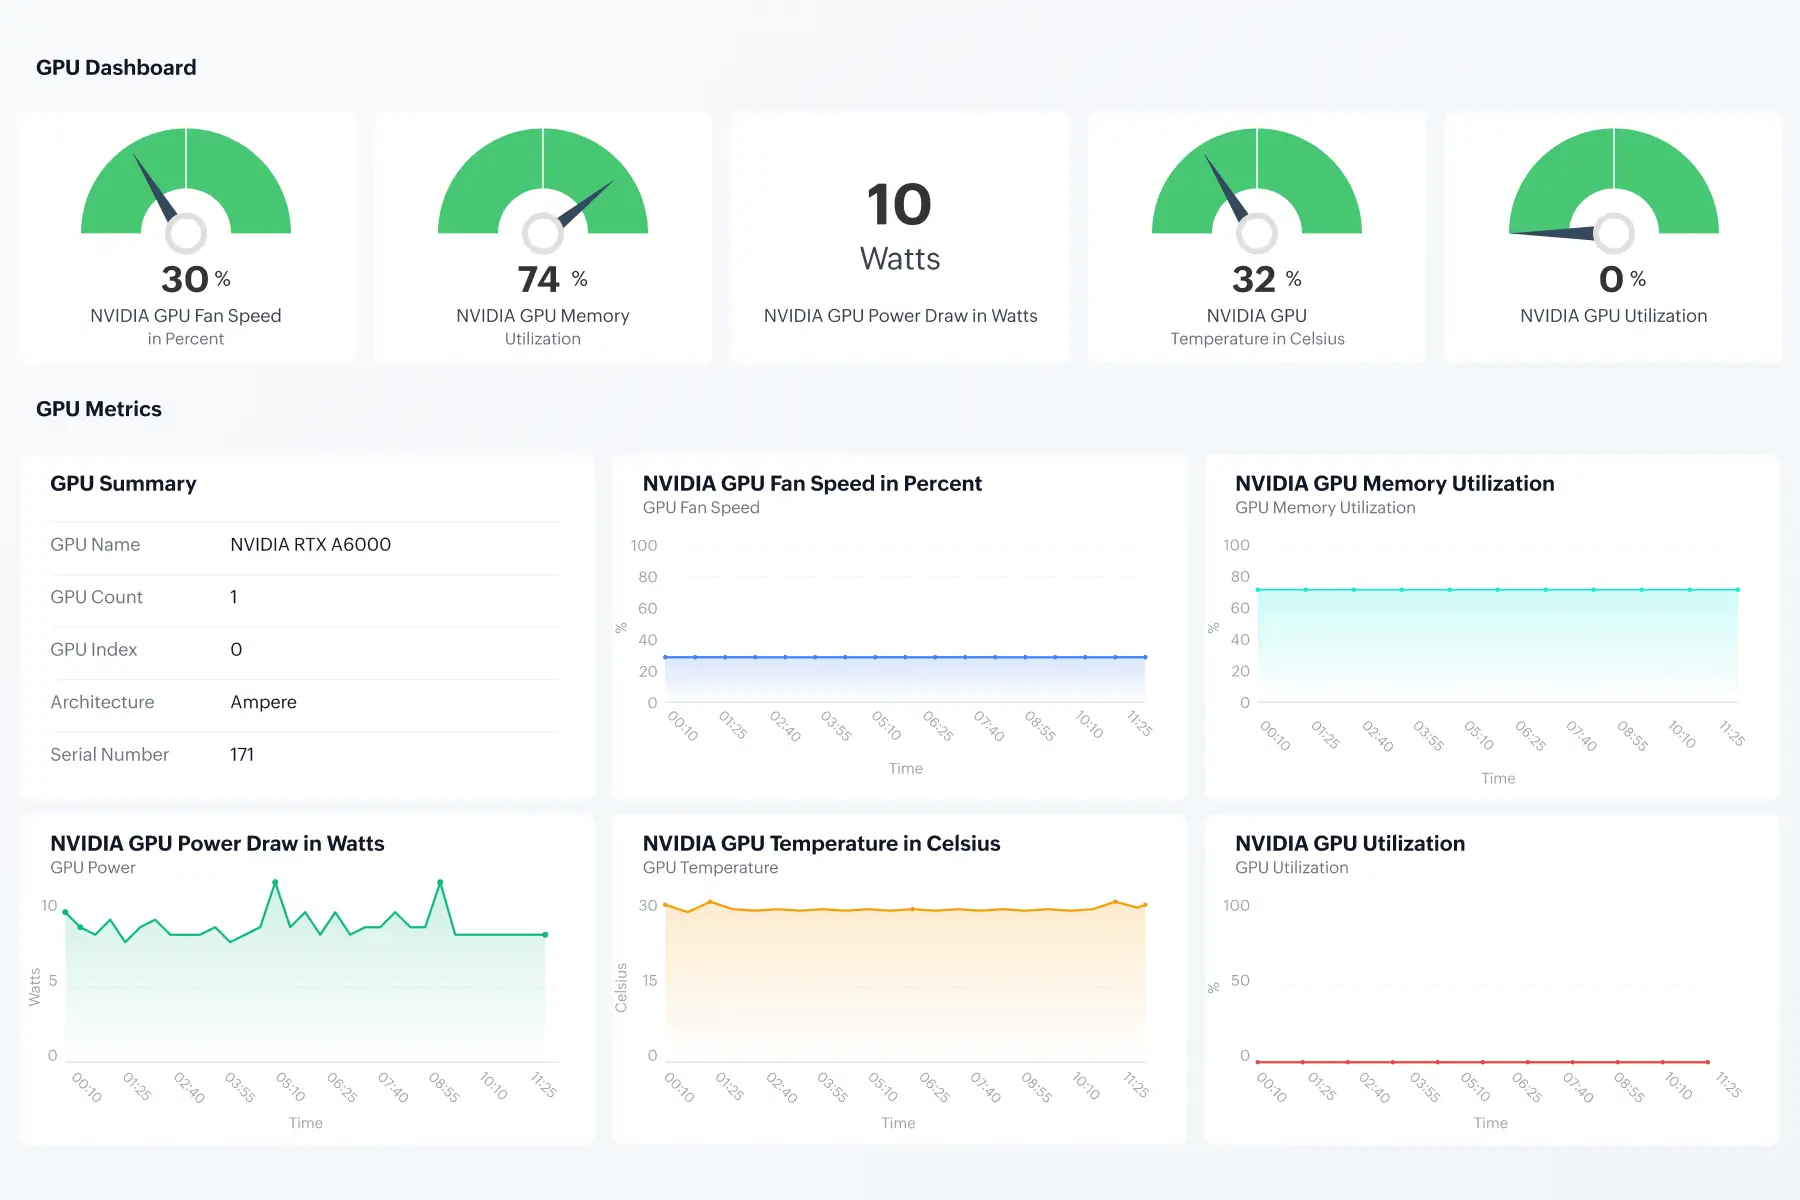
Why is GPU monitoring important for AI teams?
GPUs run resource-intensive operations for AI workloads. But they are sensitive to temperature spikes and can often fail silently. By monitoring GPU chip sets, AI teams can ensure consistent compute output from GPUs without risking hardware degradation. GPU monitoring also helps optimize resource allocation, reducing wasteful spend on expensive chip sets. OpManager is a server monitoring software with powerful GPU monitoring capabilities.
OpManager's GPU monitoring capabilities
Optimize IT spending with GPU utilization monitoring
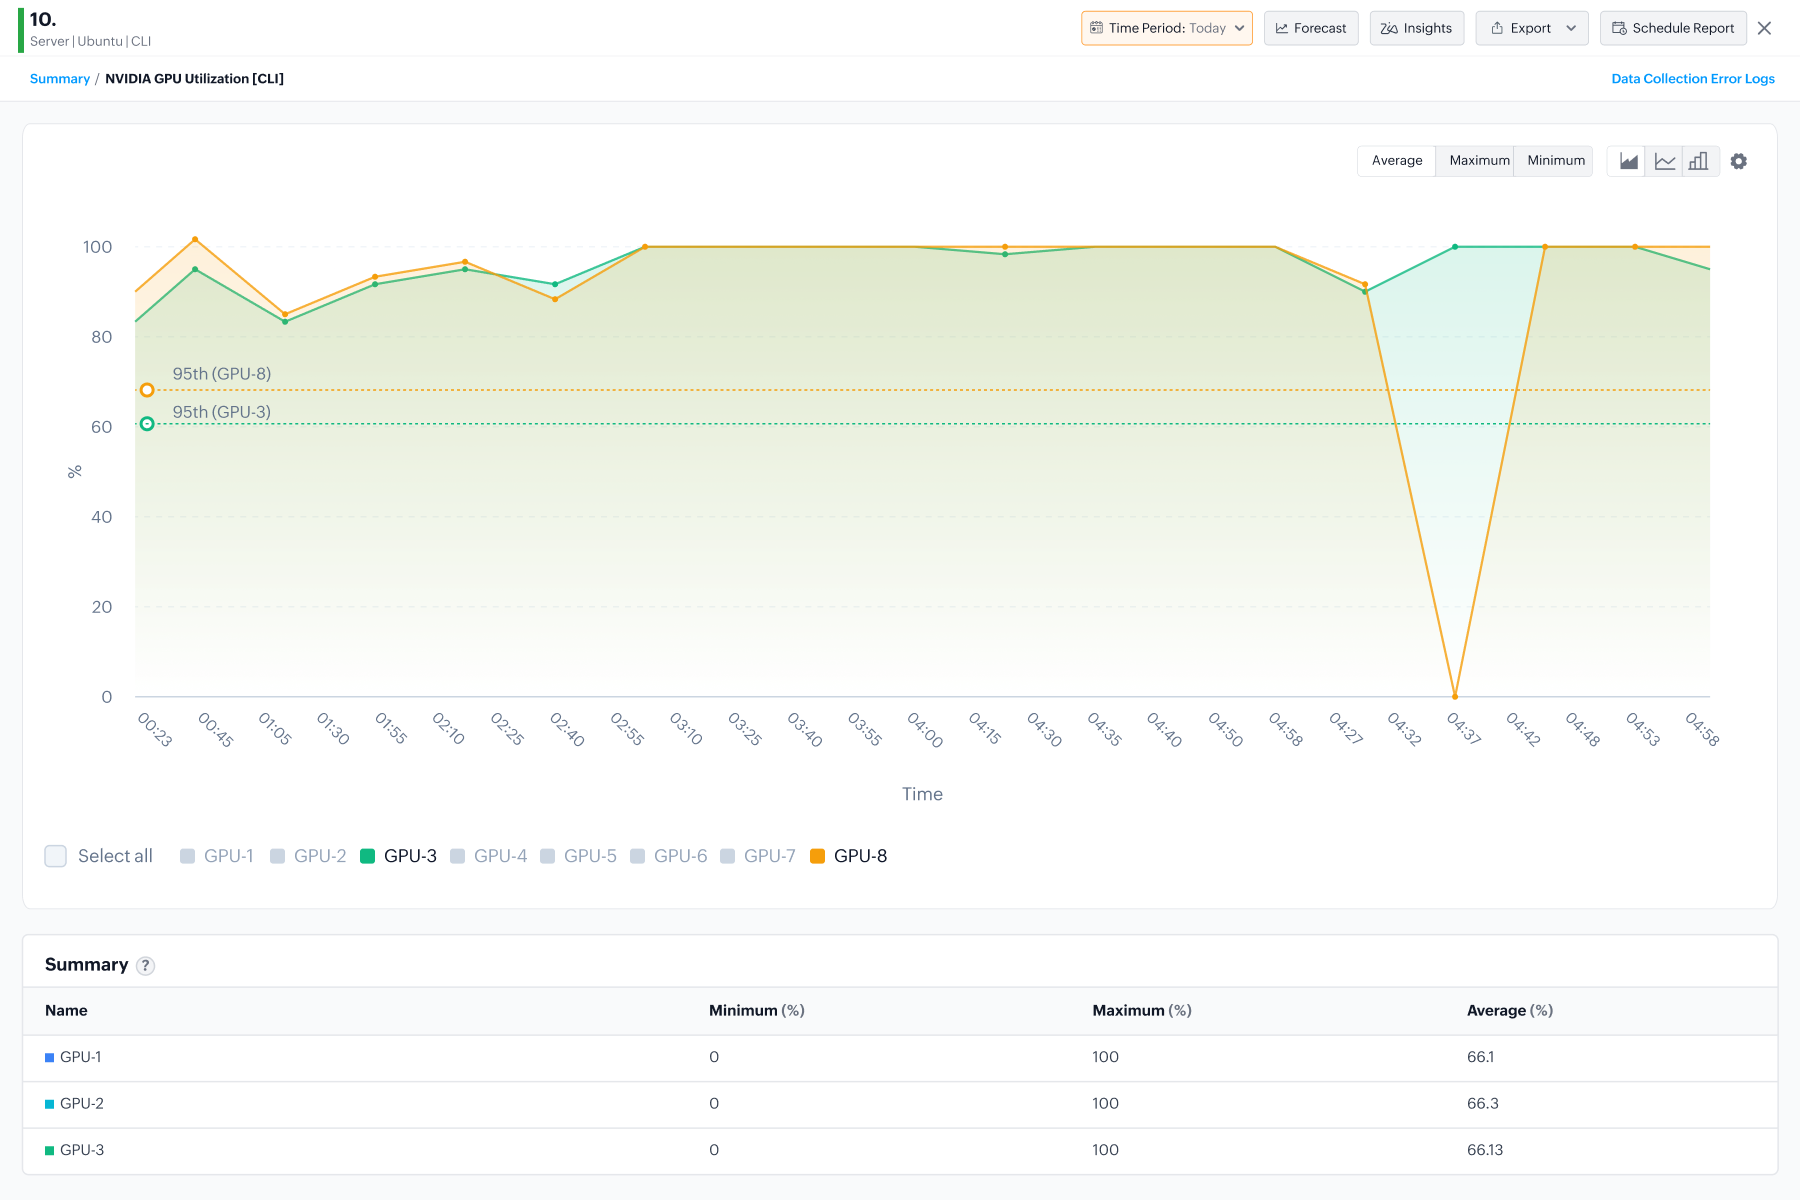
Most GPUs run below 70% utilization, even at peak hours. OpManager helps you optimize resource use to drive down IT spend.
- GPU utilization monitoring: OpManager helps track compute efficiency. If this metric is low during a scheduled AI training job, it signals an upstream bottleneck.
- GPU core clock speed monitoring: OpManager helps you track the actual engine speed of the processing cores. Comparing clock speed against utilization helps detect throttling.
- GPU display status monitoring: For instances dedicated strictly to AI/ML workloads, IT teams can monitor this to ensure that compute resources are not being wasted on rendering graphical interfaces.
Track VRAM capacity and memory to prevent silent job failures
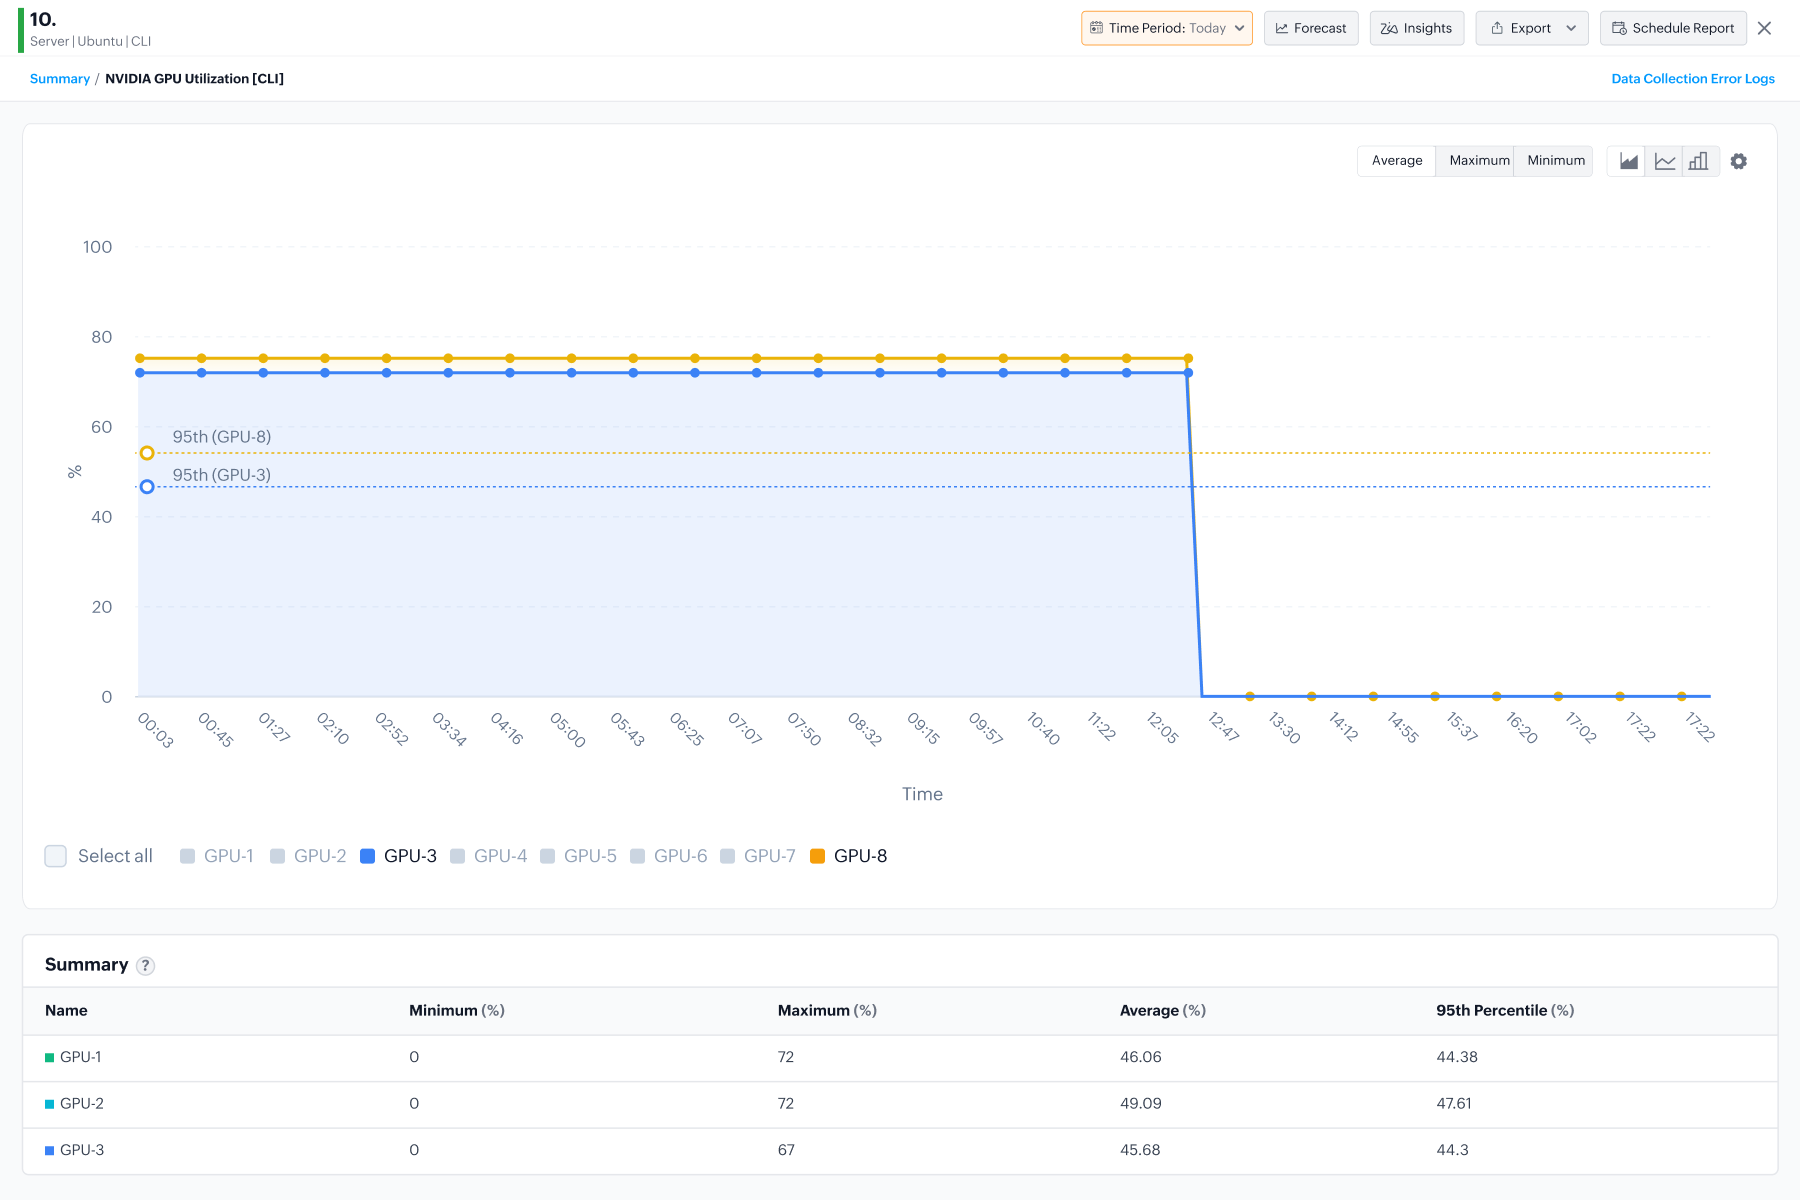
To find silent job failures, you need visibility into GPU memory as well. You can track the GPU memory that is actively allocated and being used by running applications and processes with OpManager.
- GPU memory utilization monitoring: OpManager helps you prevent Out-of-Memory errors. AI workloads (especially LLMs) must load billions of weights directly into VRAM. If this hits 100%, the process terminates abruptly.
- GPU memory clock speed monitoring: Many deep learning operations depends on memory over compute. Monitoring memory clock speed helps identify data transfer bottlenecks
Minimize thermal throttling with regular hardware checks
Thermal throttling occurs when a GPU limits its own performance to avoid overheating, resulting in sudden, unpredictable drops in execution speeds.
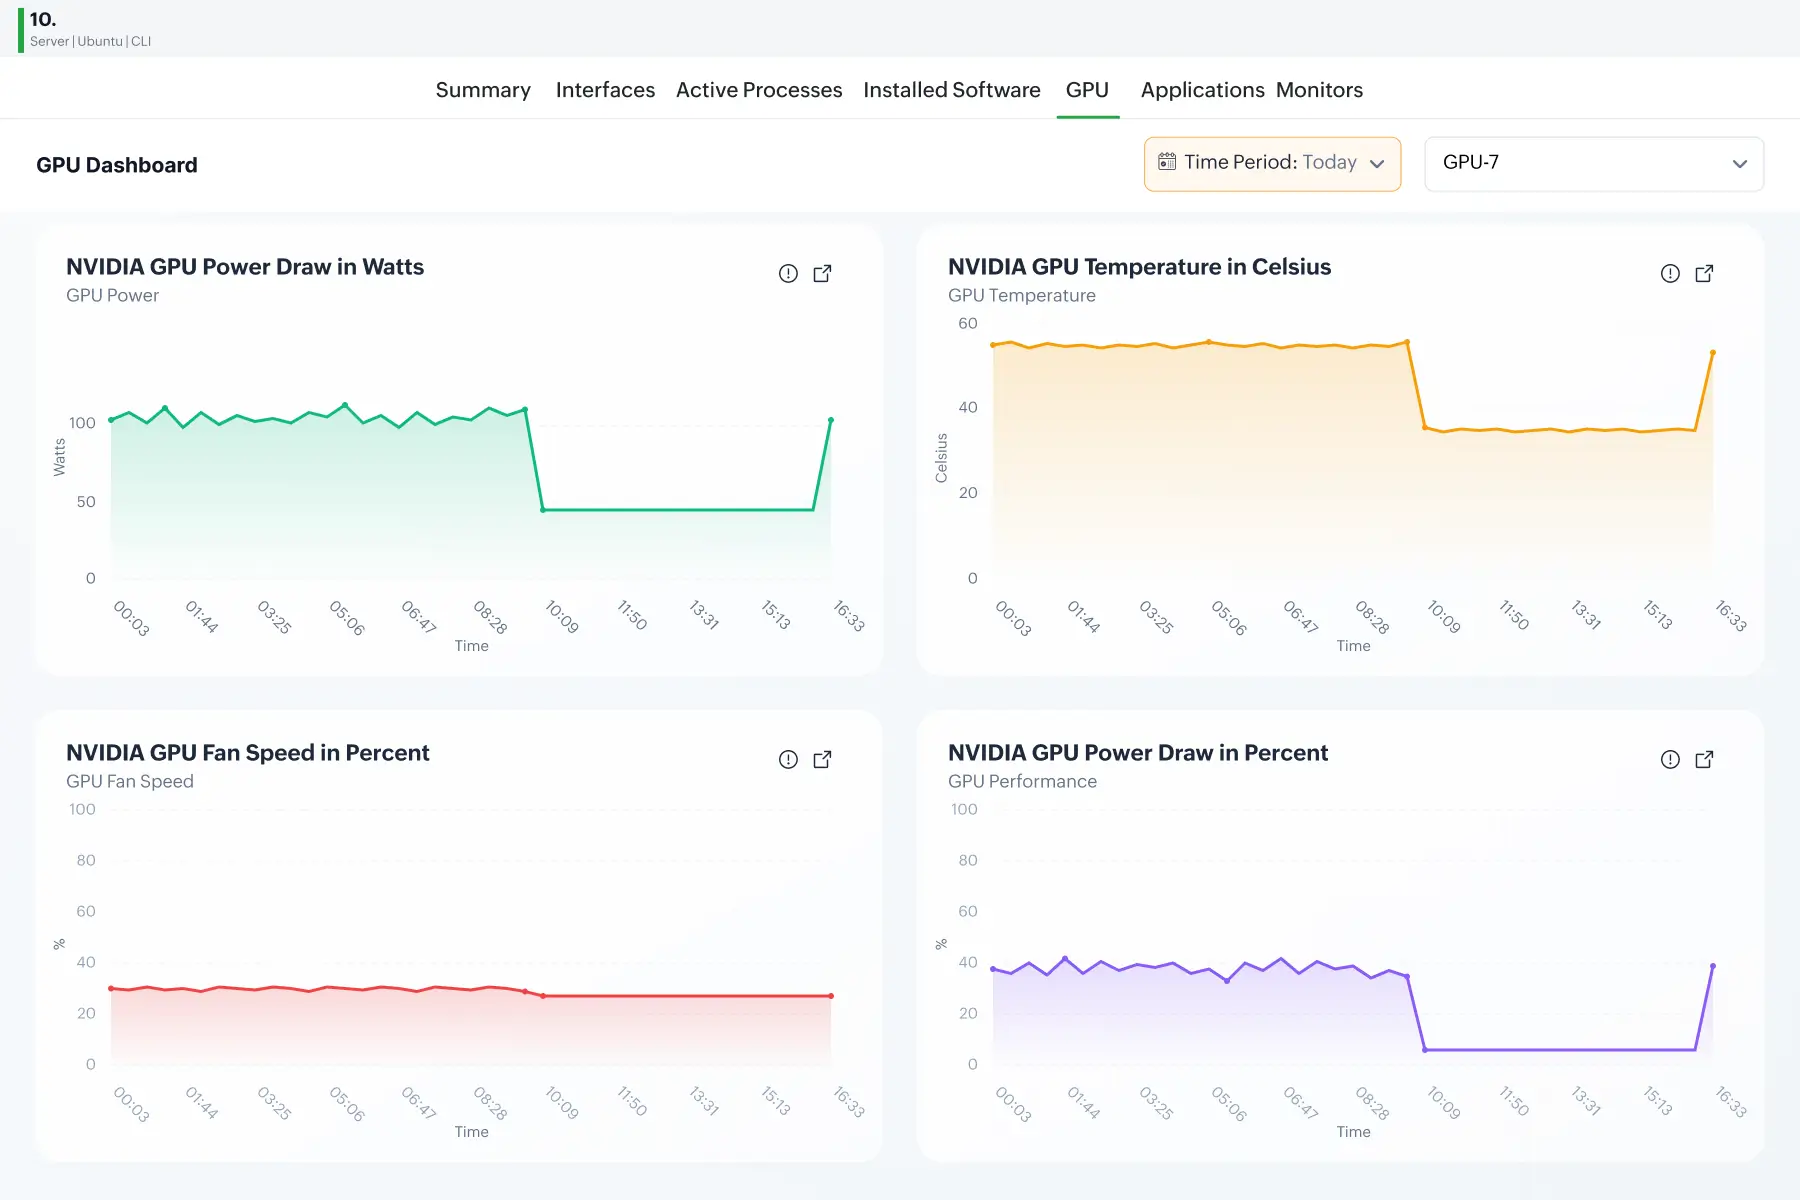
- GPU temperature monitoring: OpManager monitors the GPU temperature and warns you before it reaches its thermal threshold.
- GPU fan speed monitoring: Diagnose cooling hardware failures, misconfigured fan curve policies, or check if the environmental cooling in the data center is adequate.
- GPU power draw monitoring: Get precise power consumption stats. This allows you to calculate the exact electricity cost of running specific models or training runs, enabling accurate resource budgeting.
Monitor GPU modes to ensure stable, latency-free operations
While metrics like temperature or power draw indicates how the hardware is reacting to a workload, GPU configuration tells you how the software and driver layers are governing access to the hardware.
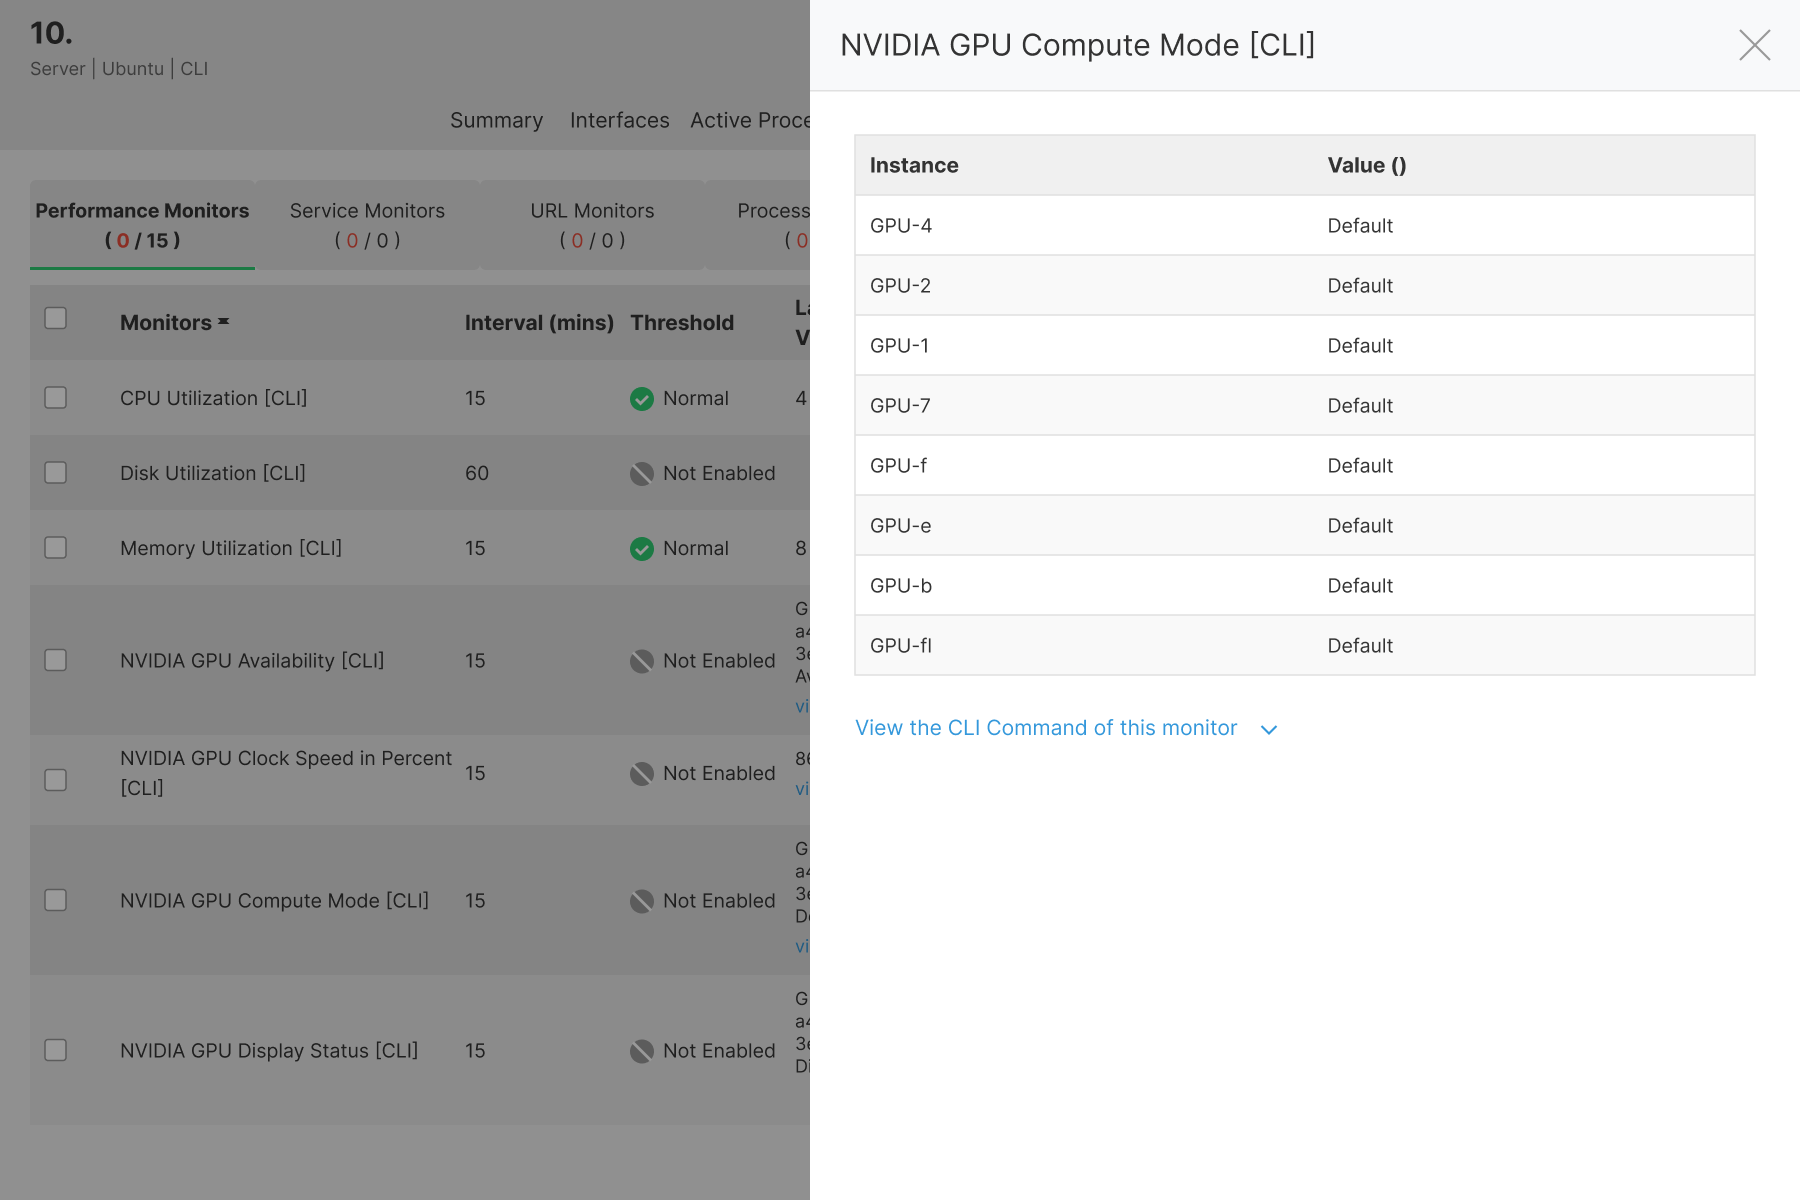
- GPU compute mode: Compute mode helps you track if multiple processes are allowed to run simultaneously.
- GPU persistence mode: OpManager helps you optimize GPU startup latency by checking whether persistence mode is enabled for your GPUs. Without persistence, there might be noticeable lag for new jobs.
Built for every IT team that runs GPUs: Use cases

Optimize MLOps workflows with GPU visibility
GPU bottlenecks in ML pipelines are rarely obvious. OpManager gives MLOps teams the metric-level visibility to catch them before they stall training jobs or degrade inference.
- Streaming-multiprocessor (SM) efficiency: Correlate GPU utilization and power draw to catch SM inefficiencies. If utilization is very high but power draw remains low, your SMs aren't firing at full capacity.
- AllReduce stall: In multi-node training, one disconnected GPU can silently stall the entire cluster at a synchronization barrier. OpManager can detect it by flagging 0% utilization alongside full memory utilization.
- Optimizing real-time inference: Cold starts add latency that breaks user-facing AI apps. OpManager monitors GPU persistence mode to confirm the driver stays resident in memory, cutting wake-up latency to zero.
Run DevOps environments at peak efficiency
Shared GPU environments accumulate waste. OpManager helps DevOps and SRE teams catch these issues before they hit users.
- Zombie environments: High VRAM with low GPU utilization and power draw for hours means a model could be loaded but idle. OpManager flags this, allowing teams to kill the container.
- Enforcing multi-tenancy rules: Shared dev environments need GPU compute mode set to default, so multiple containers can share compute cores simultaneously. OpManager monitors this configuration and alerts on violations.
- Ensuring reliable customer experience: SREs can monitor GPU power draw to provision additional compute instances before ML microservices hit their power delivery caps and begin degrading app response times.
Monitor GPU efficiency to lower AI costs for SMBs
For smaller IT teams, every watt and every GPU matters. OpManager finds the signals that help SMBs cut waste and protect hardware.
- Monitoring power costs: Track GPU power draw alongside Display Status to catch idle workstations silently drawing electricity: A quick win for smaller IT teams managing tight infrastructure budgets.
- Preventing hardware degradation: Monitor fan speed to flag failing cooling systems early, preventing thermal damage and permanent silicon degradation to expensive GPU chip sets.
Cost-effective GPU monitoring at scale for enterprise teams
At enterprise scale, manual GPU oversight breaks down fast. OpManager's ML-driven monitoring and distributed architecture are built to keep pace with large, complex GPU deployments.
- GPU monitoring at scale: OpManager's ML-driven adaptive thresholds let enterprise admins monitor thousands of GPUs without manually configuring alarms, enabling effortless scaling with no monitoring blind spots.
- Managing distributed sites: OpManager's enterprise probe-central architecture unifies GPU monitoring across distributed, multi-tenant data centers into a single console, eliminating the need for site-by-site management.
Why choose OpManager over other GPU monitoring tools
Extensive Linux support
Supports diverse Linux server flavors like: Ubuntu, Debian, Fedora, Red Hat, CentOS, openSUSE, Arch Linux, Kali Linux, etc.
Unmatched scalability
Scale up to 50,000 devices and monitor distributed remote sites from a single console.
Cost-effective monitoring
Unlike other GPU monitoring software, you can monitor any number of metrics per server without paying extra.
Third party integrations
Leverage built-in integrations with: ServiceNow, ServiceDesk Plus, Jira, Ansible, Grafana, Splunk, Slack, Teams, OpenAI, DeepSeek, and Ollama.
Frequently asked questions about GPU monitoring
Resources to dig deeper
The technical playbook for deploying agentic AI in production ITOps
Unlock more value with add-ons
Extend easily with complementary products — add deeper traffic visibility, configuration management, and more.
Bandwidth monitoring
Layer NetFlow-based traffic analysis to see who and what is driving every byte across the network.
Try free trial →Firewall management
Audit firewall rule changes, spot shadow rules, and tie every config change back to the network event.
Try free trial →Network configuration
Back up configs, detect drift, and push standardized changes across thousands of devices.
Try free trial →