Server monitoring software
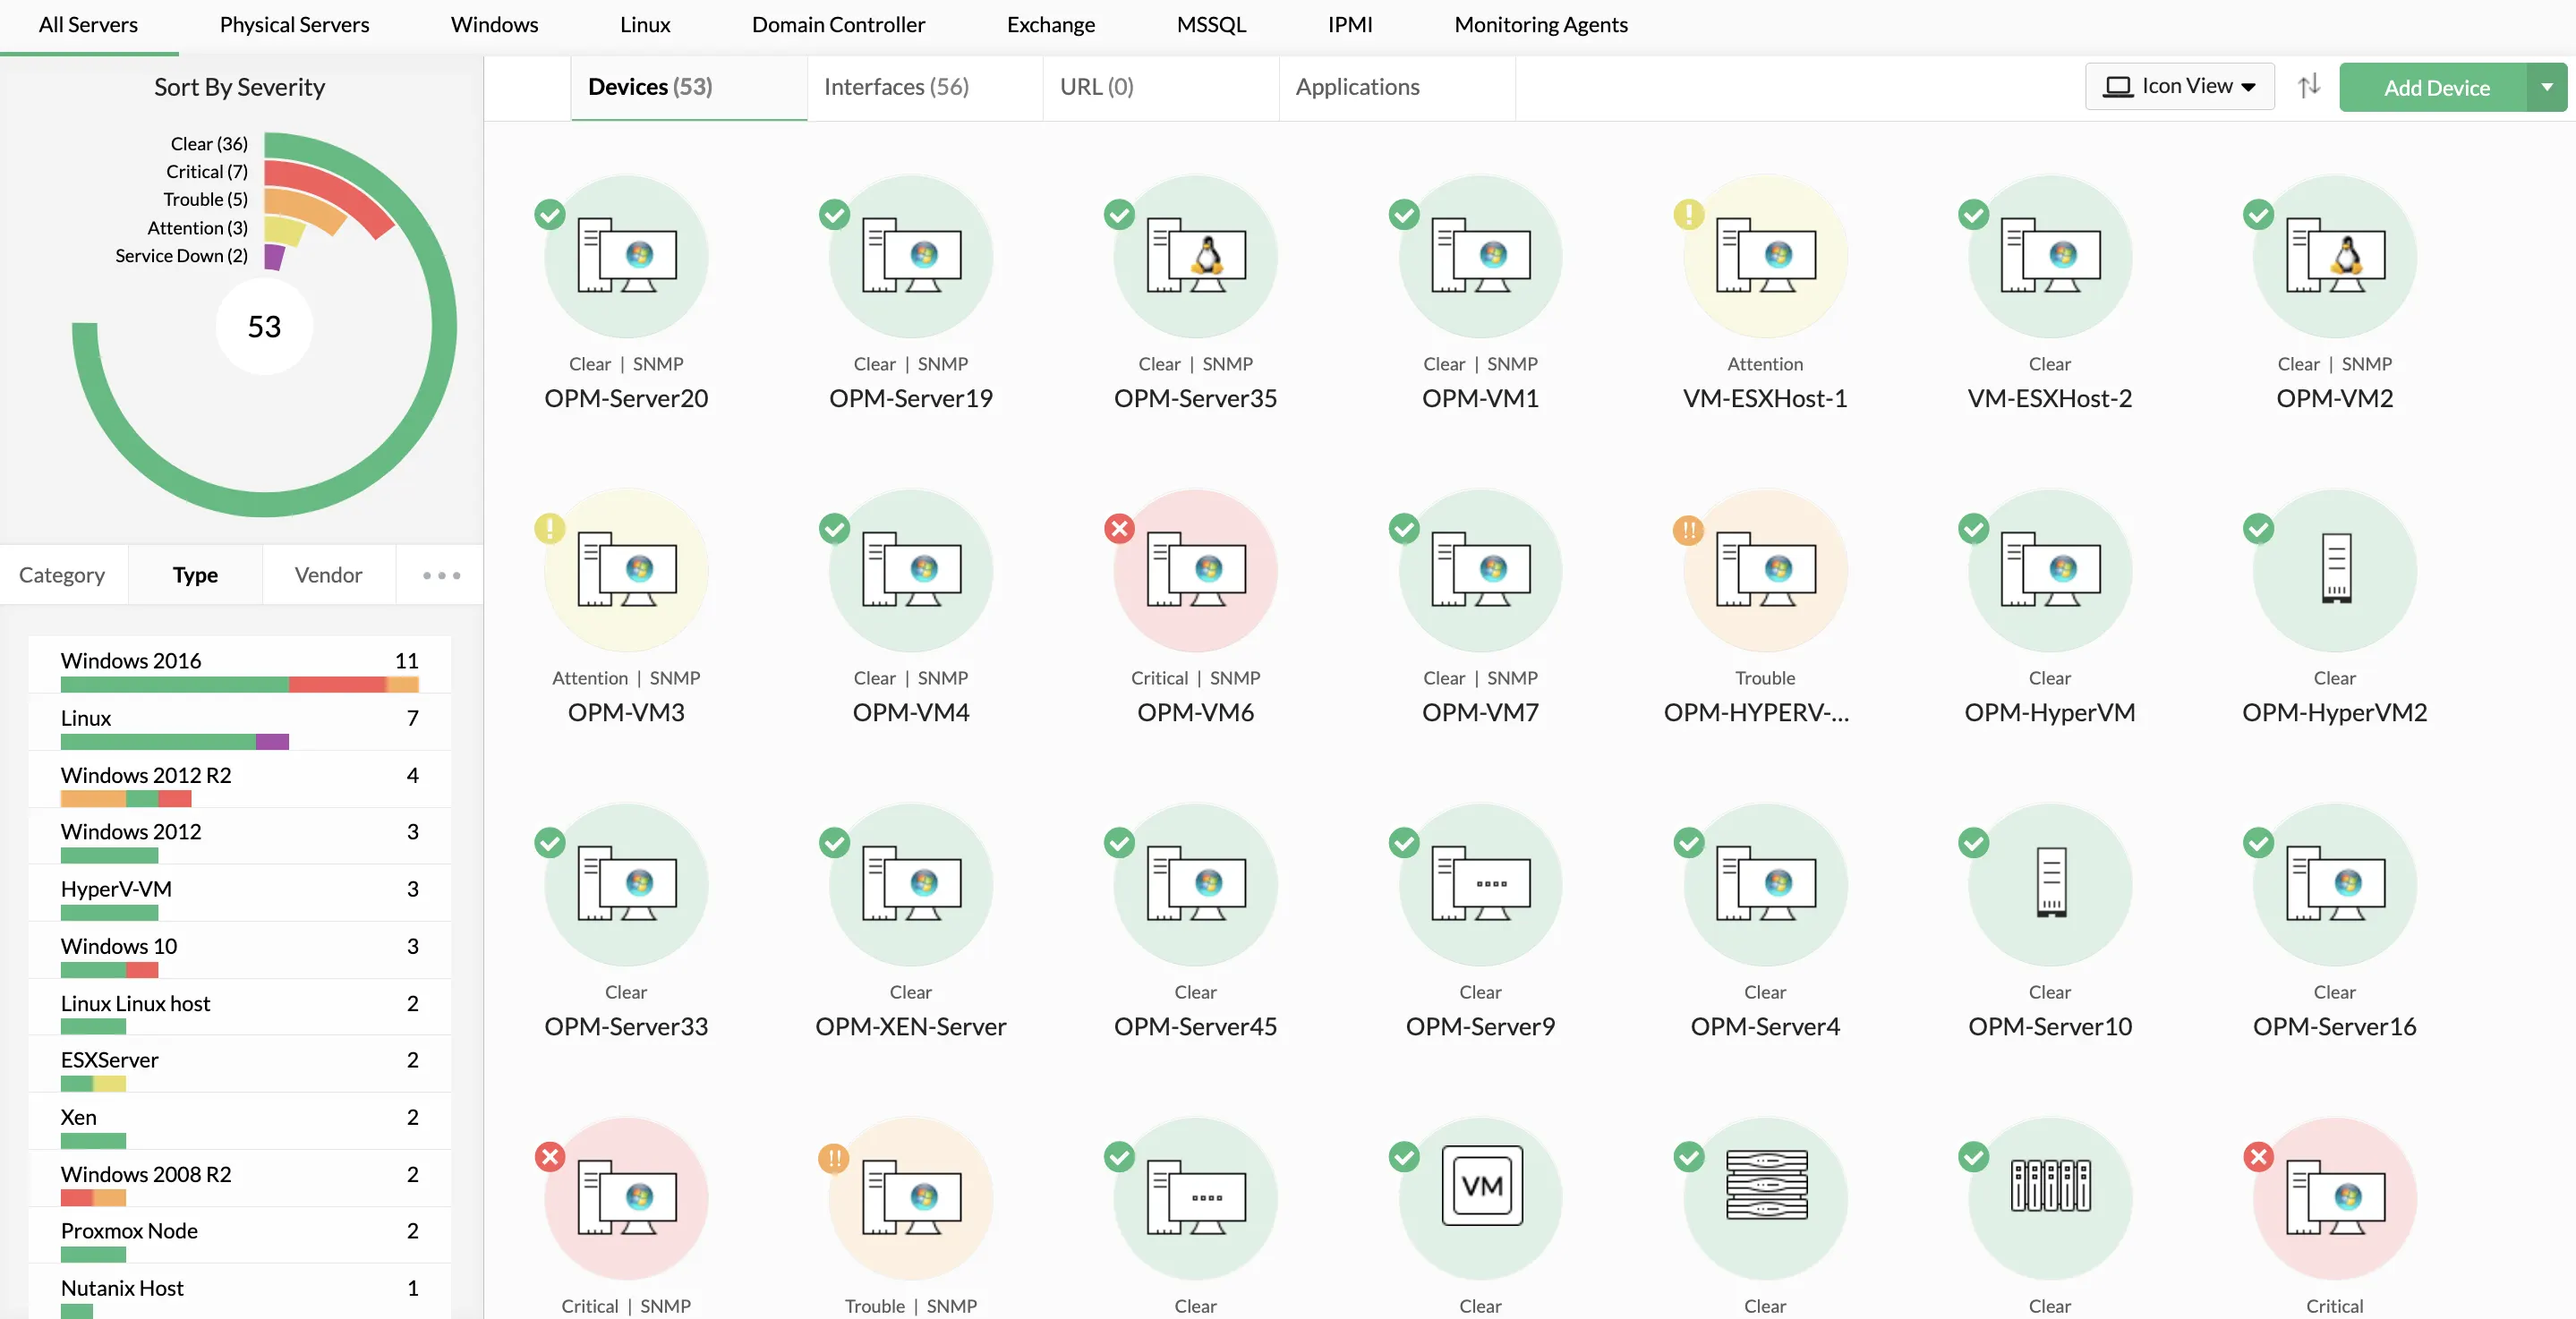
OpManager monitors the uptime, performance, processes, logs, hardware, and GPUs of physical and virtual servers from a single console!
- Monitor Windows, Linux, Solaris, AIX, & UX servers
- Track VMware, Hyper-V, Nutanix, Xen, and Proxmox virtual servers
- Drill down into server processes and services in real-time
- Reduce the mean time to repair (MTTR)
What does a server monitoring software do?
Server monitoring software tracks your server's uptime, CPU, memory, disk, and network usage at regular intervals. They use protocols like SNMP, WMI, Telnet, and SSH, or installed monitoring agents to collect telemetry data from server devices. With effective server monitoring tools like OpManager, IT teams can reduce the MTTR for outages and optimize resource usage ensuring SLA compliance and lower IT costs.
OpManager's server monitoring capabilities
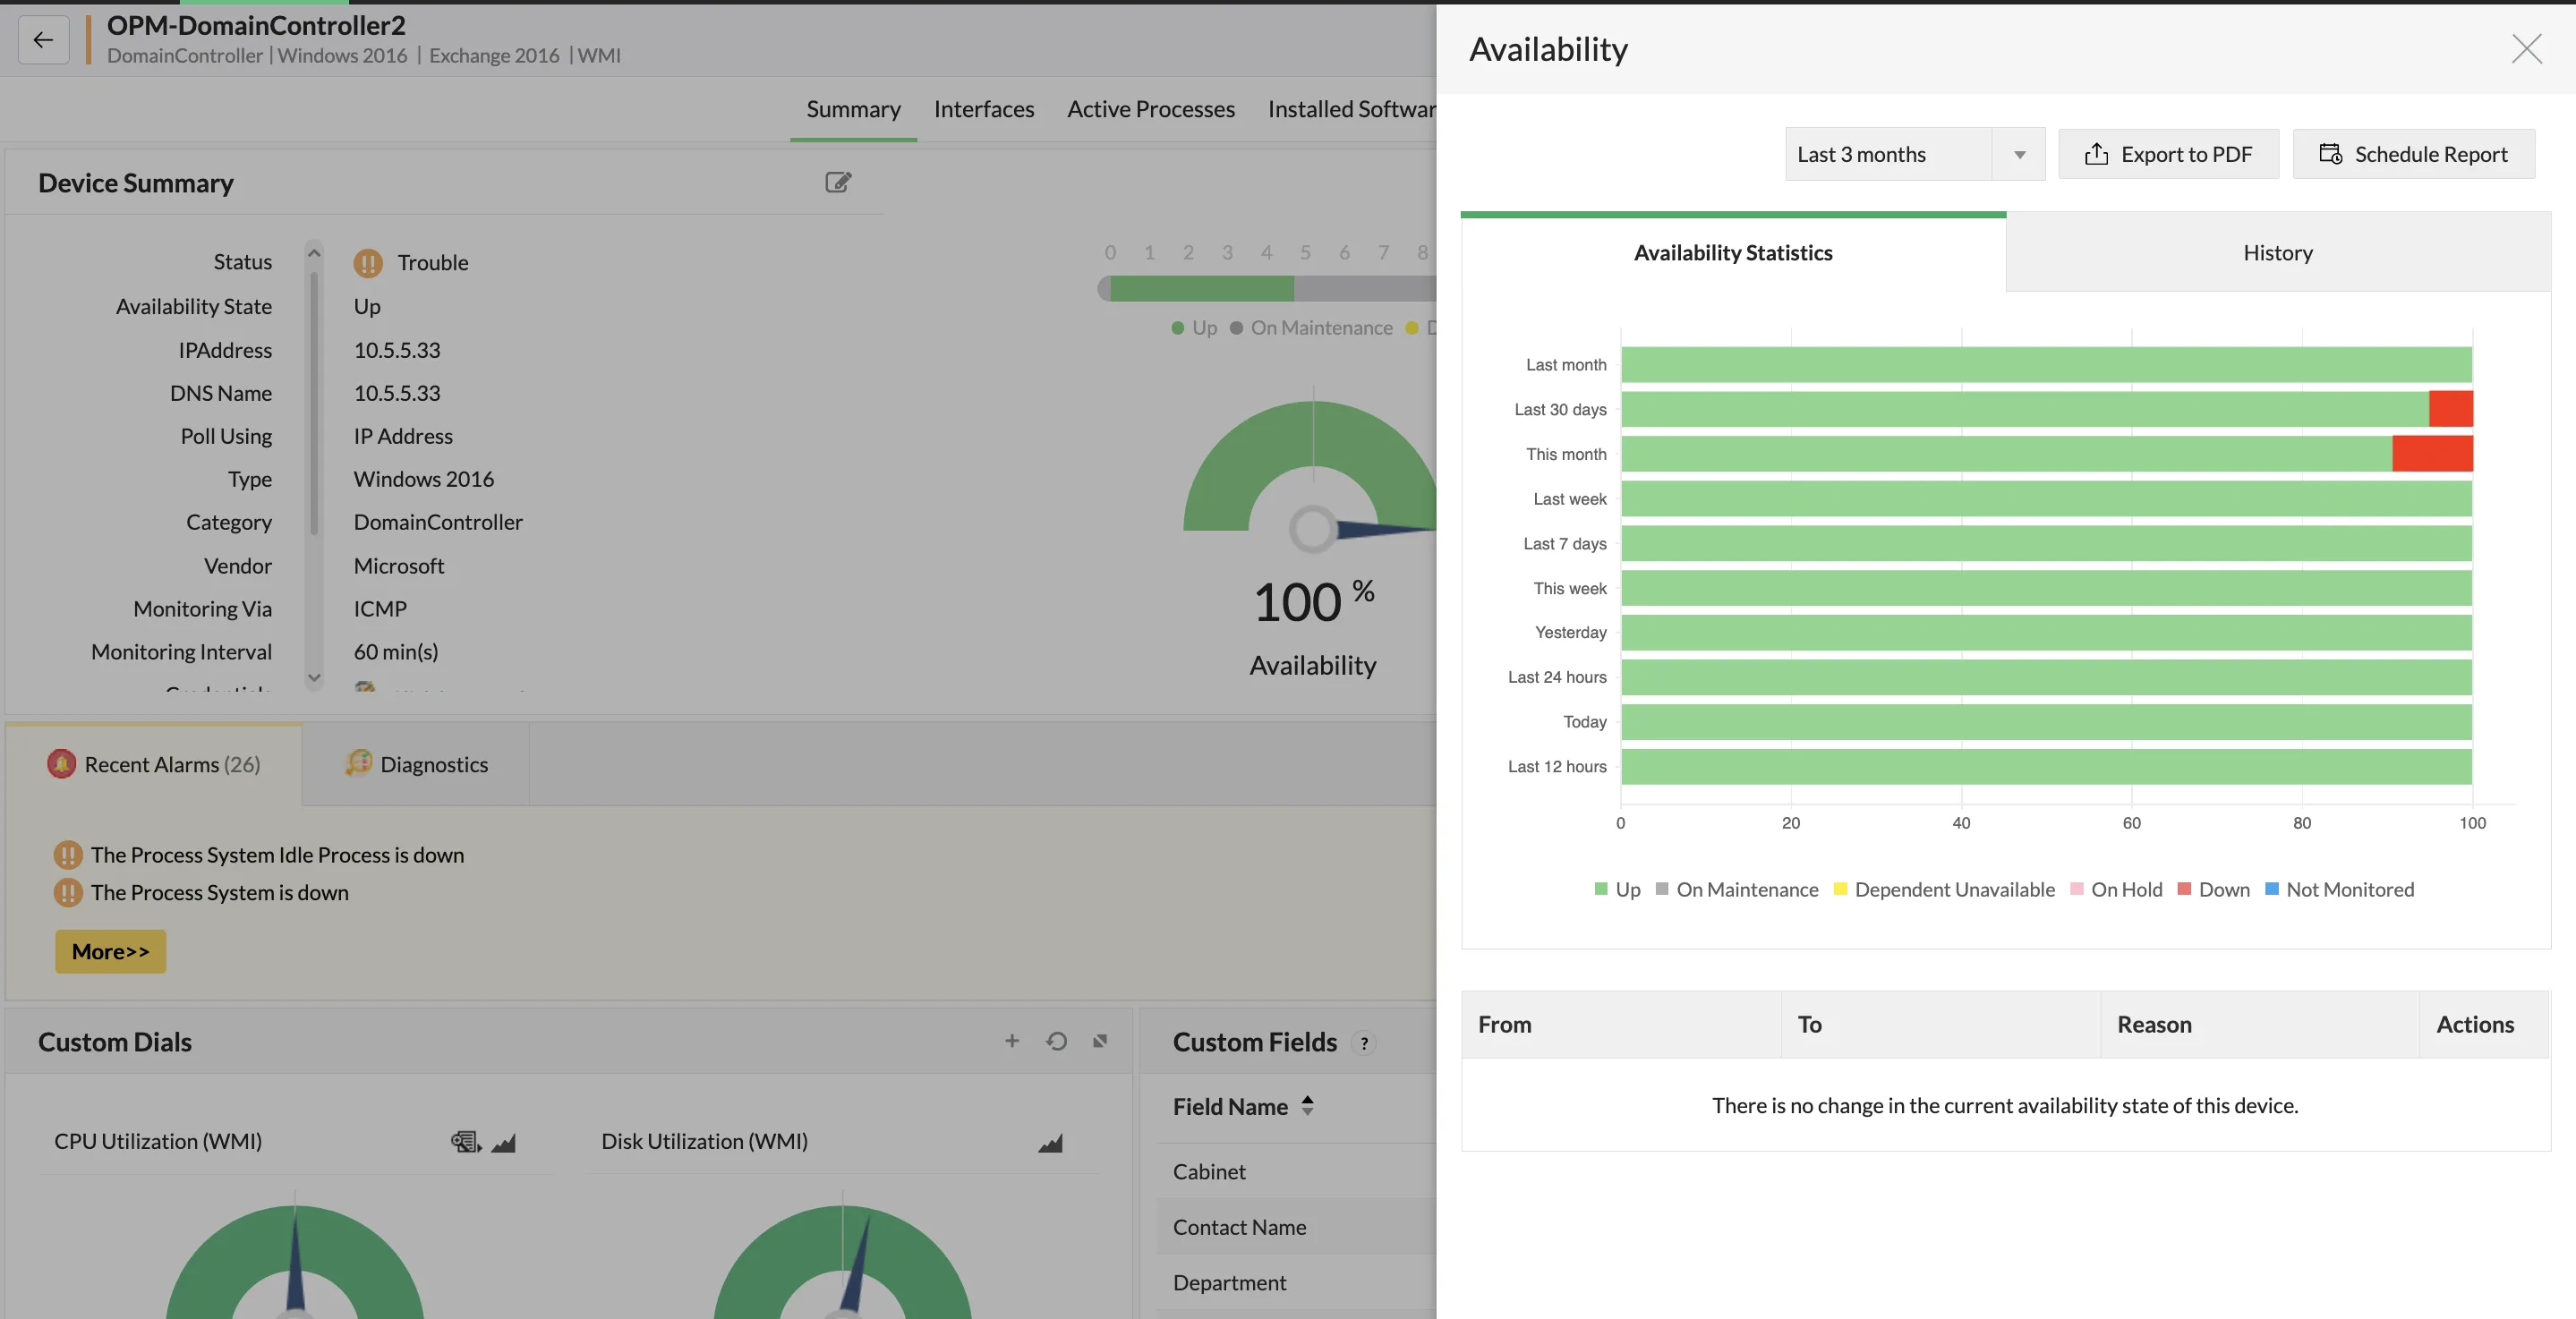
Track server availability against your SLAs with uptime monitoring
- OpManager uses ICMP, SNMP v3, and TCP protocols to run regular uptime checks on your server devices.
- Ensure SLA compliance by monitoring the uptime of critical devices and interfaces at intervals as low as 30 seconds. Review past violations with availability timelines.
- Set up instant alerts and multi-channel notifications for downtime. Monitor packet loss and response time to detect network congestion affecting your server performance.
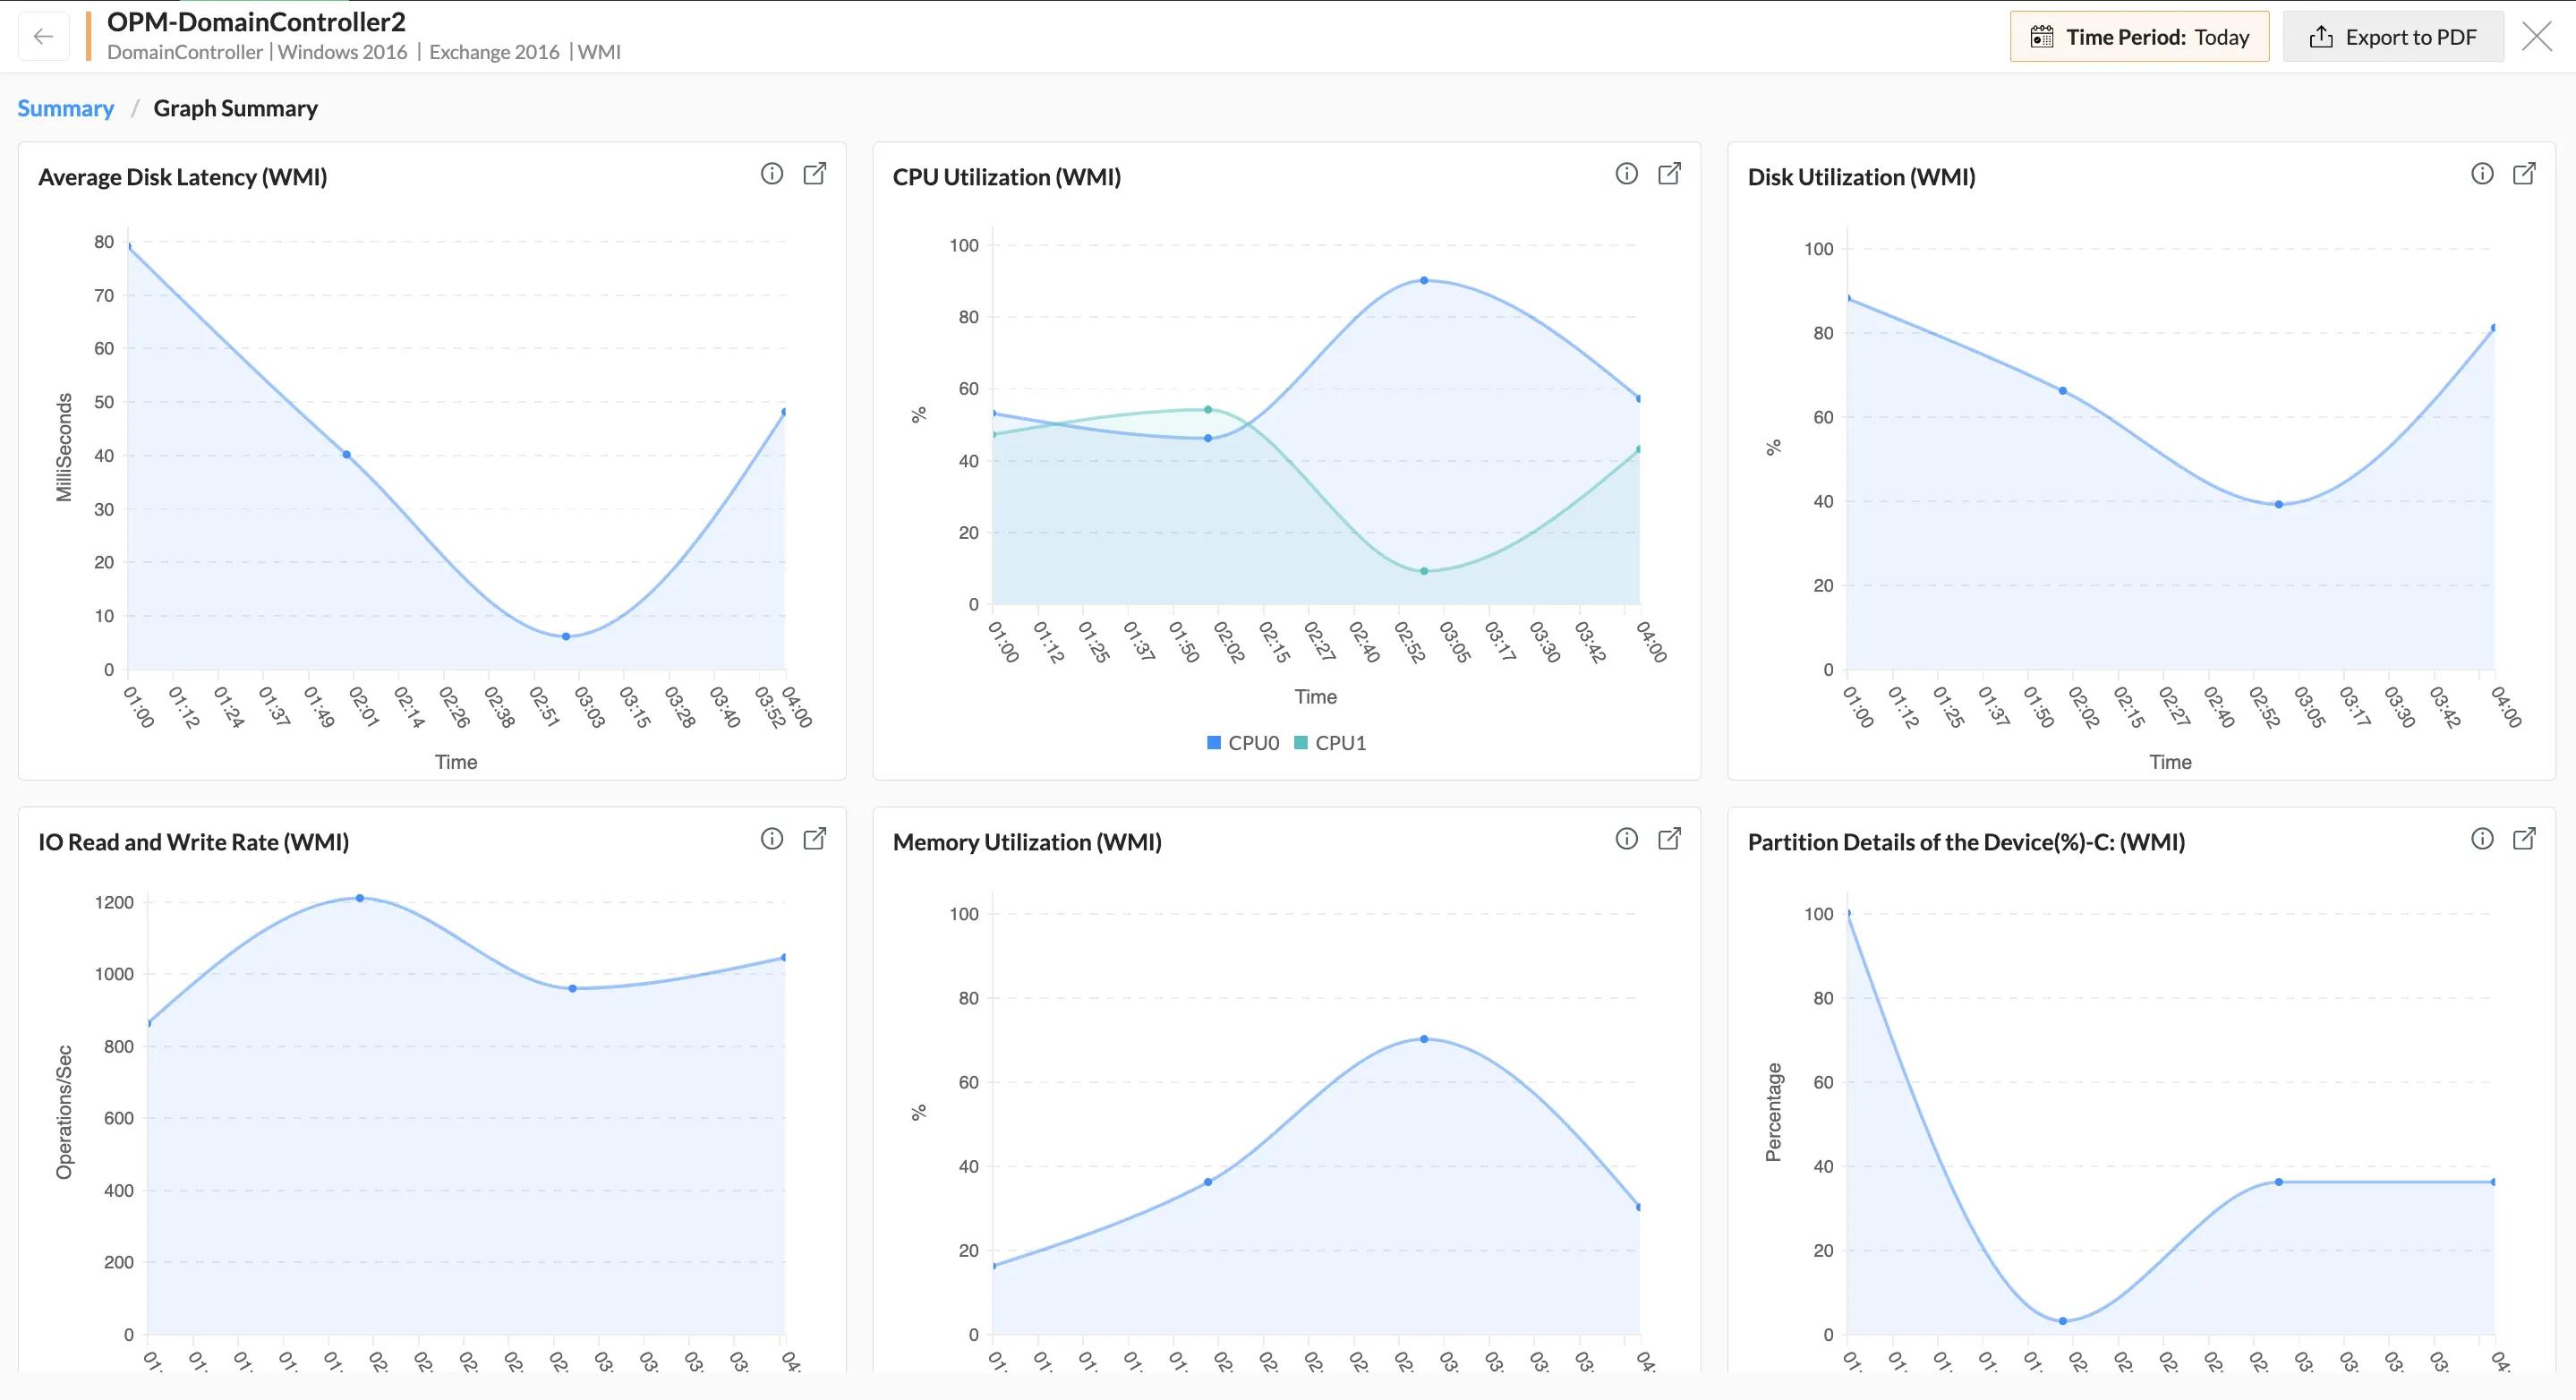
Monitor server operations with CPU, memory, disk, and network monitoring
- Track the CPU utilization with CPU-core level visibility using colour-coded performance graphs and multi-level alarm thresholds. Monitor advanced CPU metrics like CPU ready and wait time for virtual servers.
- Monitor the memory utilized by your server devices at regular interval. Drill down into active memory usage and memory ballooning for virtual machines.
- Ensure fast server operations by monitoring disk storage capacity, disk I/O and traffic usage. Set threshold limits for disk and network latency to get alerted for server issues proactively.
Gain in-depth visibility into server processes and services
- OpManager goes in-depth into server devices by monitoring the processes running inside it. You can track the availability, CPU and memory used by each.
- Monitor TCP service ports (HTTP, SMTP, SSH and others) to confirm services are reachable.
- For Windows servers, leverage OpManager's library of Windows service monitors to track the uptime of specific services. You can also restart down services or servers remotely.
Keep constant watch over your servers by monitoring logs
- OpManager collects syslogs generated by your servers. You can set up rules to detect specific syslogs and generate real-time alerts.
- For Windows servers, OpManager has a library of event log monitors. You can also monitor the uptime, age, and contents of log files and the folders they are stored in.
- With the Applications Manager Plugin, you can also combine this with IIS and Apache access and error logs, Kubernetes audit and pod logs, database, middleware, and application framework logs.
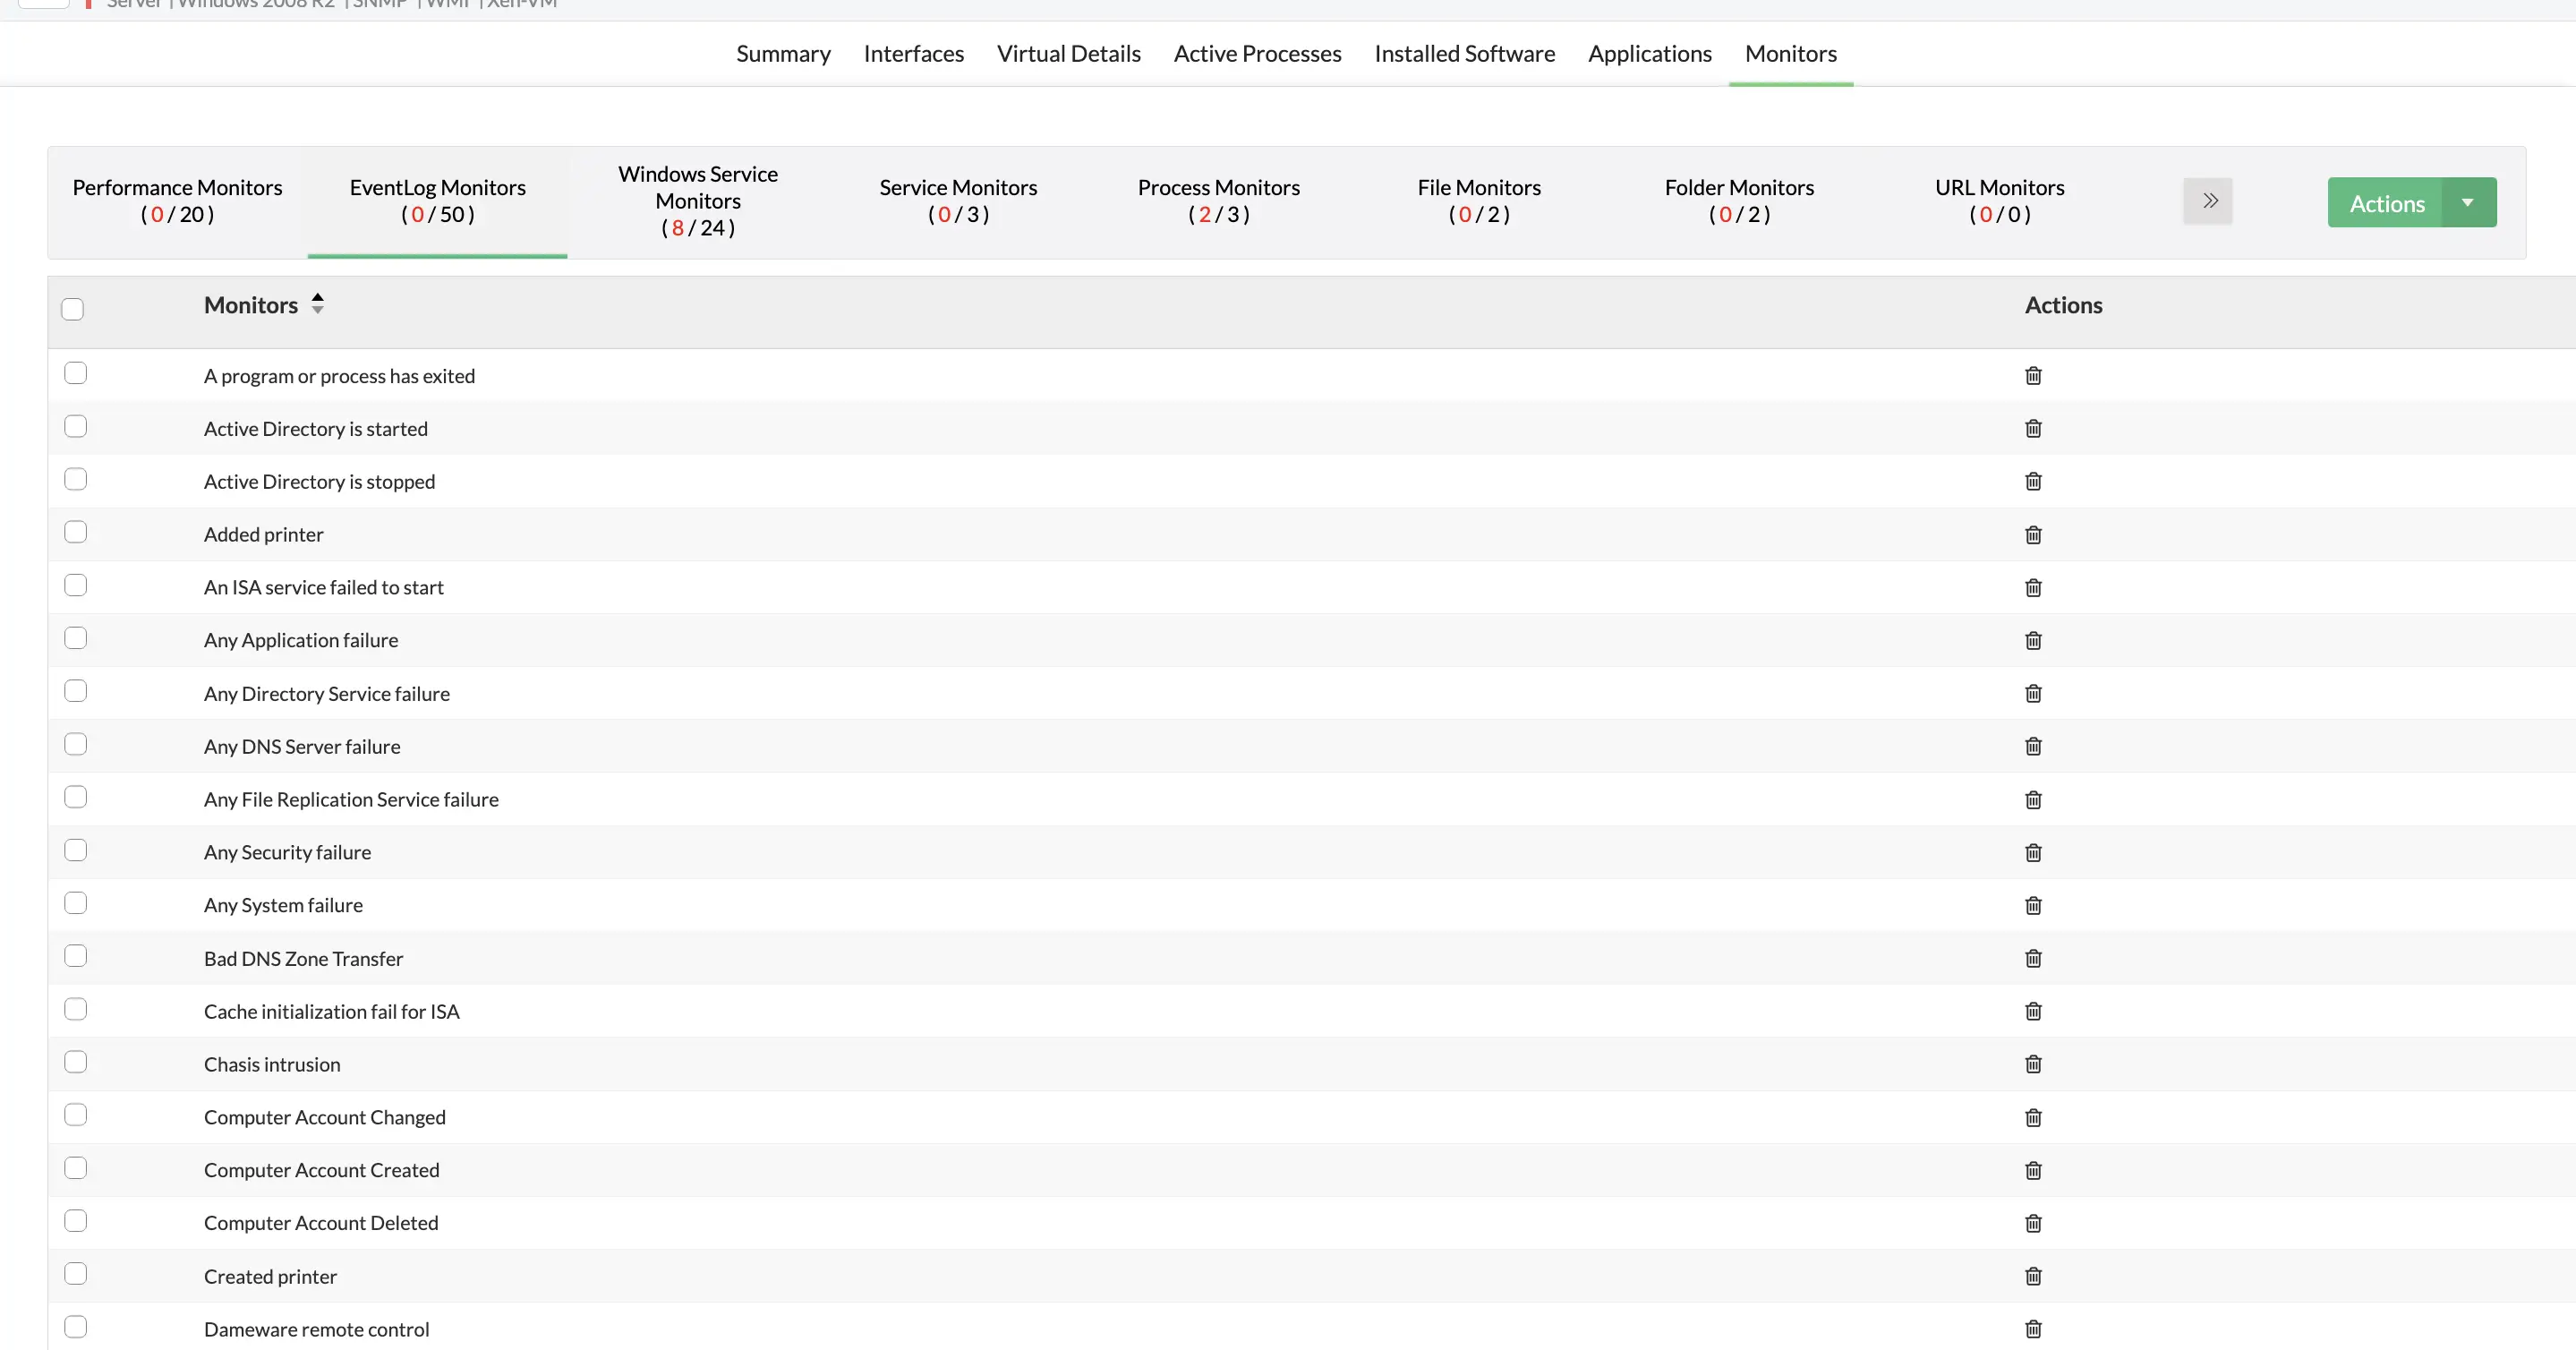
Prevent unplanned server outages with hardware health checks
- OpManager uses SNMP, WMI, SSH, and vendor APIs to monitor your servers hardware sensors in real-time.
- Set alerts for your server's CPU temperature, fan speed, power supply, processor clock speed, power supply, and disk health. Leverage dedicated hardware reports to review server health.
- With OpManager's IPMI monitoring, monitor the server's baseboard management controller (BMC). It works when the OS is down or the server is powered off, provided the server has standby power.
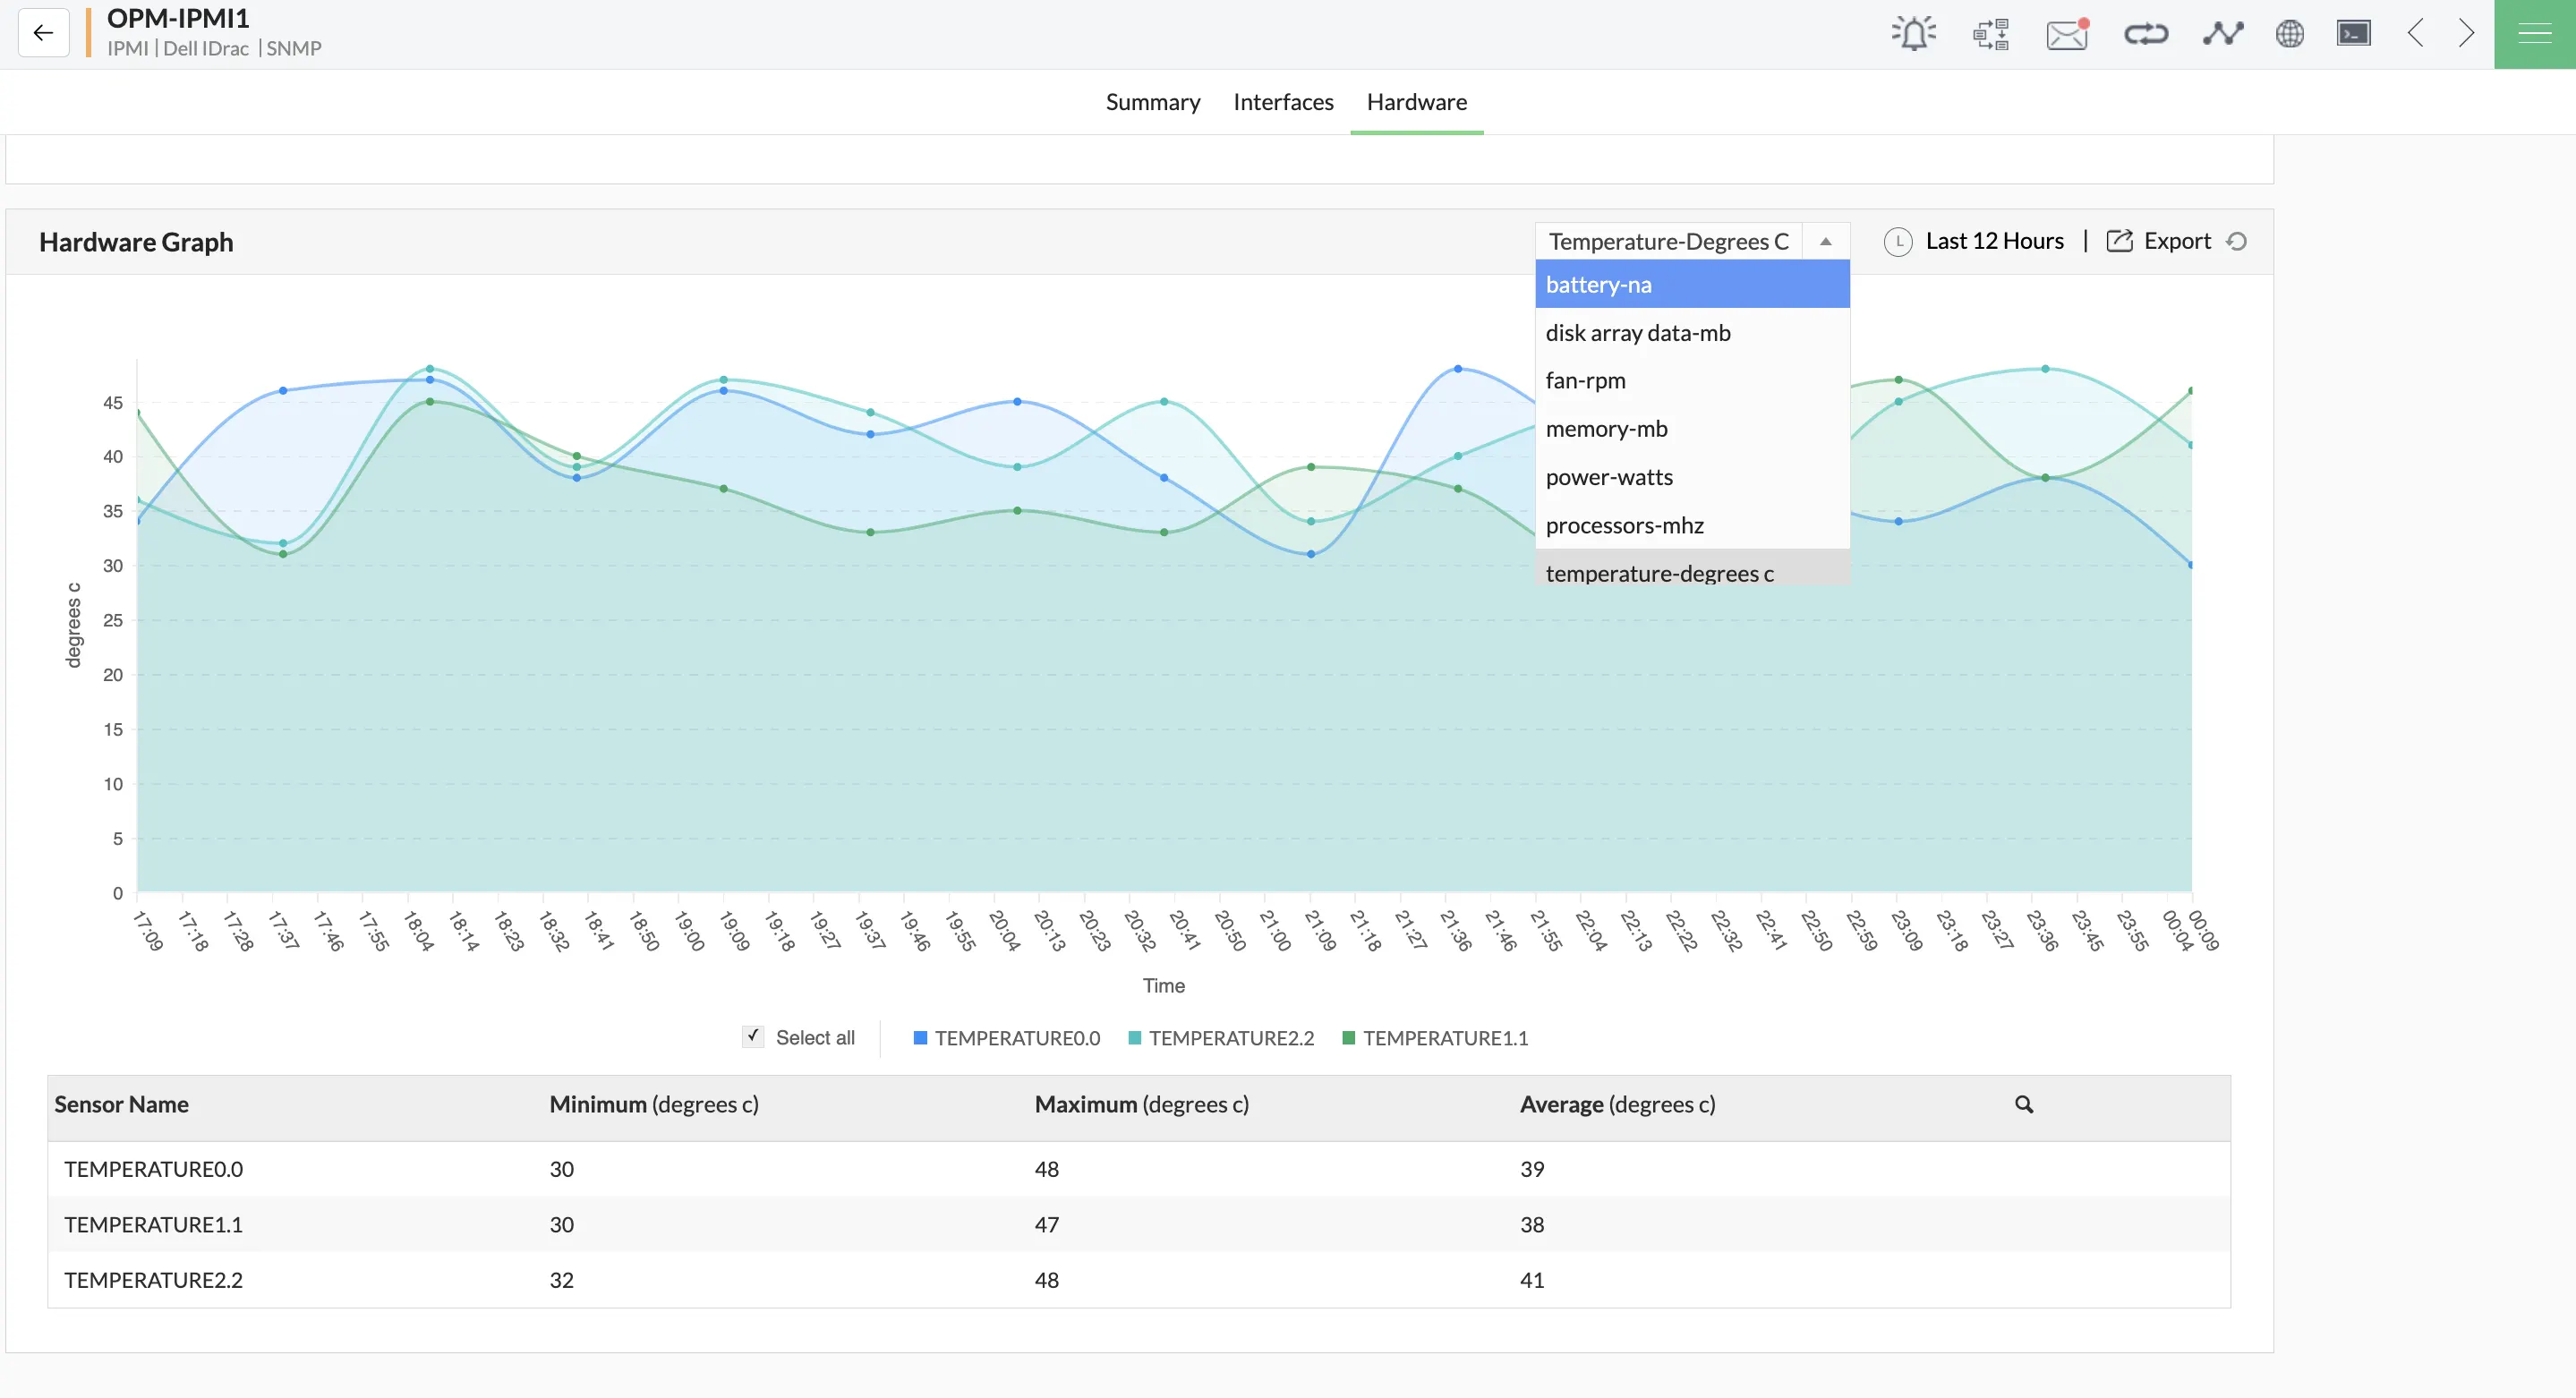
Optimize complex compute operations with GPU monitoring
- GPU monitoring supports NVIDIA GPUs on Linux servers. OpManager detects GPUs installed in your server devices and adds a dedicated GPU monitoring tab to your monitoring console.
- Track 10+ dedicated GPU performance metrics like GPU utilization, memory, temperature, and power draw for Linux-based NVIDIA GPU systems.
- Monitor key metrics like: utilization, memory, temperature, power draw, clock speed, and availability out-of-the-box.
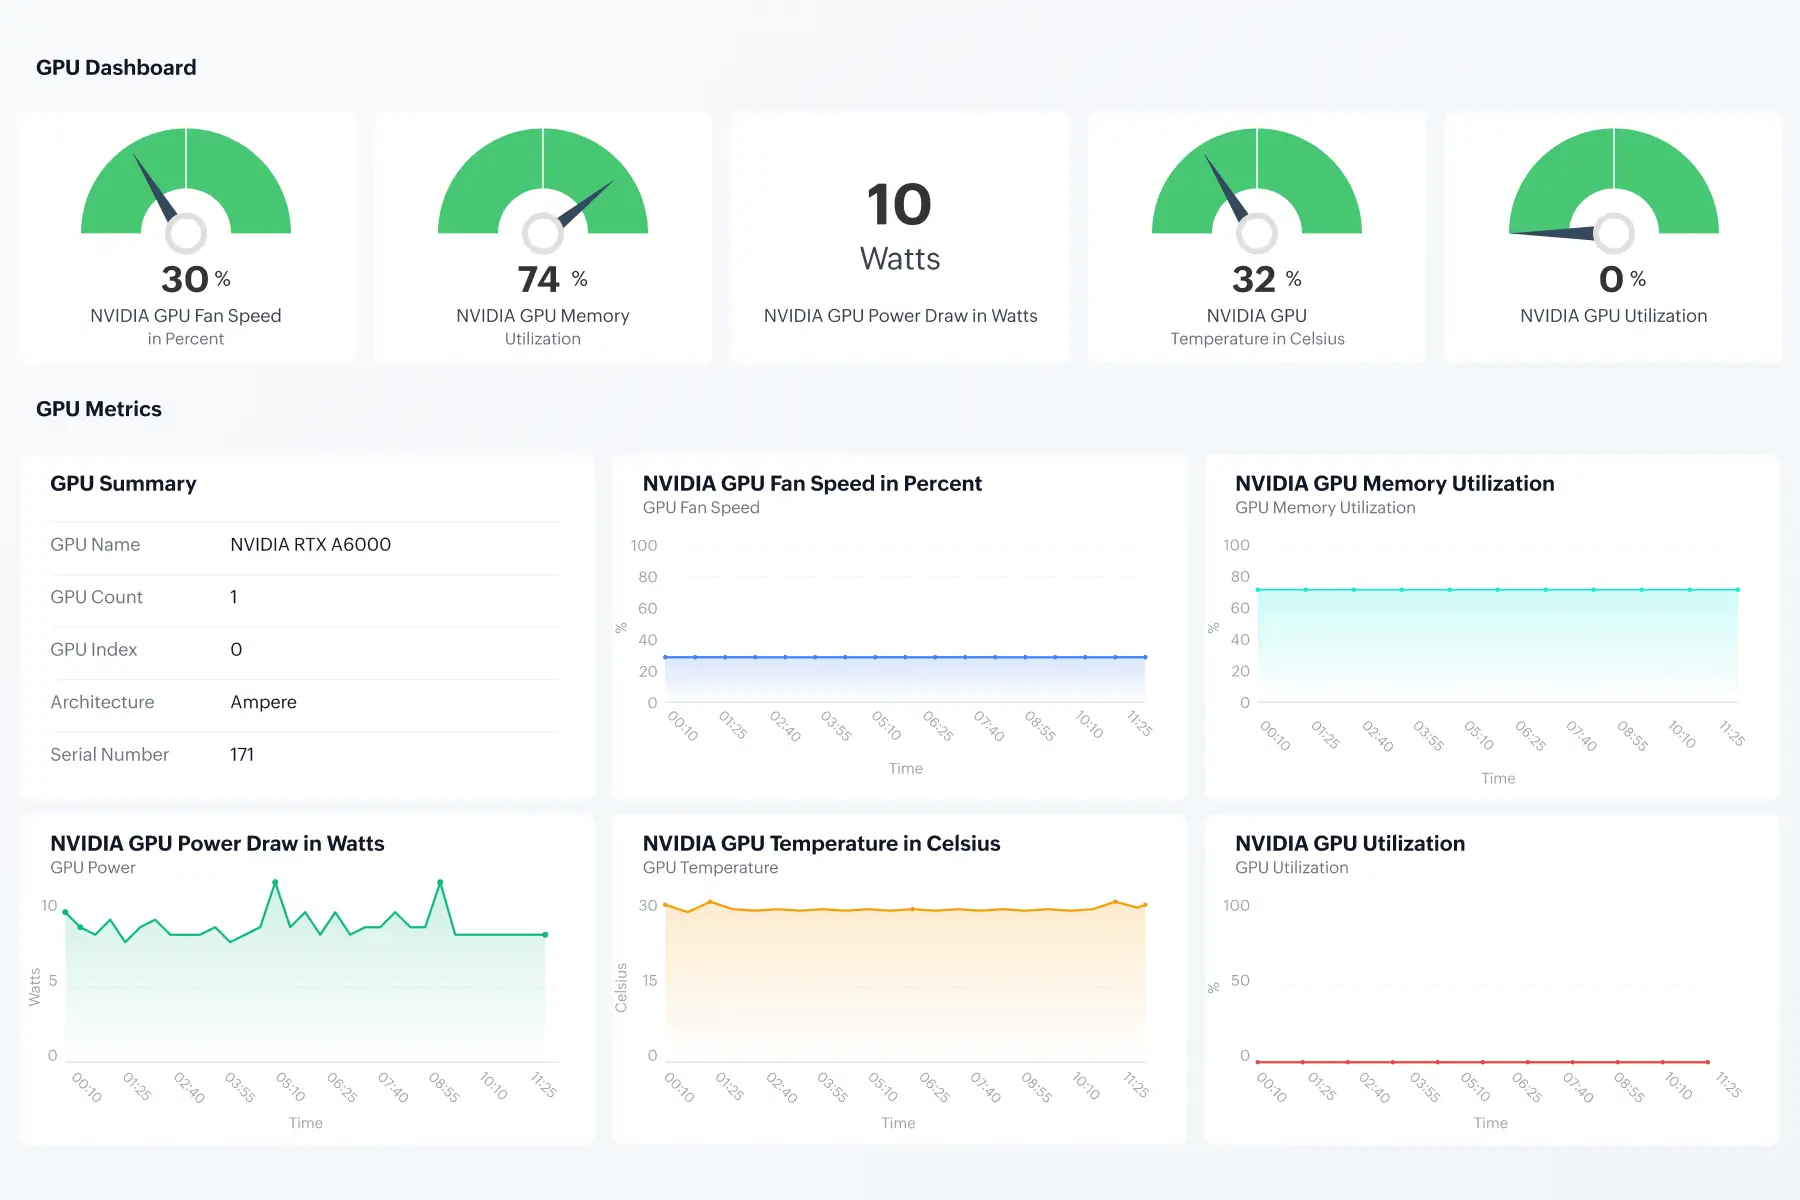
How to perform server monitoring with OpManager
OpManager's server monitoring software capabilities can be deployed with ease. You can set up automated discovery, monitoring, and alarm management to enable hands-free server monitoring. In this video, we'll explain how you can monitor server performance with OpManager.

Key server metrics you can monitor with OpManager
| Server metrics | Explanation | Monitoring impact |
|---|---|---|
| CPU Utilization | Percentage of processor capacity in use across all cores. You can set alarm thresholds for sustained high values to prevent bottlenecks, poor performance, or resource scarcity. | Continuous server monitoring of CPU catches resource strain early, enabling proactive capacity planning, fewer outages, and consistently smooth application performance for end users. |
| Load Average (Linux) | Average number of processes running or waiting to run over the last 1, 5, and 15 minutes. Values consistently above the core count indicate a sustained overload. | Tracking load average shows whether high CPU is a brief spike or a lasting overload, helping teams right-size Linux servers before performance suffers. |
| CPU Ready (VMware only) | Time a virtual machine is ready to run but waiting for physical CPU from the host. High values point to host contention or overprovisioning rather than a busy guest. | Monitoring CPU ready time exposes hypervisor contention that in-guest CPU metrics miss, helping teams rebalance VMs and restore predictable performance. |
| Memory Utilization | Percentage of physical RAM in use. Sustained high usage signals memory leaks, undersized hosts, or workloads that will soon begin paging. | Continuous memory monitoring catches resource strain early, enabling proactive capacity planning, fewer outages, and consistently smooth application performance for end users. |
| Available Memory | Amount of physical RAM still free for applications and the operating system. Falling values warn of impending paging, slowdowns, or out-of-memory failures. | Tracking available memory gives IT teams an early warning before a server starts paging, preventing sudden slowdowns and out-of-memory crashes. |
| Swap or Page File Utilization | Portion of virtual memory in use: swap space on Linux, the page file on Windows. Heavy use indicates physical RAM exhaustion and causes significant performance loss. | Monitoring swap and page file usage reveals memory pressure that RAM metrics alone can hide, helping teams add capacity before performance degrades. |
| IO Read and Write Rate | Speed of disk read/write operations. High rates suggest disk-bound applications or I/O bottlenecks. | Server monitoring of I/O rates helps pinpoint disk bottlenecks quickly, guiding optimization efforts and keeping application performance smooth. |
| Average Disk Latency | Average time for disk I/O operations. High latency indicates slow disk performance, impacting application responsiveness. | Monitoring disk latency helps catch performance degradation early, allowing IT teams to act before slow disks impact application responsiveness. |
| Disk Queue Length | Number of I/O requests waiting to be serviced by a disk. Persistently long queues indicate the storage subsystem cannot keep up with demand. | Monitoring disk queue length pinpoints storage saturation early, guiding upgrades or workload redistribution before users notice slow response times. |
| Partition Details of the Device | Information about server disk partitions. Helps with capacity planning, identifying imbalances, and space management. | Monitoring partition details supports informed capacity planning, helping prevent space imbalances and unplanned server downtime. |
| Network Bandwidth Usage | Amount of data transferred over the network. High usage indicates heavy traffic, saturation, or data transfer operations. | Tracking bandwidth through network monitoring helps prevent congestion, supports capacity planning, and ensures consistent server performance during peak traffic periods. |
| Interface Error Rate | Percentage of errors on network interfaces. High rates suggest physical network problems, impacting server connectivity. | Continuous monitoring of interface errors helps IT teams catch hardware faults early, reducing connectivity issues and improving overall server uptime. |
| Packet Loss Rate | Percentage of data packets failing to reach destination. High rates indicate network issues. | Server monitoring of packet loss enables quick detection of network faults, minimizing latency issues and protecting application reliability for users. |
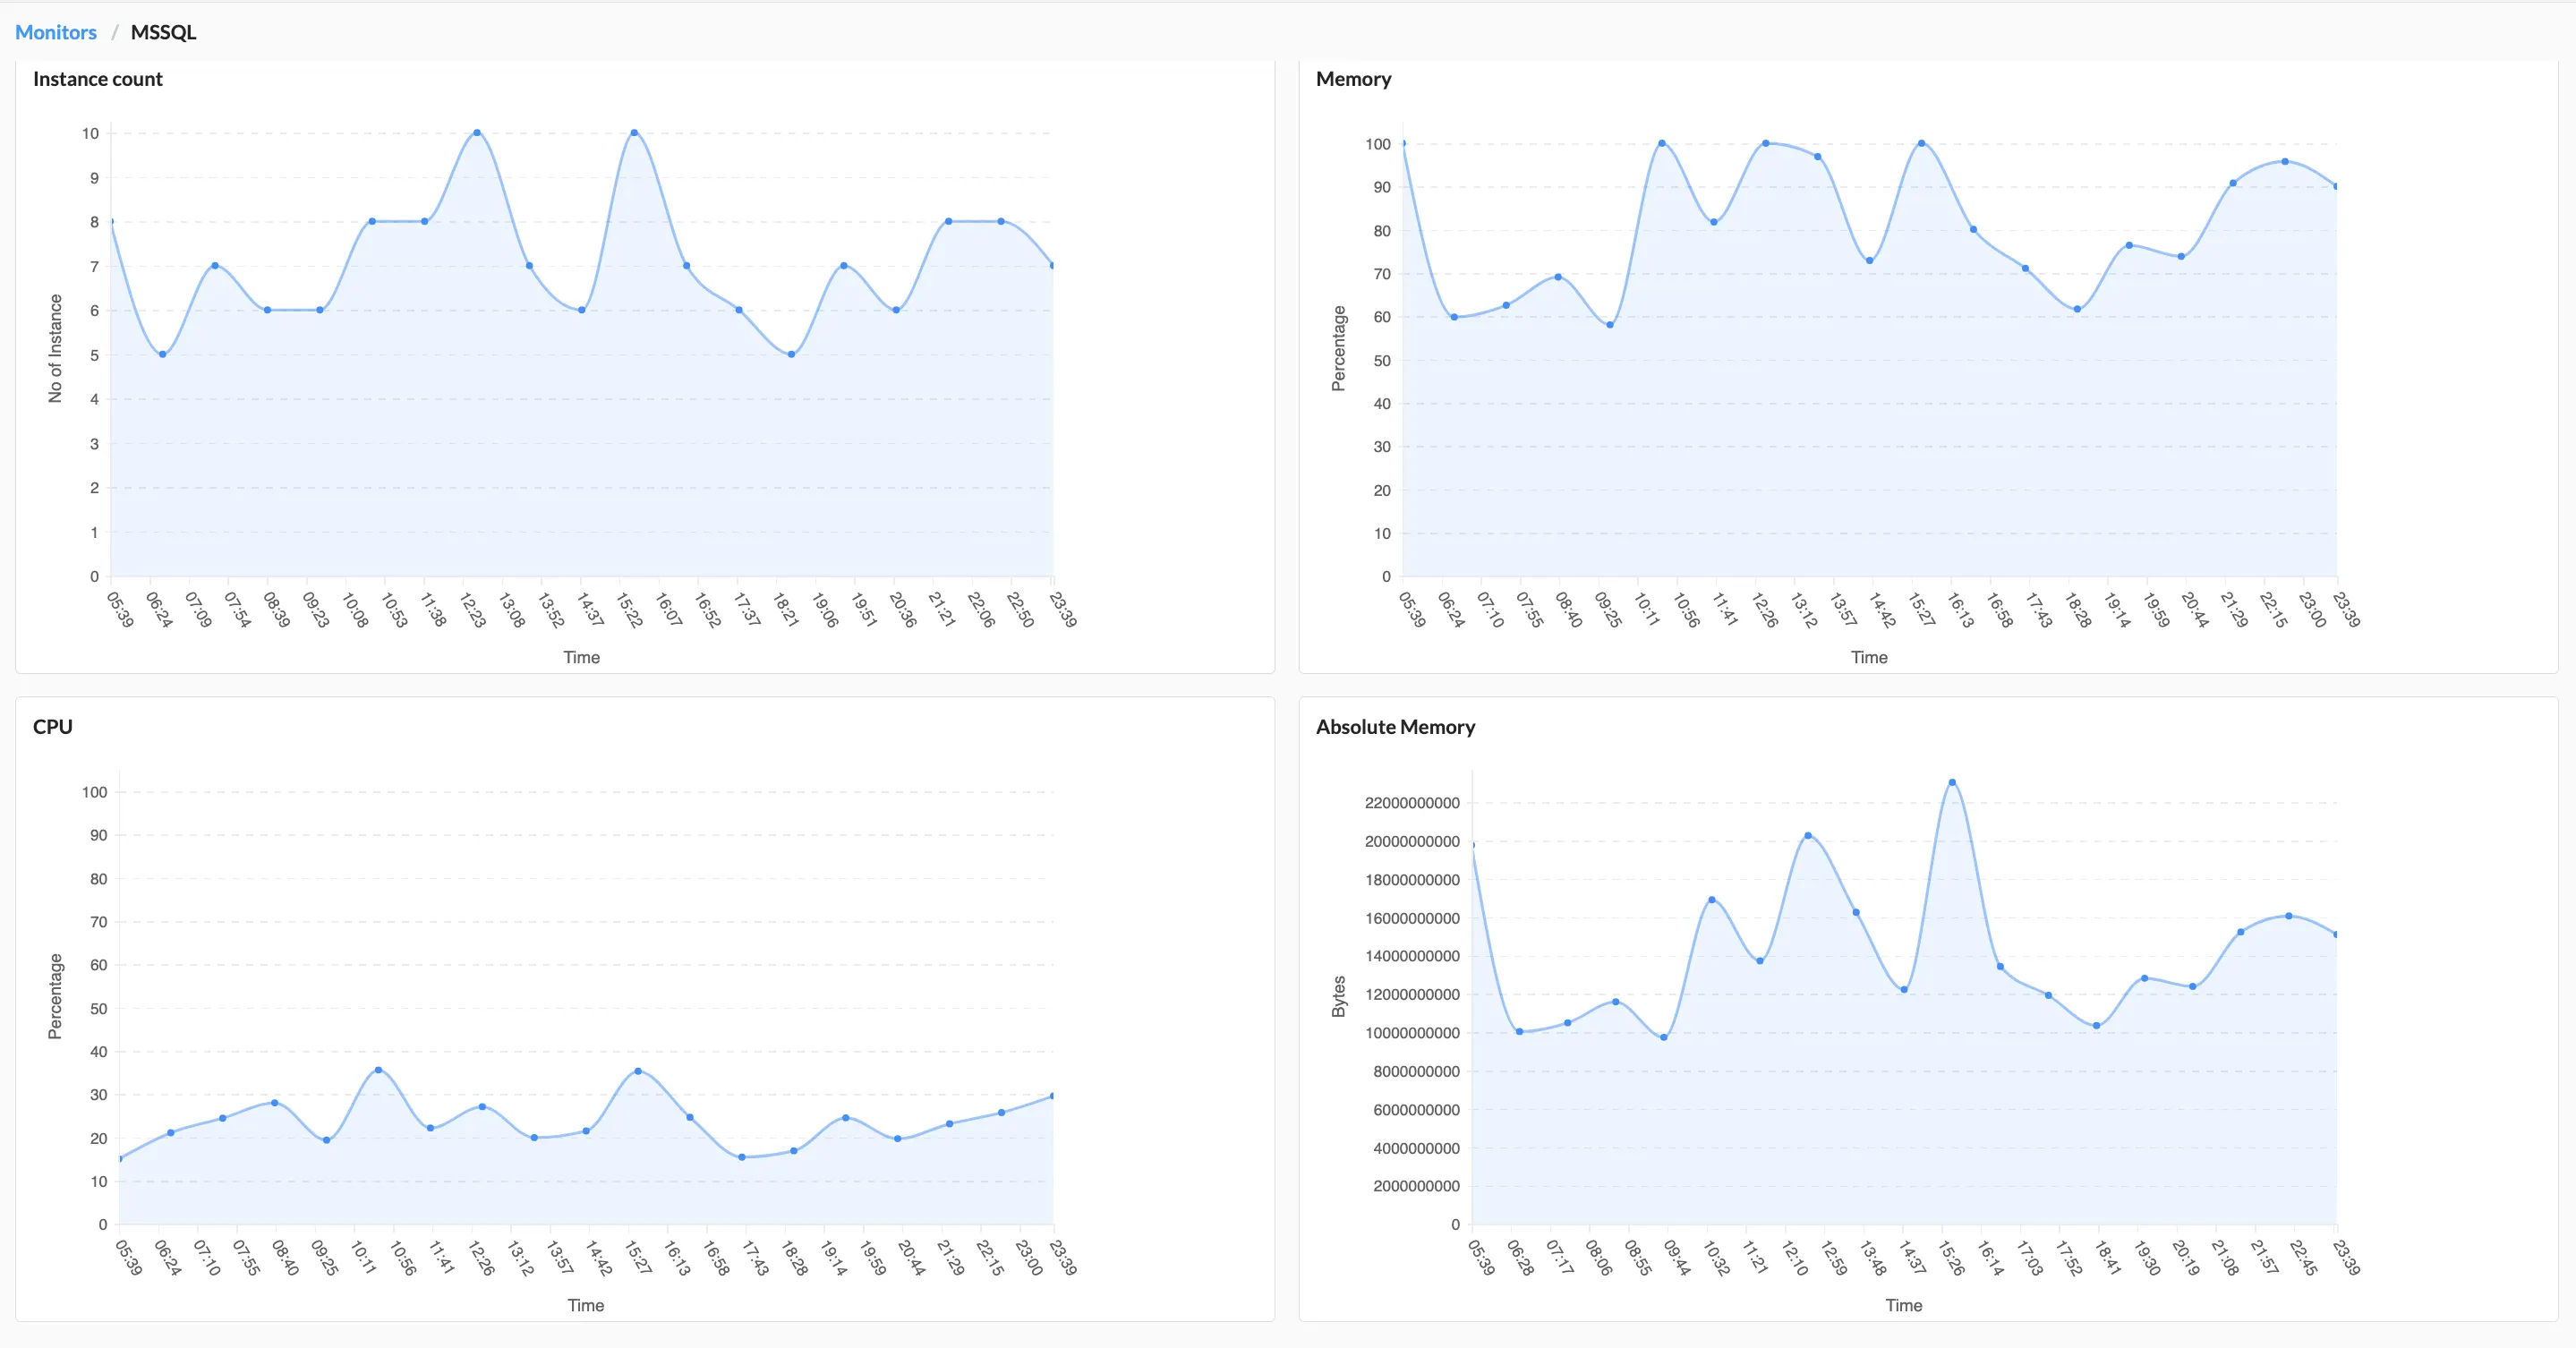
| Instance Count | Number of running application/service instances. Helps ensure scalability, resource allocation, and service availability. | Monitoring instance counts ensures proper scalability and resource allocation, helping maintain high service availability across distributed server environments. |
| Thread Count | Total number of active threads across running processes. High counts can indicate resource contention, inefficient code, or memory exhaustion. | Tracking thread count through server monitoring helps detect contention or inefficient code early, protecting against memory exhaustion and performance loss. |
Supported server types and protocols
Built-in support for hundreds of server flavours
Windows server versions
- Windows 11, 10, 8, & 7
- Windows 2025
- Windows 2022
- Windows 2019
- Windows 2012 & R2
- Windows 2008 & R2
- Windows Vista & XP
- Windows 2003
- Windows 2000
- WindowsNT & 98
Linux distributions
- Ubuntu
- Debian
- Red Hat
- CentOS & CentOS stream
- Rocky Linux
- AlmaLinux
- SUSE
- Fedora & Fedora CoreOS
- Linux Mint
- Oracle Linux & Amazon Linux
Unix-based OS
- Unix
- MacOS
- IBM AIX
- HP UX
- Sun Solaris
Practical use-cases for a server monitoring software

Free server monitoring for home servers
OpManager is useful for individuals and home server monitoring with its free server monitoring version. You can track the uptime and performance of up to three servers at zero cost.
- Run ICMP, TCP, and SNMP v3 uptime checks
- Monitor Windows, Linux, Unix, and MacOS servers
- Track server performance metrics like CPU utilization, partition-wise disk space, and memory utilization.

Server and workstation monitoring for SMBs
OpManager's automation and in-depth server monitoring capabilities enable smaller IT teams to monitor servers and workstations effortlessly.
- Auto-discovery and adaptive thresholds discover and monitors servers in bulk
- Device-based licensing ensures that you can monitor an unlimited number of metrics for your servers without having to pay extra
- Automated workflows allow smaller teams to triage and remediate server issues quickly

Distributed server and datacenter monitoring for enterprises
For large enterprises with thousands of devices or distributed architectures, OpManager's enterprise edition enables automated, scalable, and server simplified monitoring.
- OpManager scales up to 50,000 devices and 100,000 interfaces effortlessly
- With a proble-central architecture, you can monitor distributed sites and hybrid servers from a unified interface
- OpManager's datacenter visualization and unified monitoring console for the network, server, and storage systems allow enterprise IT teams to manage remote datacenters effortlessly
What sets OpManager apart from other server monitoring tools?
Flexible licensing
OpManager unifies licensing for network and server devices. Moreover, you can choose between perpetual and subscription plans.
Unmatched scalability
Scale up and monitor up to 50,000 devices across distributed sites with OpManager's enterprise editions and probe-central architecture.
Air-gapped deployment
OpManager runs on-premises. Combined with the Ollama integration, you can enable AI-driven performance analysis with no cloud-dependency.
Powerful integrations
Out-of-the-box ServiceNow, Freshdesk, Jira, PagerDuty, Ansible, Grafana, Slack, and Teams integrations. Build custom integrations with RESTAPI and webhooks.
ManageEngine FSO suite for complete server monitoring
ManageEngine's server monitoring capabilities do not stop with OpManager. You can leverage ManageEngine's full-stack observability suite to extend OpManager's capabilities as add-ons.
| ManageEngine FSO suite | Server monitoring Capability | Deployment |
|---|---|---|
| OpManager | Network, servers, storage, and VMs | On-premises |
| Applications Manager | Databases, containers, apps, cloud resources, websites, and digital experience | On-premises |
| Site24x7 | Websites and digital experience | SaaS |
| NetFlow Analyzer | Traffic, bandwidth, and packet inspection | On-premises |
| Network Configuration Manager | Compliance and config management | On-premises |
| OpManager Nexus | All-in-one | On-premises / SaaS |
FAQs about server monitoring tools
Resources to dig deeper
10 server monitoring principles every IT team should follow
Ten strategic decisions that help IT teams prevent outages instead of reacting to them.
Learn more →Unlock more value with add-ons
Extend easily with complementary products — add deeper traffic visibility, configuration management, and more.
Bandwidth monitoring
Layer NetFlow-based traffic analysis to see who and what is driving every byte across the network.
Try free trial →Firewall management
Audit firewall rule changes, spot shadow rules, and tie every config change back to the network event.
Try free trial →Network configuration
Back up configs, detect drift, and push standardized changes across thousands of devices.
Try free trial →