Alert actions
OpManager's alert notifications give you a comprehensive view of all the alerts that have been triggered in your network. Go to the Alarms tab to see a list of all OpManager alarms. From here, you can perform a variety of alarm operations such as acknowledge, clear, and delete. The following is a list of all actions that can be performed from the OpManager Alarms tab.
- Acknowledge: This option allows operators to pick up a problem and work on it. When you select an alarm and click Acknowledge at the top of the alarms list, the administrator or operator's name is populated in the technician field.
- Unacknowledge: The assigned technician is removed and the alarm is returned to the unassigned list.
- Clear: Click this to clear an alarm manually.
- Delete: Deletes the selected alarm.
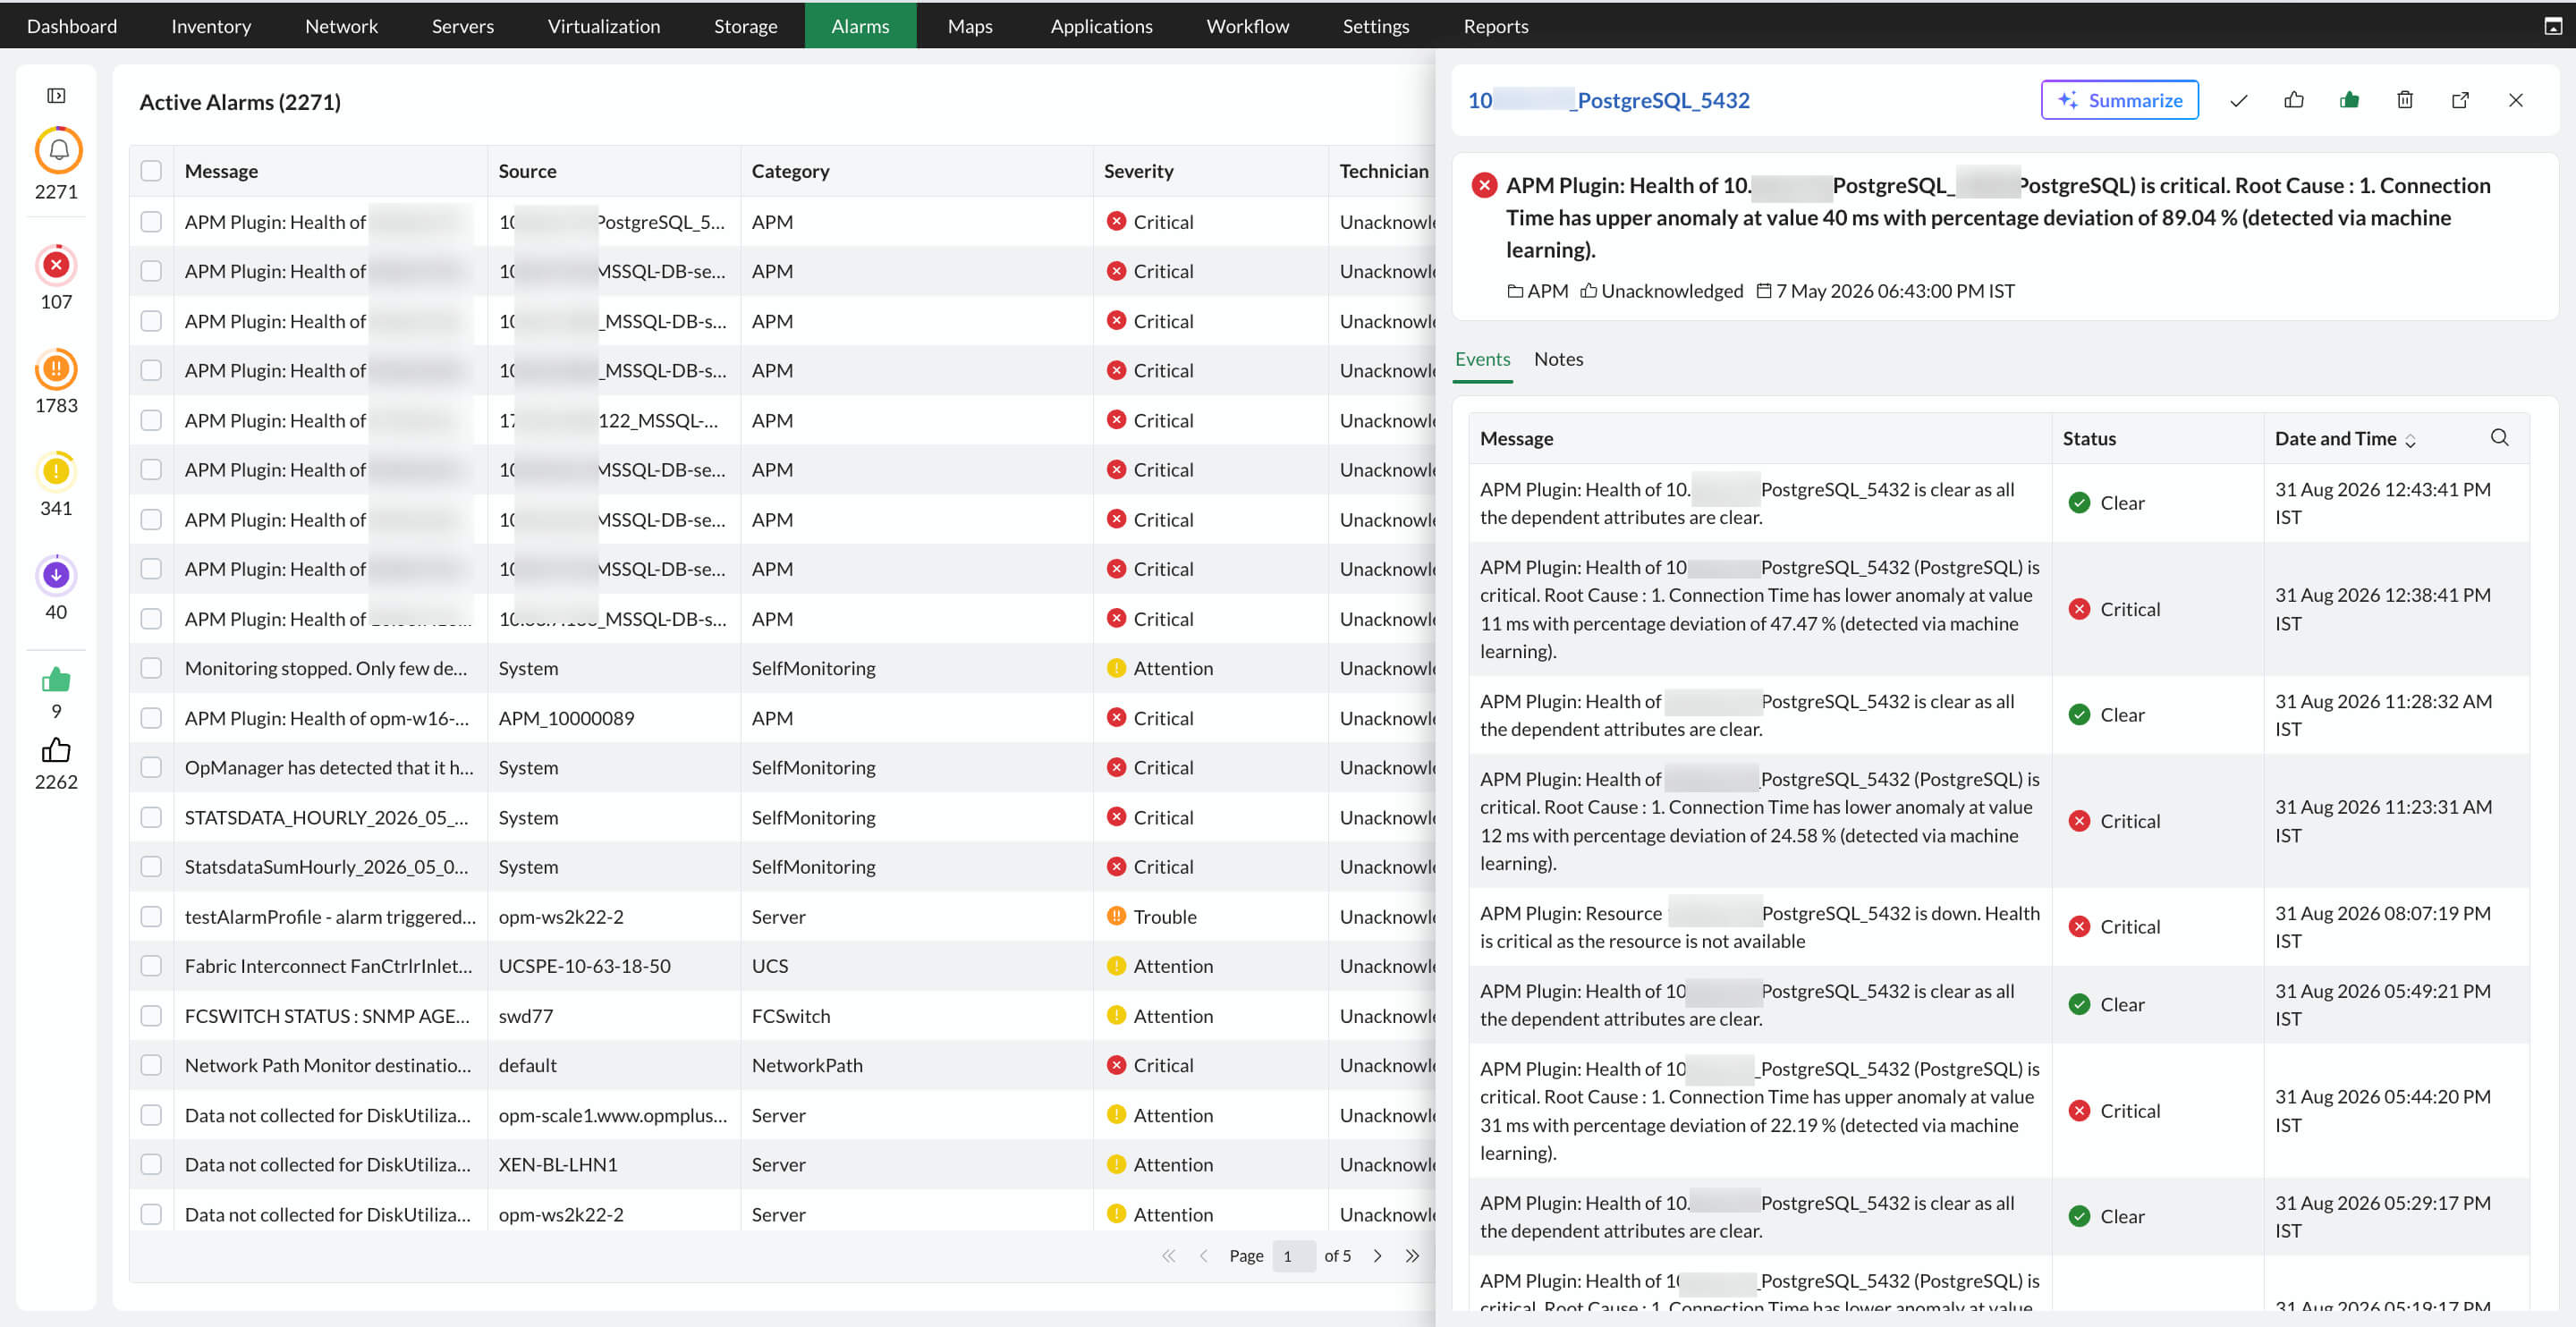
- View history: Click the alarm message to view the alarm details and event history.
- Add notes: Add notes to an alarm to explain the steps taken to correct the fault or to provide guidance to the operator working on it. In the Alarm History page, click Add Notes.
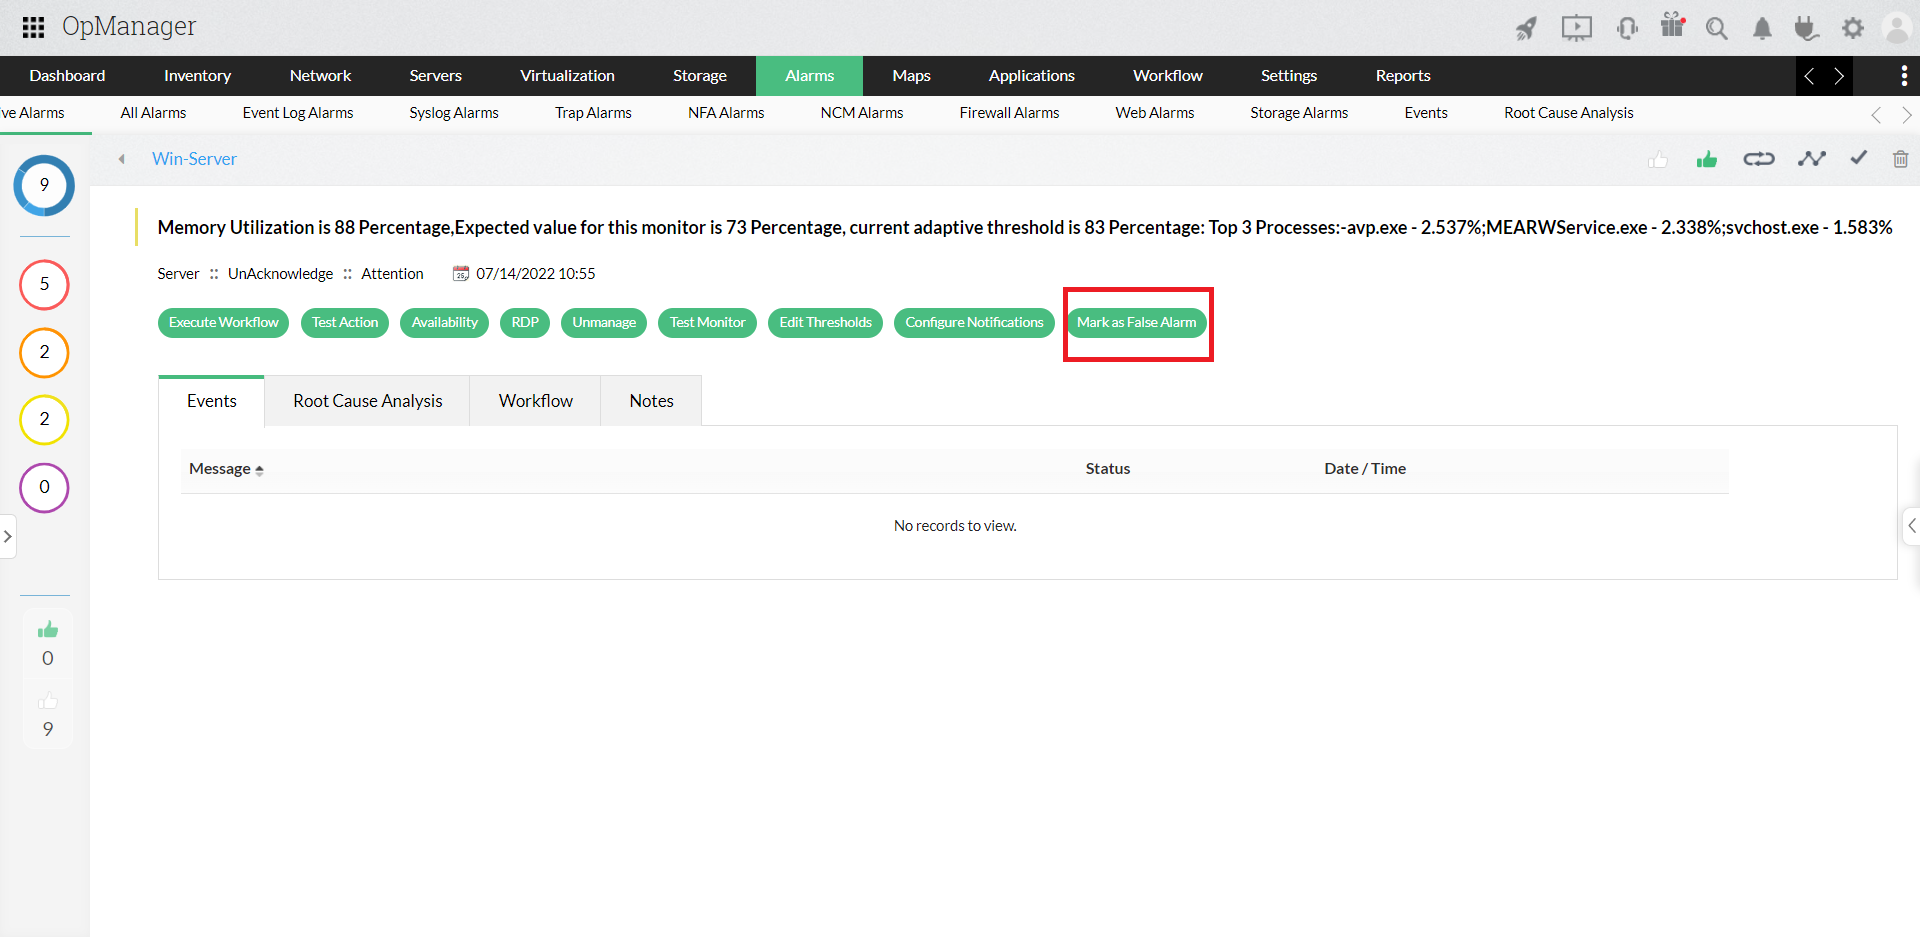
- Execute workflow: Execute a workflow to troubleshoot an alarm. Click Execute Workflow in the Alarm Details page, select the workflow, and the output will be added to the notes.
- Test actions: Notify this alarm via any notification profile you have created. Click Test Actions in the Alarm Details page and select the desired notification profile.
- View availability: View the availability history of the faulty device. Click the More link in the Alarm Details page and select Availability.
- Ping: Ping the faulty device by clicking the Ping icon at the top of the Alarm Details page.
- Trace route: Trace the route to the faulty device by clicking the Trace Route icon at the top of the Alarm Details page.
- Unmanage: Alarms created for devices under maintenance can be avoided by moving the device to unmanaged state.
- Configure notifications: Configure a notification profile for the faulty device. Click Actions > Configure Notifications from the Alarm Details page.
- Edit thresholds: Configure the threshold values for criticality levels. An alarm is raised if a device fails to meet the threshold conditions.
- Test monitor: Use the test monitor to check whether the monitor is fetching data.
- RDP: Perform a remote desktop action on the monitored machine via Remote Desktop Protocol (RDP). Applicable only for WMI-based devices.
Note: Acknowledged alarms can be excluded from escalation by configuring the alarm escalation rule accordingly.
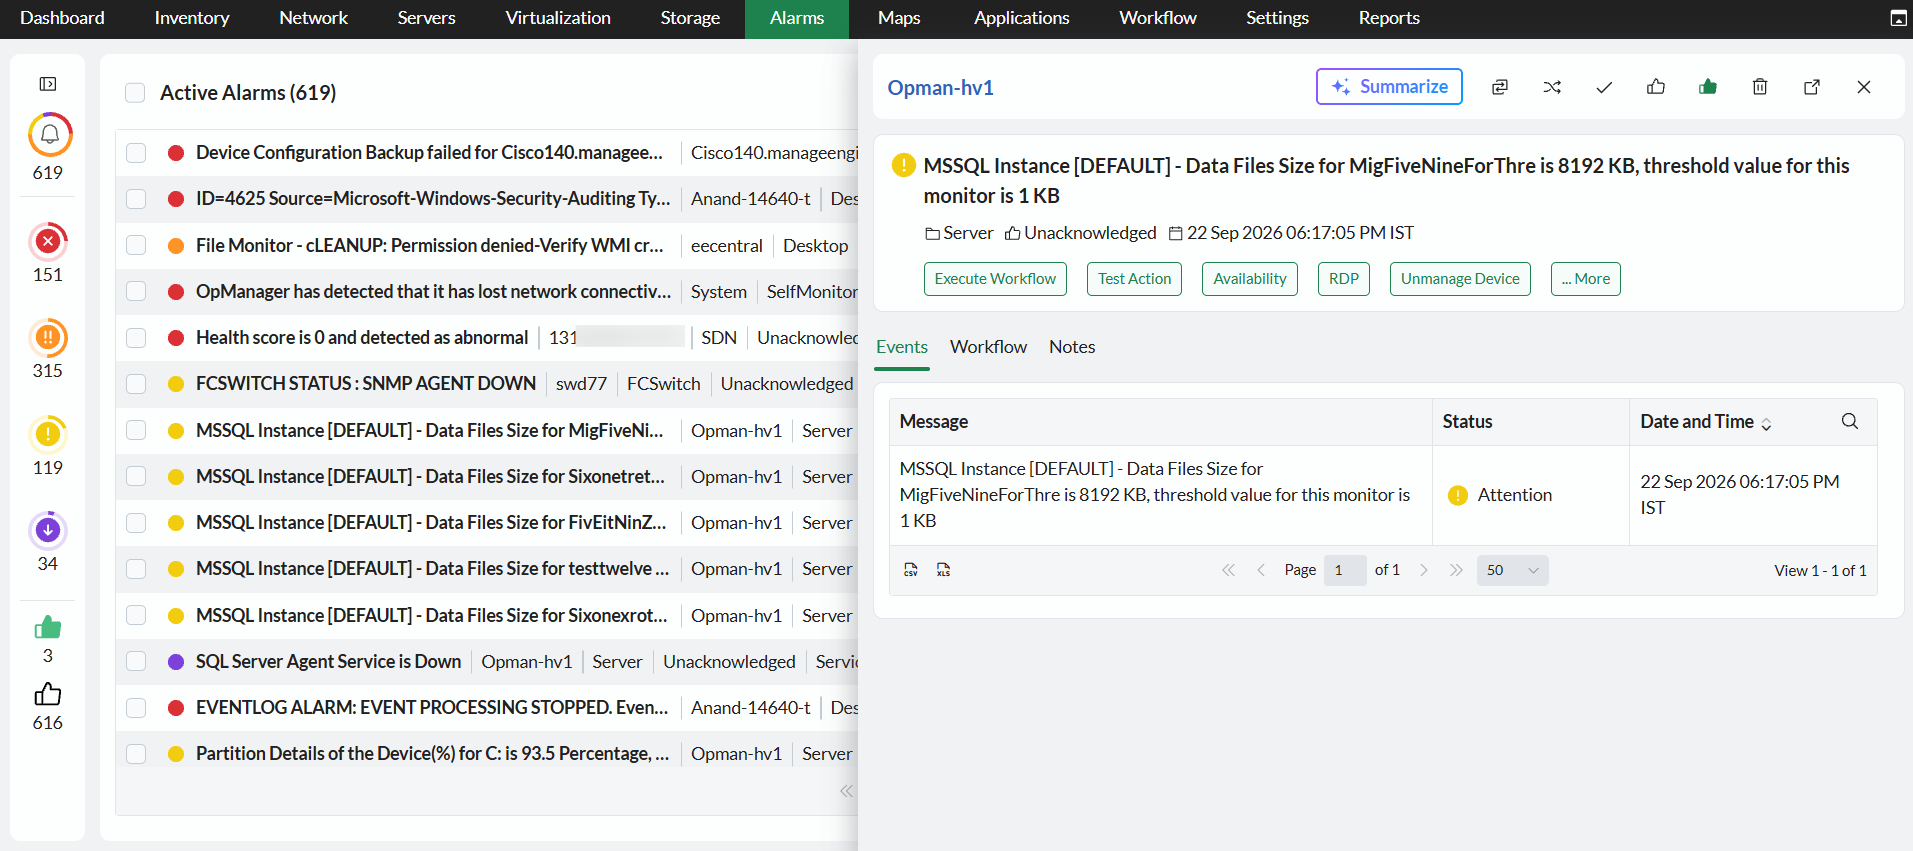
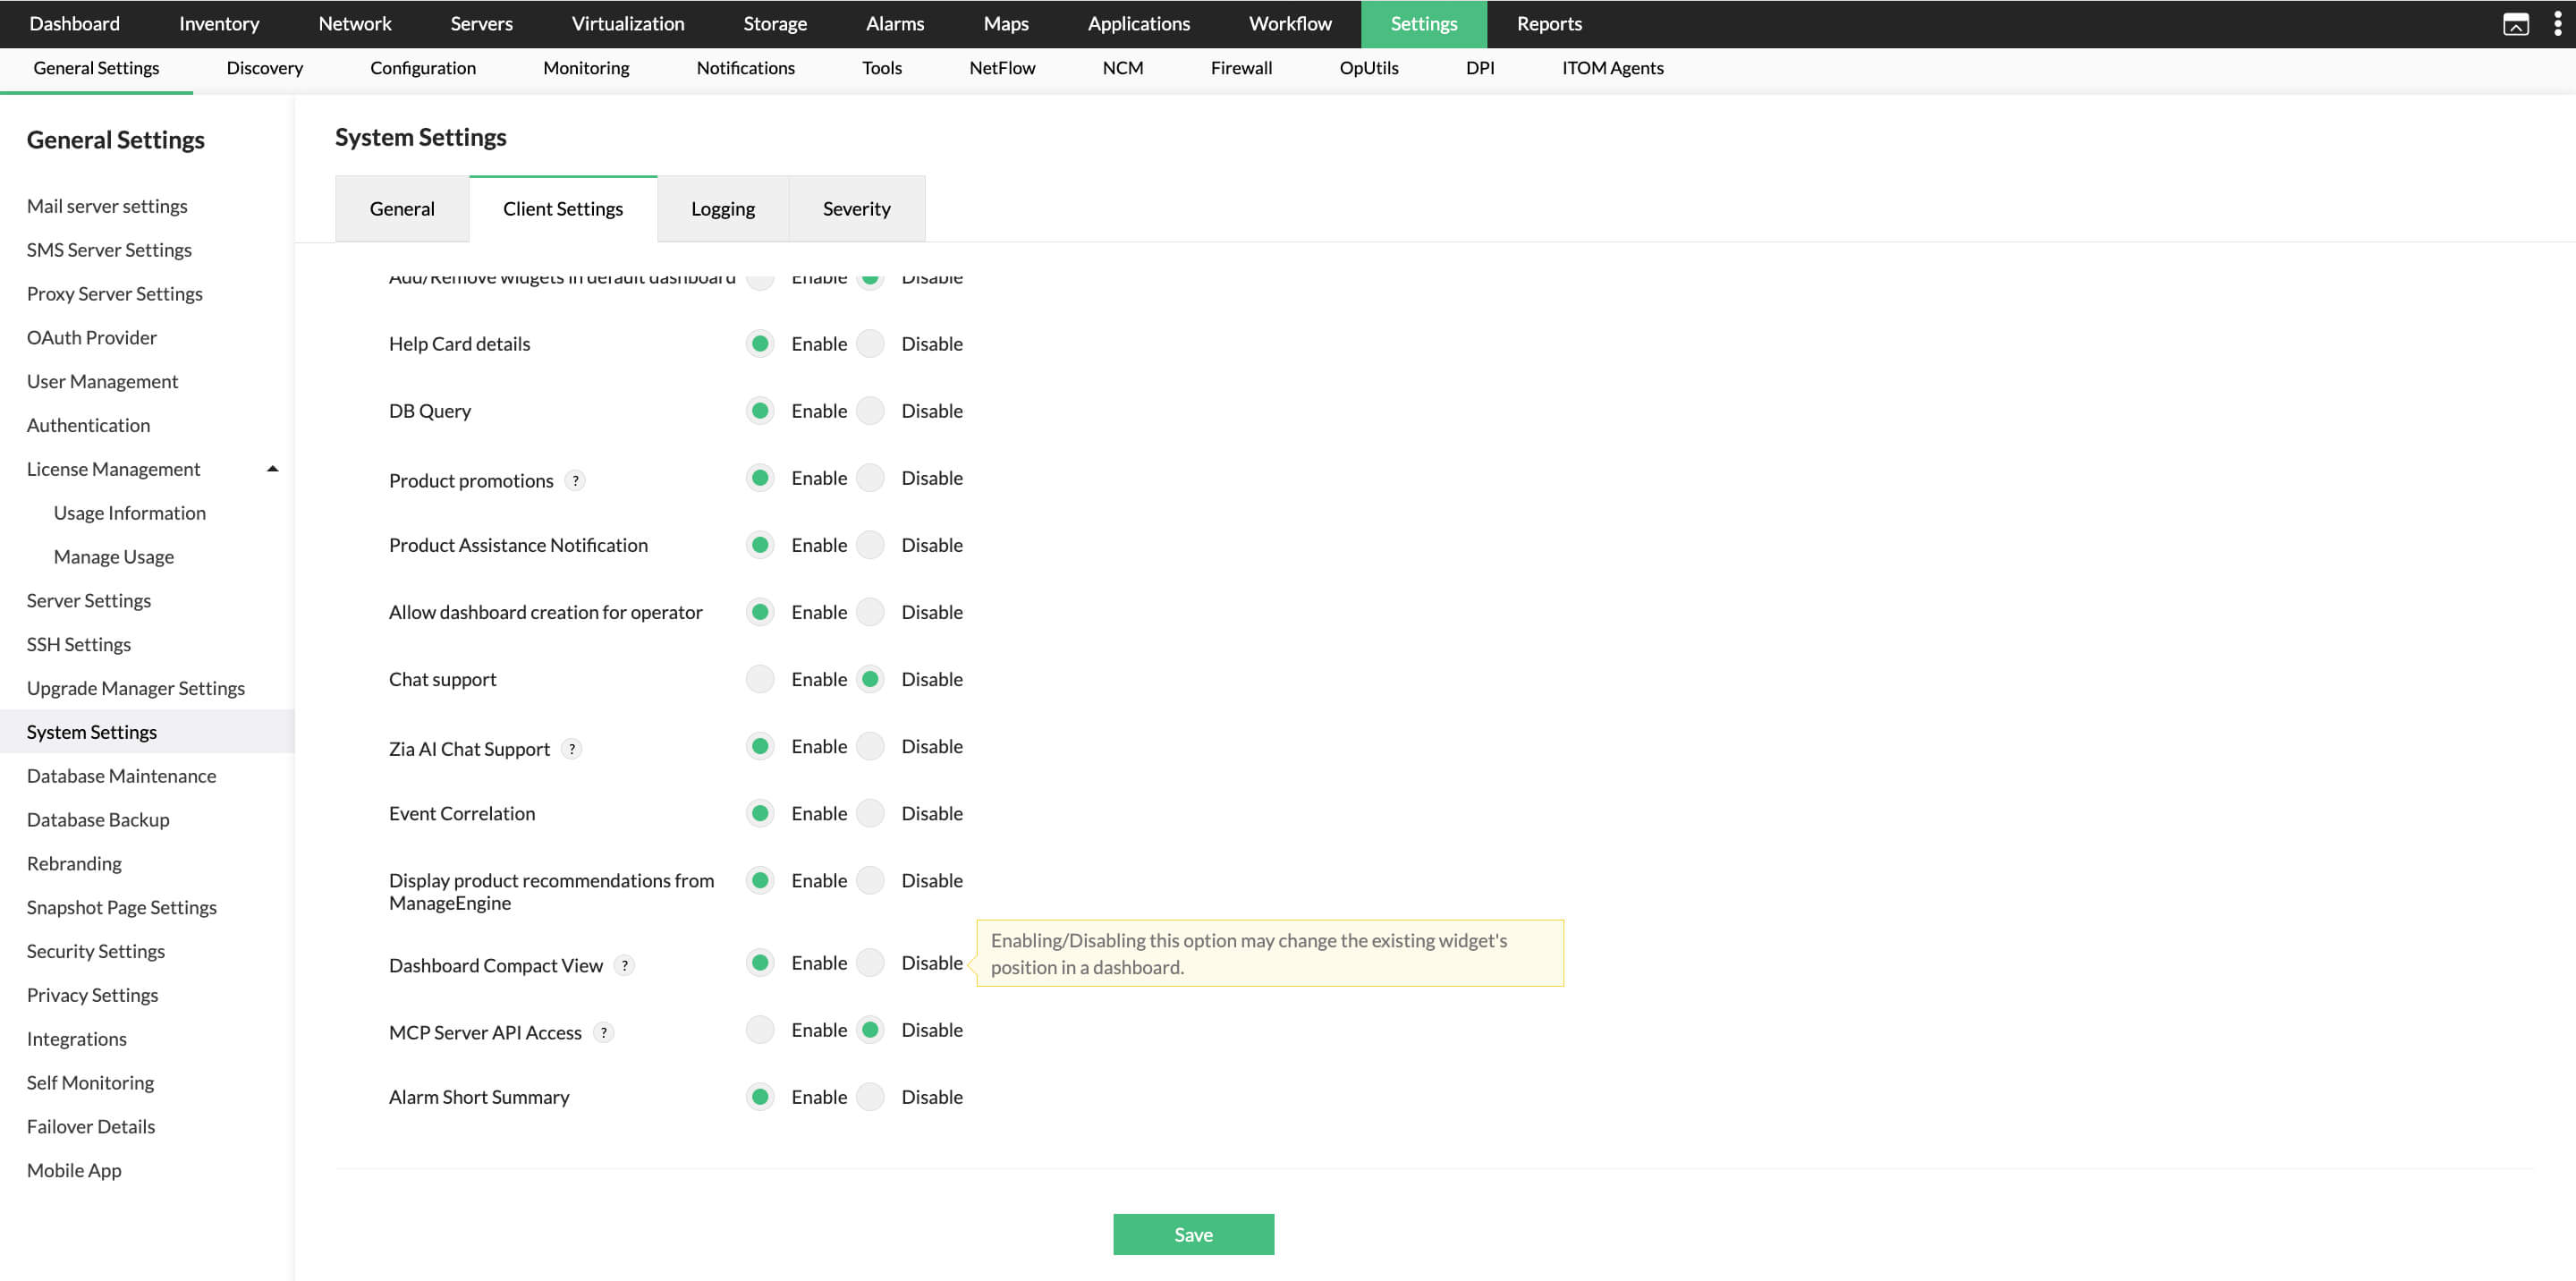
- Alarm Short Summary: The alarm short summary provides a quick overview of the details associated with an alarm. To enable or disable the alarm short summary, go to Settings → General → System → Client Settings
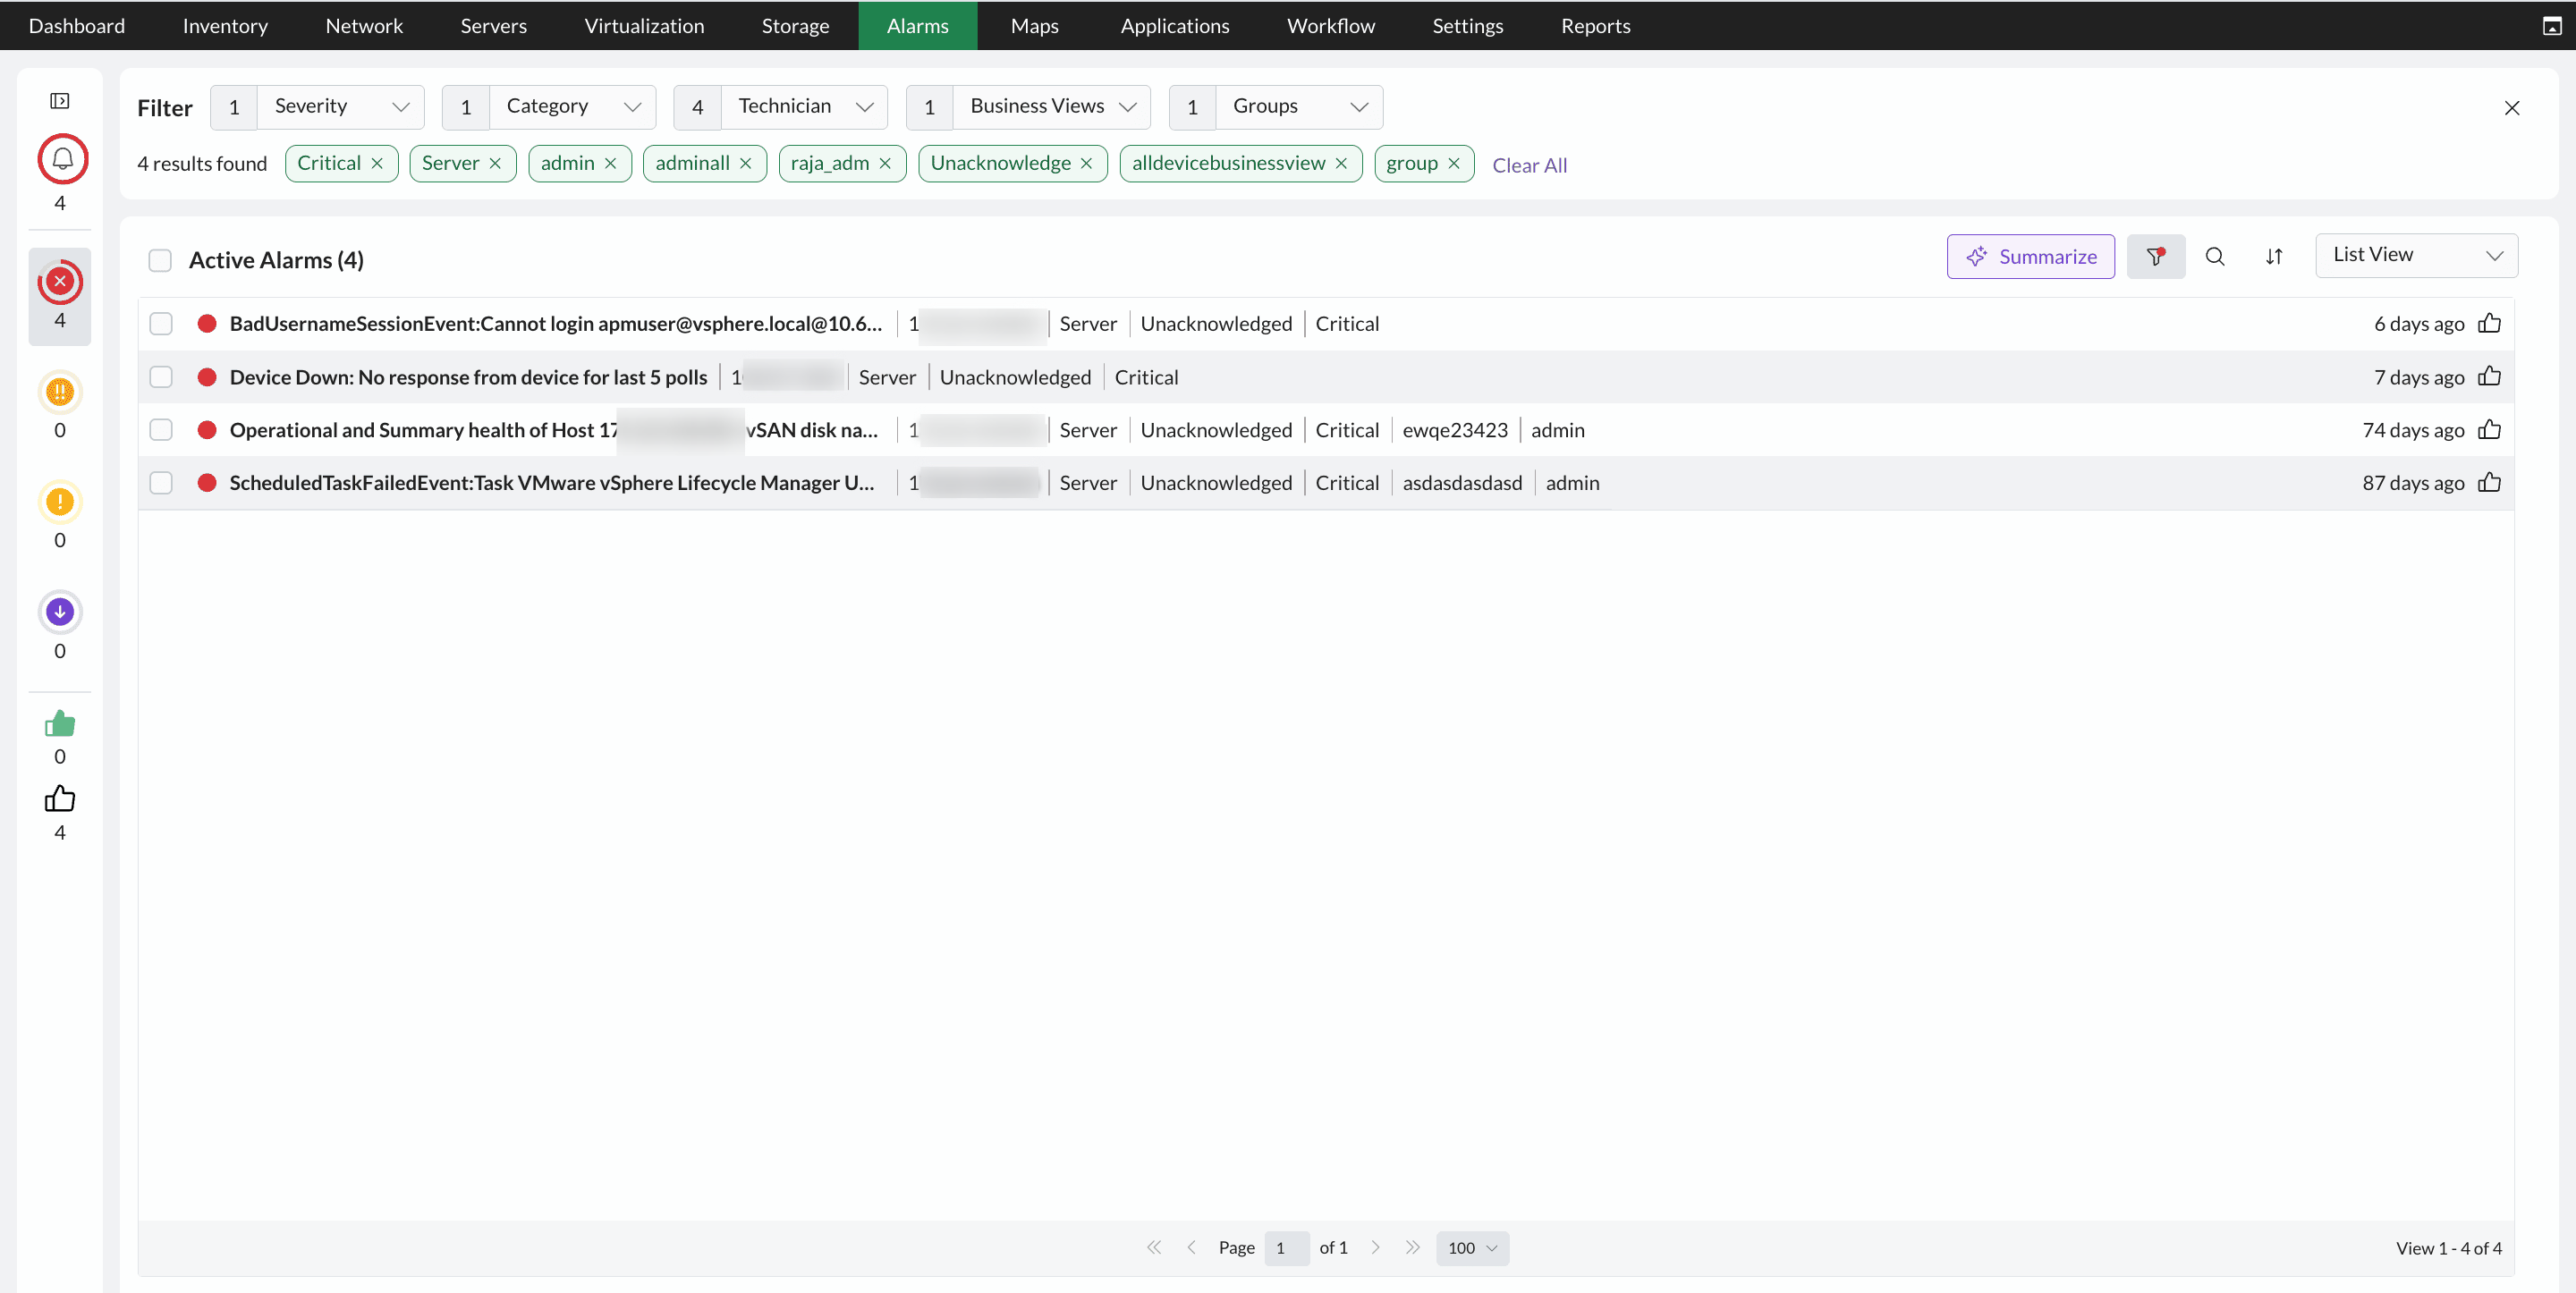
- The Alarms List page includes a filter section at the top, allowing you to filter alarms by severity, category, technician, business view, and group.
Mark as false alarm
When you configure adaptive thresholds, OpManager devises threshold values for monitors based on previous statistical data and raises an alarm when a threshold is violated. Sometimes the threshold value devised for a monitor may be less than the regular usage value (which is considered safe for that device), so an alarm in that case does not indicate a serious problem.
For example, the CPU utilization threshold for an important application server that runs 24/7 may be 30% at midnight, but the actual usage may go up to 50—60%, which is considered normal because users are always accessing that application. An alarm raised for this device does not indicate a potential problem. You can mark such alarms as false using the Mark as false alarm button.