Fault Monitoring And Escalation
The traps and other notifications from the devices are received by the software, and converted into events and alarms. Depending of the criticality of the fault condition, each event and alarm is assigned a severity, ranging from Critical to Clear. Each severity is given a specific color for easy visual identification.
OpManager actively monitors the faulty events and reports, or escalates the faults to the user, administrator, or any other person via email or SMS.
Alarms are widely classified into two types: Device status-based alarms and Threshold-based alarms.
The topics covered under this section are:
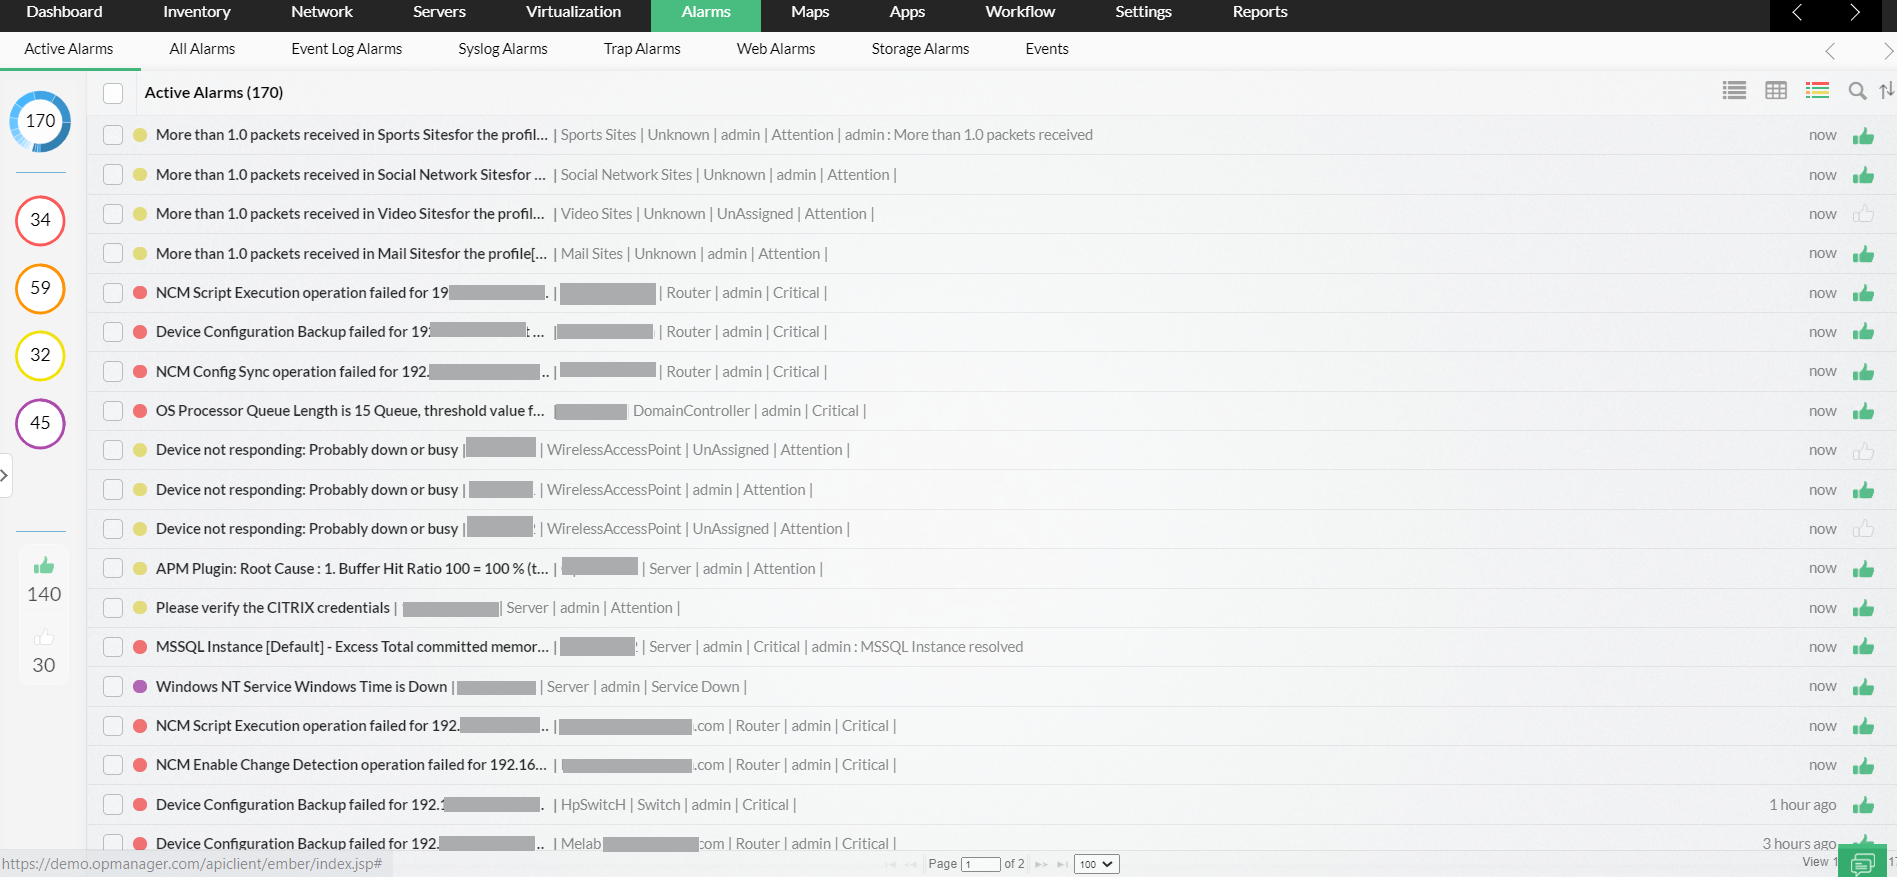
You can view all the alarms in a single console under Alarms tab. Here, the alarms related to storage can be found by clicking Filter → Storage Alarms from the Sort by category panel.
This tab displays all the alarms with their Source, Status, Date & Time, and Message. It displays a maximum of 500 alarms in a page, and you can use the navigation buttons on the bottom of the page to view the other alarms. Each column heading is a link, which, when clicked, sorts the alarms based on that criterion.
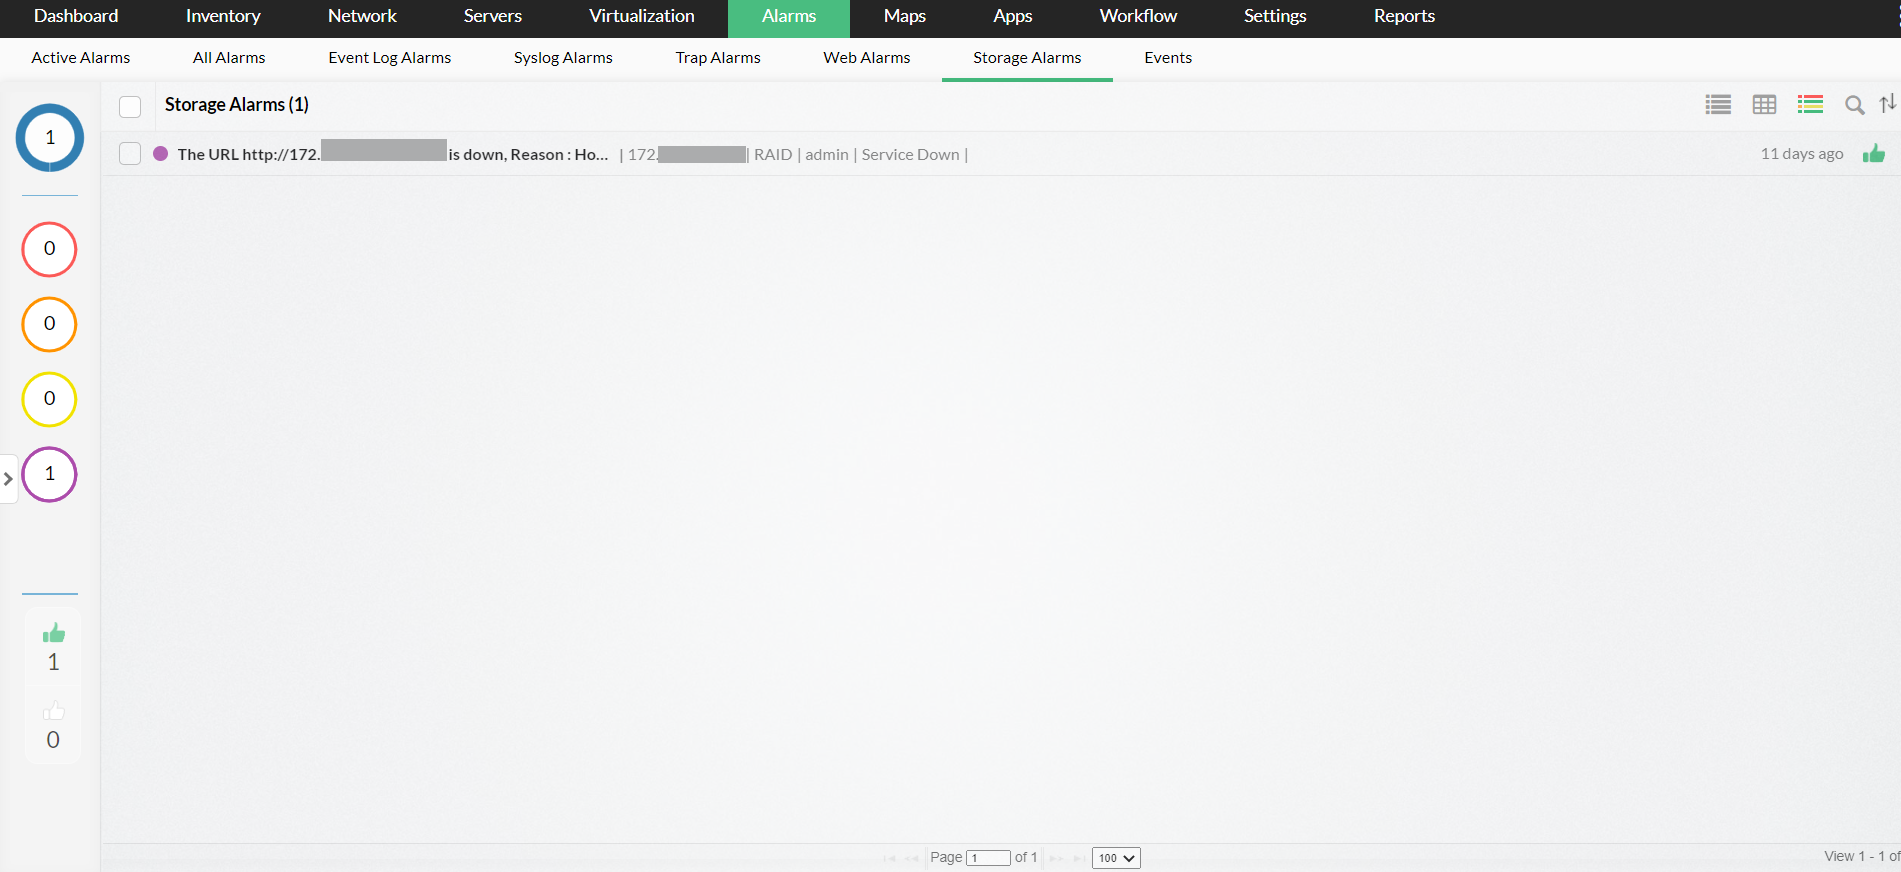
You can go to the Alarm details page with a single click. To see the details of the device that caused an alarm, click on the source link of the alarm. To see the details of the alarm, click the message of the alarm. Alarms can be sorted based on criteria (Severity, Category, or Time Period) by clicking on the relevant heading on the alarms panel. If required, you can export the same to HTML, PDF, Excel sheet and CSV formats.
Just above the table, on the top right corner, there are options to acknowledge, clear, or delete alarms. To do any of these operations, select the specific alarms, and clicking on the corresponding link.
Viewing alarm details
Clicking on the message link in an alarm brings you to the alarm details page.
Alarm details page shows:
- Message - The warning message in the specified alarm.
- Status - The status of that alarm (Attention, Trouble, Critical or Clear).
- Date & Time - The date and time at which the alarm was triggered.
- To see details of the device that caused the alarm, click on the source link.
Just above the table there are options to acknowledge, clear, delete, and annotate alarms, described below.
Alarm Operations
Acknowledging Alarms:
OpManager provides an option for the users to pick and own alarms that they work on. This helps in avoiding multiple users working on a single alarm.
Alarms can be acknowledged in two ways:
- In the 'Alarms' tab, select the checkbox before the specific alarm and click ‘Acknowledge’. This option is available only for Admin users.
- In the alarm details page, click ‘Acknowledge’.
By doing one of the two actions above, the user becomes the owner of the particular alarm. To unacknowledge an alarm, click ‘Unacknowledge’ in the alarm details page. The alarm ownership gets removed.
Annotating Alarms:
To annotate an alarm, click ‘Add note’ in the alarm details page and add the content in the text-box. The annotation will get added in the alarm notes table.
Clearing alarms:
After fixing the fault condition in the device, click ‘Clear’ in the alarm details page to set the alarm's severity to clear.
Deleting alarms:
To delete an alarm, click ‘Delete’ in the alarm details page. The alarm and its related events will get deleted permanently.
Escalate unattended alarms
When some alarms are not attended for a particular time-period, it needs to be escalated to the administrator or the IT manager (based on need). For example, you get a critical alarm for a tape library and the fault condition is not resolved within 6 hours, it might cause a major problem in the operation of the storage infrastructure. Such alarms can be escalated and quick action can be taken to avoid any major problem.
To add an alarm escalation rule:
- From web client go to Settings → Configuration → Alarm Escalation rules.
- Click on 'Add Rule'.
- Enter a name for the new rule.
- Provide all the details for the escalation rule.
- Provide the contact details of the people that have to be notified.
- Enter the time duration in which the above rule has to be checked.
- Click ‘Add Rule’.
The rule gets added in the table in the page. You can disable the rule by clicking on the green icon inside the modify rule window.
To modify an alarm escalation rule:
- Click the name link of the rule that needs to be modified.
- The configured values are shown in the form below.
- You can edit the required values and click ‘Save’.
To delete an alarm escalation rule:
- Click the trash-can icon against the particular rule, in the escalation rules table.
Note: The mail server must be configured before adding an alarm escalation.