APM Insight Node.js agent performance report
The performance report helps you enhance the APM Insight Node.js agent and boost your application's overall performance.
- Test environment
- Impact on application's response time
- Impact on CPU usage
- Impact on memory consumption
Test environment
OS: Ubuntu 20.04.1 LTS
CPU: 6-core
Memory: 15.3GB
Version: Node.js 16.6.0
Application framework: Express 4.18.2
Impact on application's response time
Four sample Node.js application instances were run with and without the APM Insight Node.js agent at 300 and 600 transactions per minute, respectively. The data was collected over a period of two hours, and the results are summarized below:
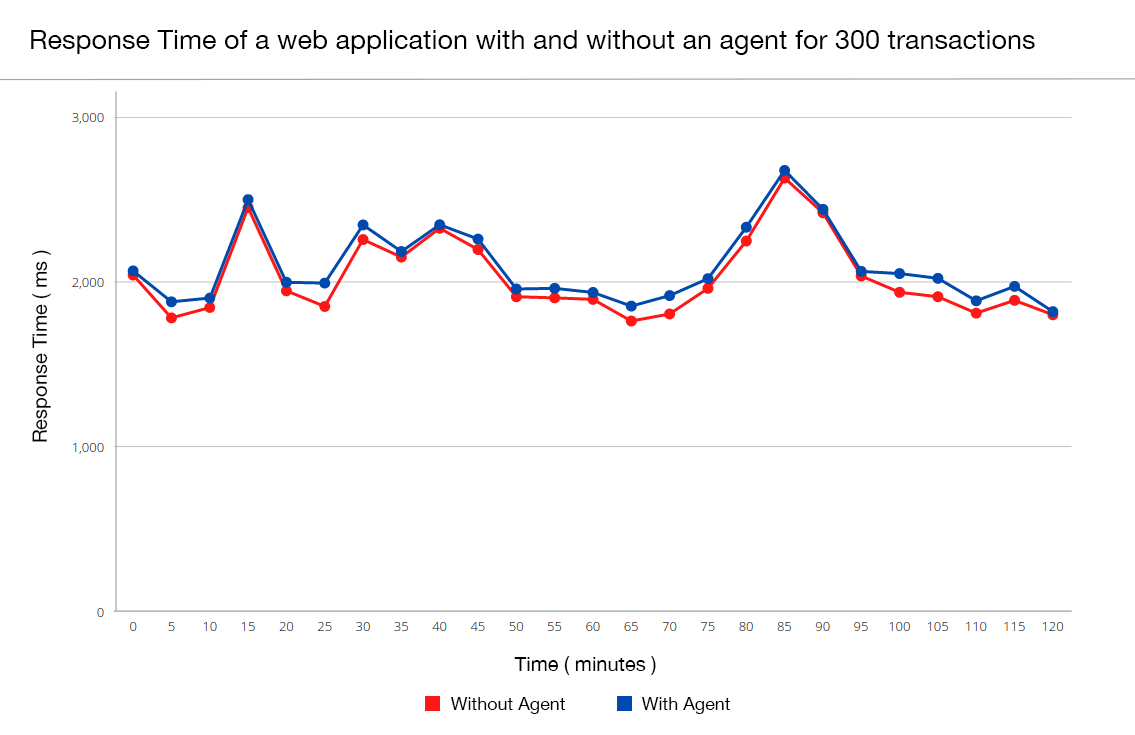
300 transactions per minute:
| Response time summary | Without agent | With agent |
|---|---|---|
| Average response time (ms) | 2029 | 2054 |
| Peak response time (ms) | 2452 | 2485 |
The average time difference observed while running applications with and without the APM Insight Node.js agent is approximately 1.40%. The timeline chart below explains the historical trend:
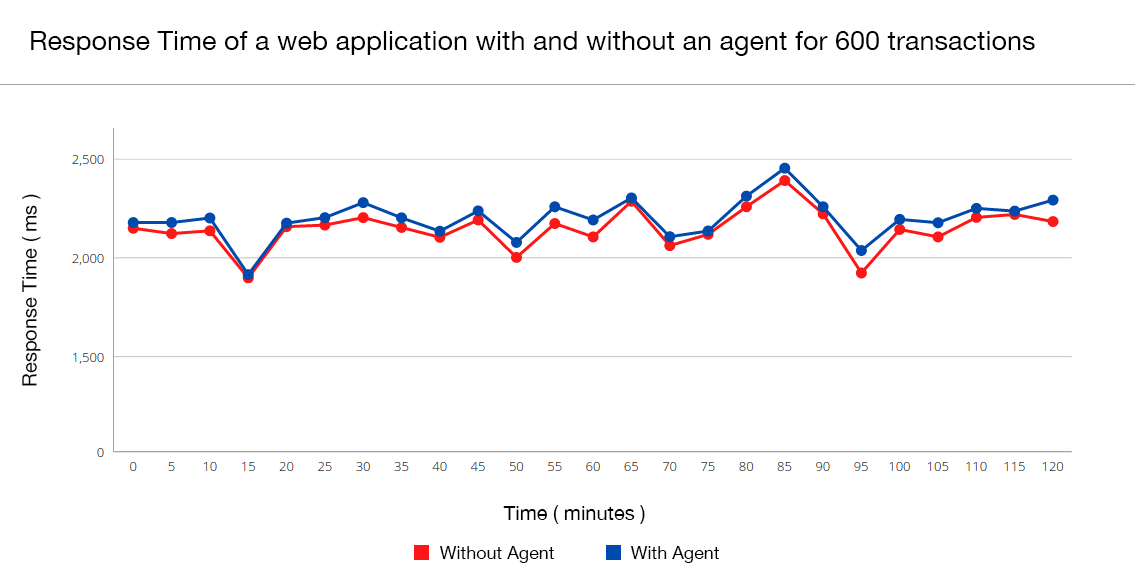
600 transactions per minute:
| Response time summary | Without agent | With agent |
|---|---|---|
| Average response time (ms) | 2130 | 2194 |
| Peak response time (ms) | 2475 | 2498 |
The average time difference observed while running applications with and without the APM Insight Node.js agent is approximately 3%. The timeline chart below explains the historical trend:
Impact on CPU usage
The CPU consumption of the APM Insight Node.js agent largely depends on the number of methods instrumented.
The data shown below is a compilation of data from applications that ran parallel with and without the APM Insight Node.js agent.
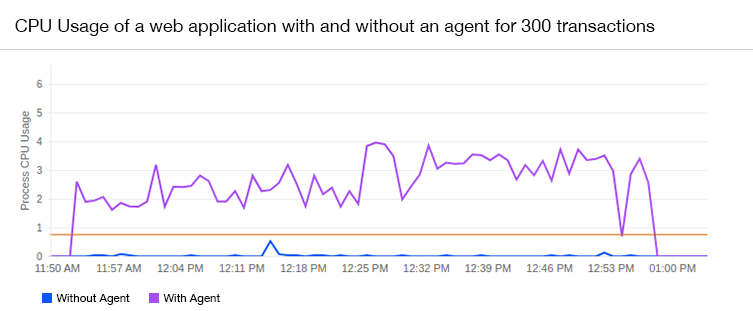
300 transactions per minute:
| CPU usage | Without agent | With agent |
|---|---|---|
| Average usage (%) | 0.53 | 2.3 |
When the application was running at 300 transactions per minute, the agent consumed an average of 1.8% of total CPU usage. The timeline chart below explains the historical trend:
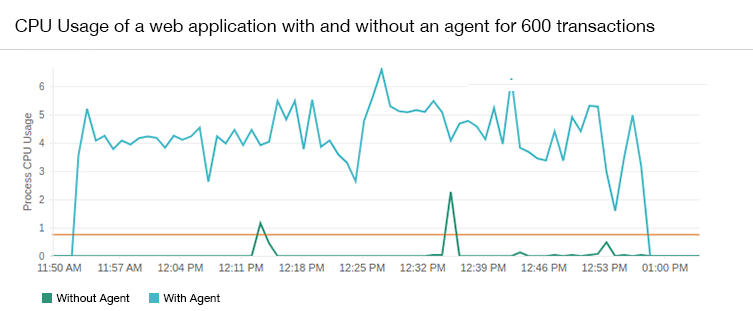
600 transactions per minute:
| CPU usage | Without agent | With agent |
|---|---|---|
| Average usage (%) | 1.16 | 3.92 |
When the application was running at 600 transactions per minute, the agent consumed an average of 2.76% of total CPU usage. The timeline chart below explains the historical trend:
Impact on memory consumption
The APM Insight Node.js agent, by default, gathers performance data and transmits it to its dedicated service every minute, ensuring minimal and transient impact on user memory. It's crucial to understand that memory usage is directly linked to the volume of data collected within a minute. Consequently, reducing the sampling factor or transaction trace threshold leads to higher RAM utilization.
The data shown below is a compilation of data from applications that ran parallel with and without the agent.
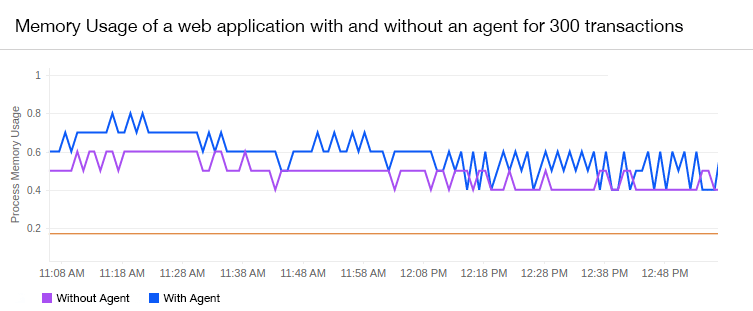
300 transactions per minute:
| CPU usage | Without agent | With agent |
|---|---|---|
| Average usage (%) | 0.4 | 0.5 |
When the application was running at 300 transactions per minute, the agent consumed an average of 0.1% of total memory usage. The timeline chart below explains the historical trend:
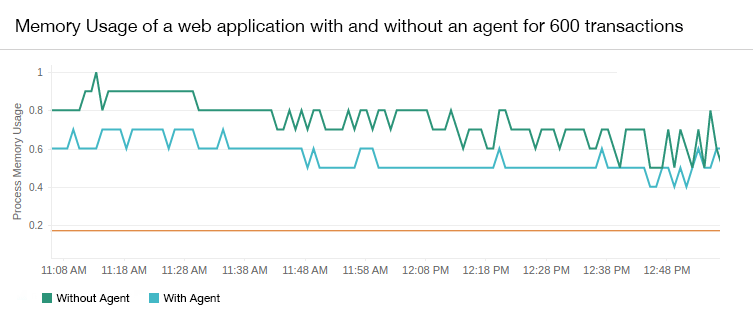
600 transactions per minute:
| CPU usage | Without agent | With agent |
|---|---|---|
| Average usage (%) | 0.6 | 0.8 |
When the application was running at 600 transactions per minute, the agent consumed an average of 0.2% of total memory usage. The timeline chart below explains the historical trend:
Network bandwidth usage
The communication between the APM Insight agent and Applications Manager servers is one-way HTTPS. The agent sends performance metrics to the Applications Manager's server every minute.
The agent will send two requests per minute to Applications Manager servers.
- /arh/data — Carries metric data from all transactions performed on the server, with a maximum size of 100KB.
- /arh/trace — Carries traces of all transactions that consumed more response time than the configured threshold level. A complete snapshot of the transactions will be sent. This can help with debugging. The maximum data size sent is around 4MB.
