EventLog Analyzer helps you collect and analyze logs from different sources such as servers, network devices, and applications. The solution provides actionable intelligence that helps security teams stay on top of security threats in the organization.
This solution provides you the capability to import log files. The supported log formats include Windows and syslog device formats, application log formats and archived files log formats.
Windows and syslog device log formats
Windows Eventlog (EVTX format)
IBM AS/400
Linux/Unix Syslog format (RFC 5424 and 2131)
Note: To import .evt logs (Windows XP and Windows 2003), you will need to convert the .evt to .evtx using the command wevtutil export-log application.evt application.evtx /lf in your EventLog Analyzer installation.
With this option, you can import log files from any device that has access to EventLog Analyzer.
Note: Log import cannot be scheduled to run at regular time intervals.
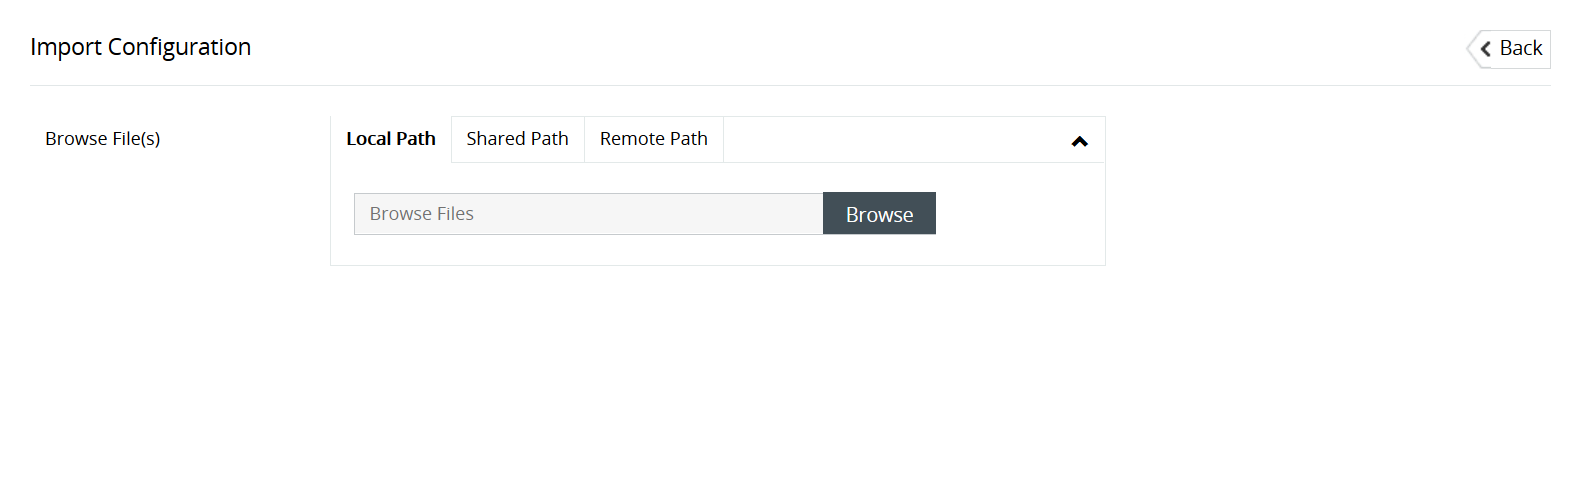
From the File Location option, select Local Path.
Click on Browse to select the necessary file(s) from your local device. Alternatively, you can enter the device name (or) IP address of the device (or) specify the full UNC path, then click on Open. The necessary file(s) is selected.
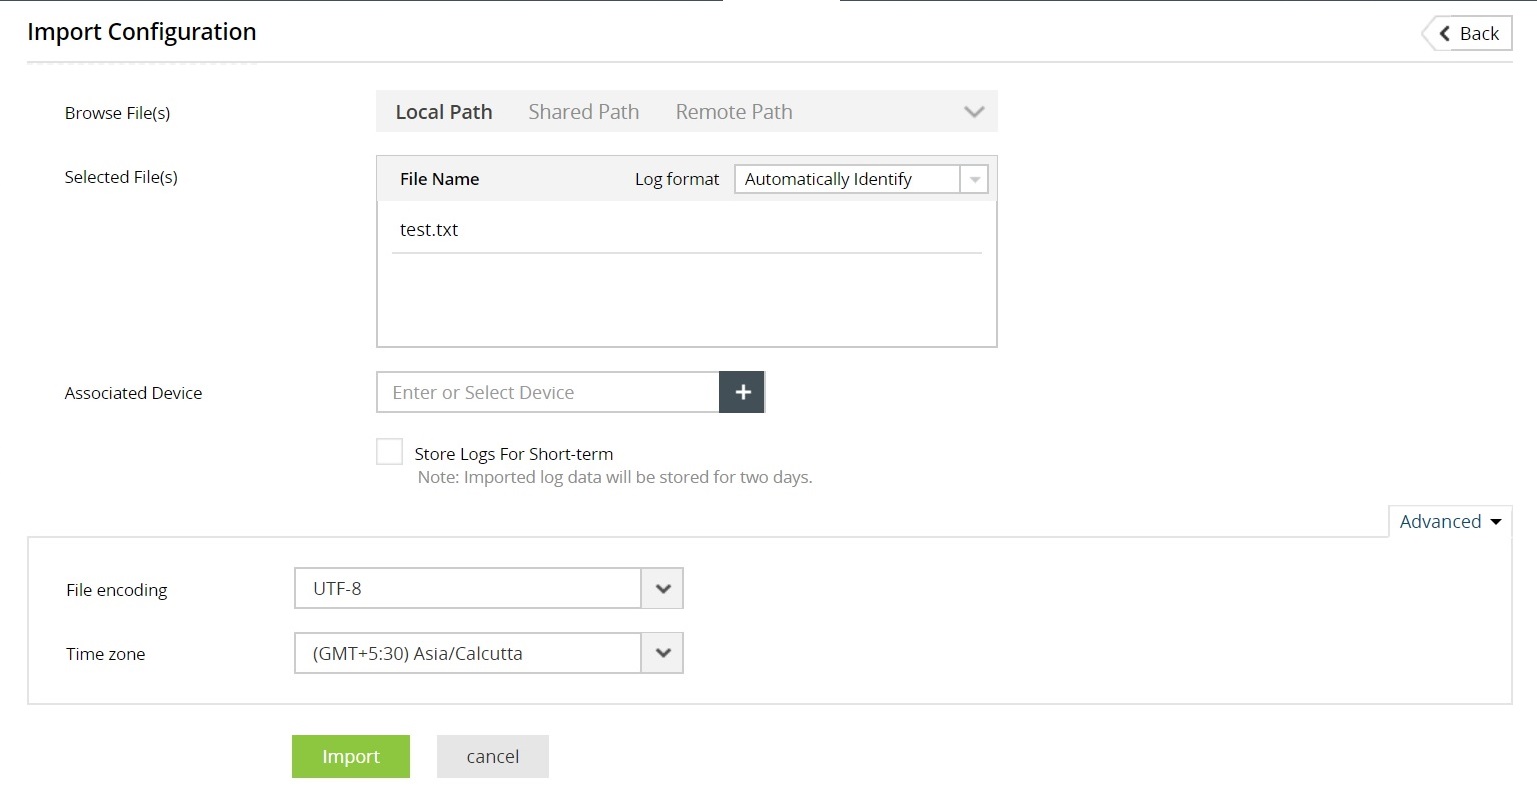
If you know the log format of the log file, select the log format from the given drop-down. If you do not know the log format select Automatically Identify.
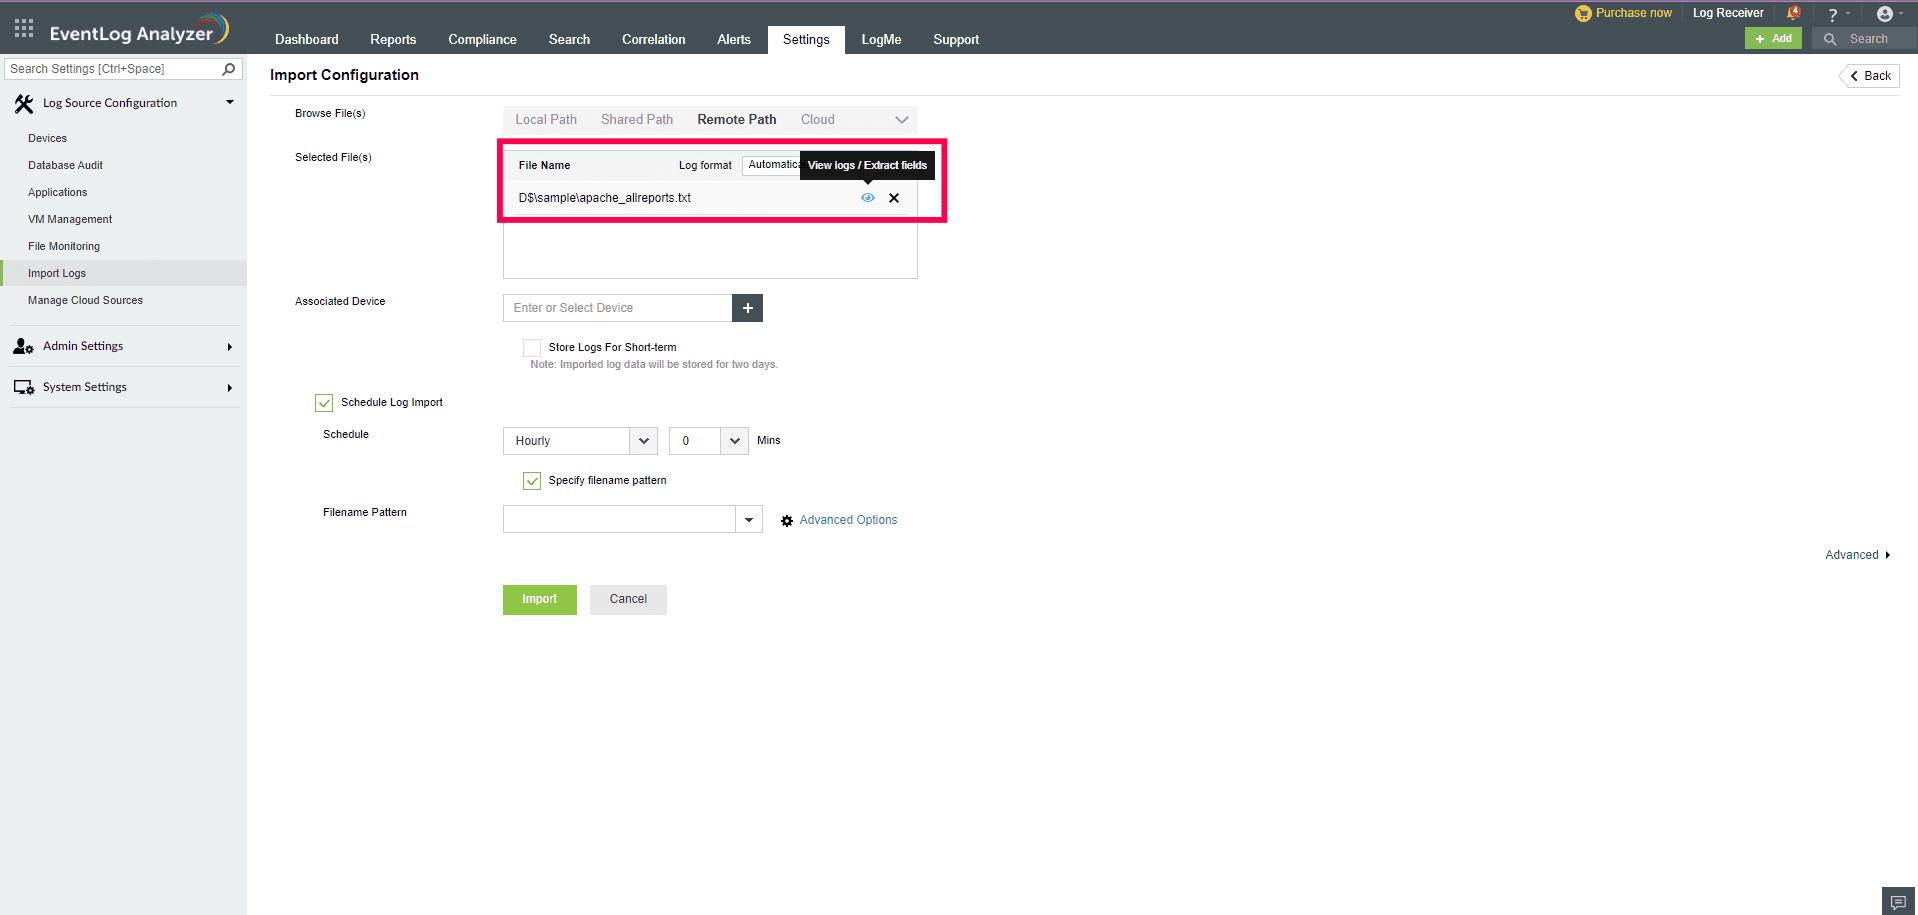
Note: You can view a preview of the selected log file and extract the desired fields, by clicking on the View symbol of the attached log file and enabling the pop-up window option in your browser.
Click on the + button and OK to select the device that the log file is associated to. You can also enter the name of the device or select the device from the pop-up that appears.
If you wish to store the imported logs for 2 days, enable the Store logs for a short term option. By default, the log storage time-period is 32 days.
Click on Import.
Log file import from a shared path or UNC path
The log file import via Universal Naming Convention (UNC) path allows you to access shared network folders on a local area network (LAN).
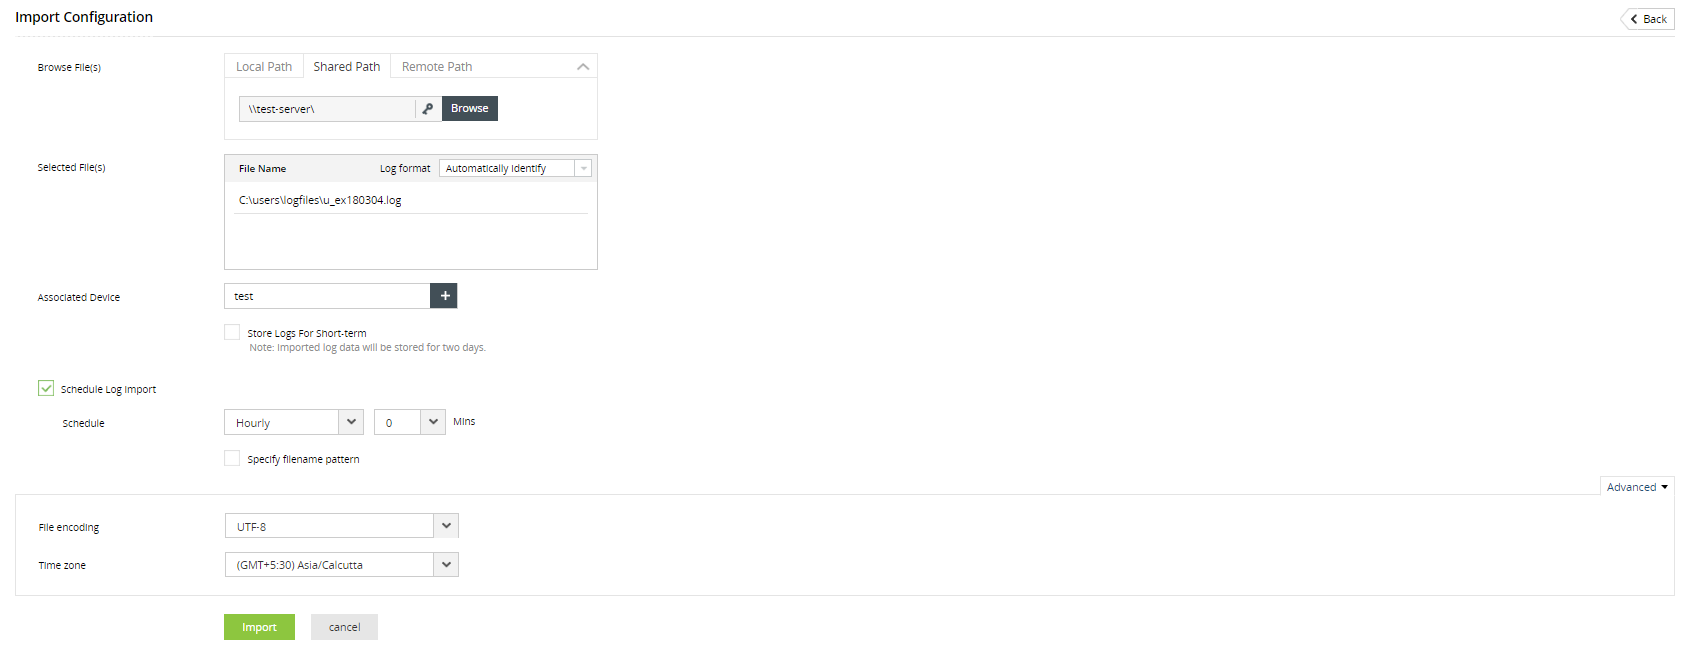
From the File Location option, select Shared Path.
Enter the device name or IP address from which you wish to upload the log file. Alternatively, you can click on Browse to select the Windows device.
Select the desired file from the device and click OK. The necessary file is selected.
If you know the log format of the log file, select the log format from the given drop-down. If you do not know the log format select Automatically Identify.
Note: You can view a preview of the selected log file and extract the desired fields, by clicking on the View symbol of the attached log file and enabling the pop-up window option in your browser.
Click on the + button and OK to select the device that the log file is associated to. You can also enter the name of the device or select the device from the pop-up that appears.
If you wish to store the imported logs for 2 days, enable the Store logs for a short term option. By default, the log storage time-period is 32 days.
If you want to automate a log file import at regular time intervals, enable the Schedule log import option.
With the Schedule drop-down menu you can customize the time interval between each log file import.
Additionally, you can build a file name pattern for the imported log files, using the time format options given. The name of the file stored at the specified time is updated in accordance to the file name pattern.
Click on Import.
Log file import from a remote path
Importing log files from a remote path in EventLog Analyzer needs authentication. This authentication can be achieved in two ways:
Username and password
SSH private key file sharing (Specific to SFTP protocol)
Authentication type: Password
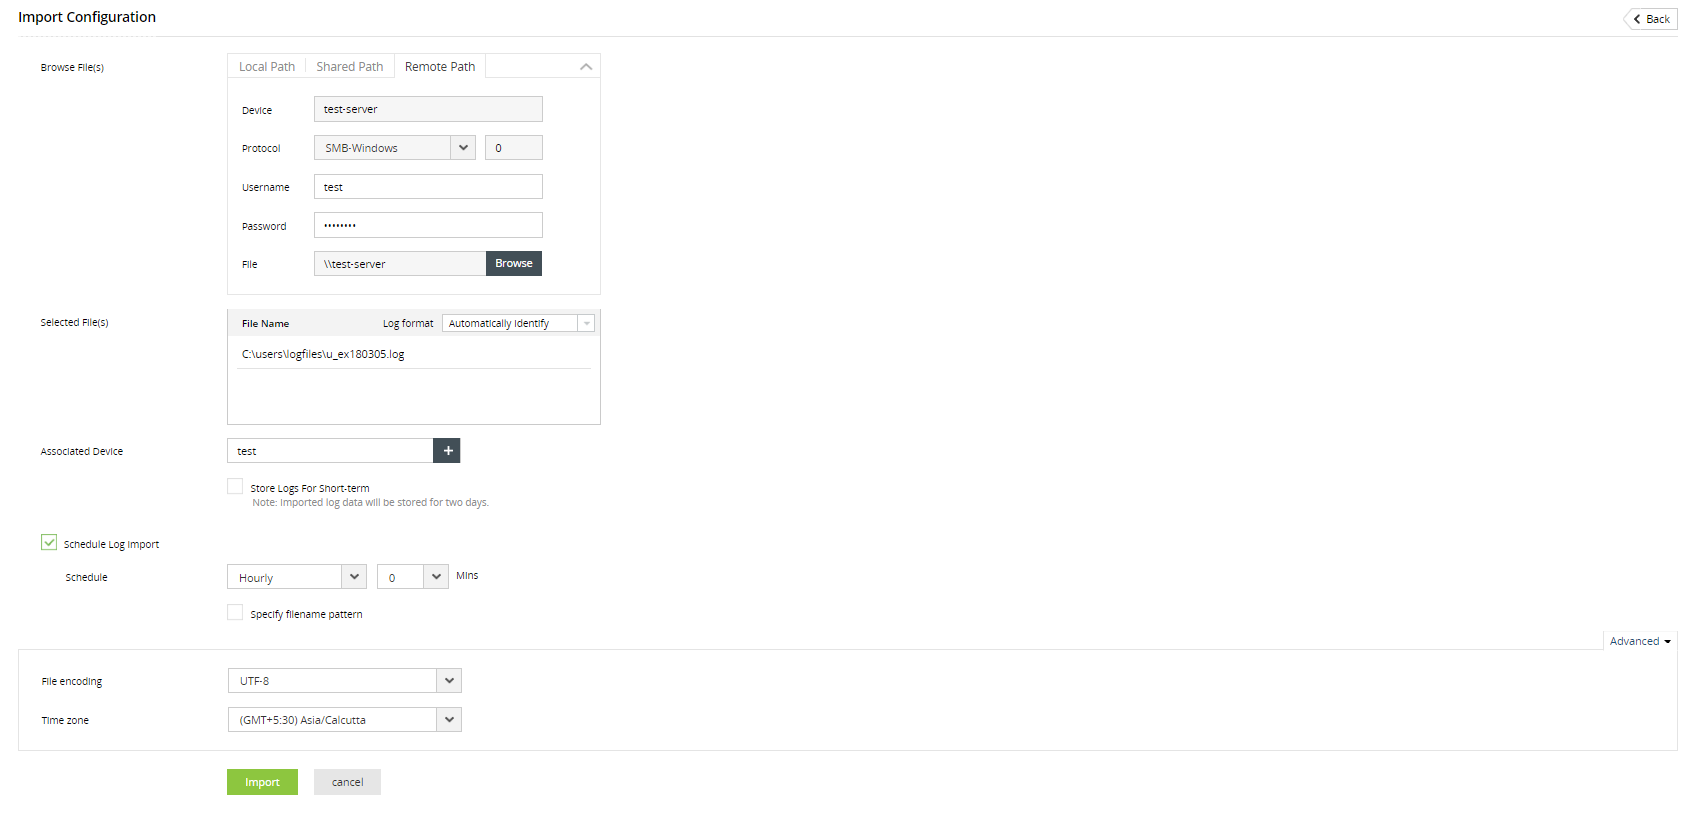
From the Browse Files option, select Remote Path.
Enter the device name from which you wish to import the log file. Alternatively, you can click on the + icon to browse and select the Windows device.
Choose the required protocol (Ethernet, FTP and SFTP) and enter the port number.
Select the desired file from the device and click OK.
Provide the Username of the remote device and select Authentication Type as Password.
Enter the password in the field below.
Browse and select the Associated Device.
The Store Logs for Short-term option will store the imported log data in EventLog Analyzer for a brief period of two days. If the option is left unchecked, the logs will be stored as per your database retention configuration.
You can choose to schedule the log import at specific time intervals.
Select Remote Path from the Browse Files options listed.
Enter the device name from which you wish to import the log file. Alternatively, you can click on the + icon to browse and select the Windows device.
Choose SFTP as the protocol and enter the port number. (Default port value is 22)
Provide the username and choose Key File as the Authentication Type.
Note: EventLog Analyzer supports OpenSSH key file format only.
Browse and select the key file from the device. You can refer to this link to learn how to generate a key file with ssh-keygen, a standard component of Secure Shell protocol.
If the key file is passphrase protected, select the Use Passphrase checkbox and enter the phrase in the field below.
Browse and select the Associated Device.
The Store Logs for Short-term option will store the imported log data in EventLog Analyzer for a brief period of two days. If the option is left unchecked, the logs will be stored as per your database retention configuration.
If you would like to automate a log file import at regular time intervals, enable the Schedule Log Import option.
With the Schedule drop-down menu, you can customize the time interval between each log file import.
Additionally, you can build a Filename Pattern for the imported log files using the time format options given. The name of the file stored at the specified time will be updated in accordance to the file name pattern.
Click on Import to save the configuration.
Log file import from cloud storage
To import logs from AWS S3 buckets, you first need to create an IAM user with access to the S3 bucket(s). You can also grant users access to only specific S3 buckets by following the steps given in this link.
To configure AWS S3 buckets for importing logs,
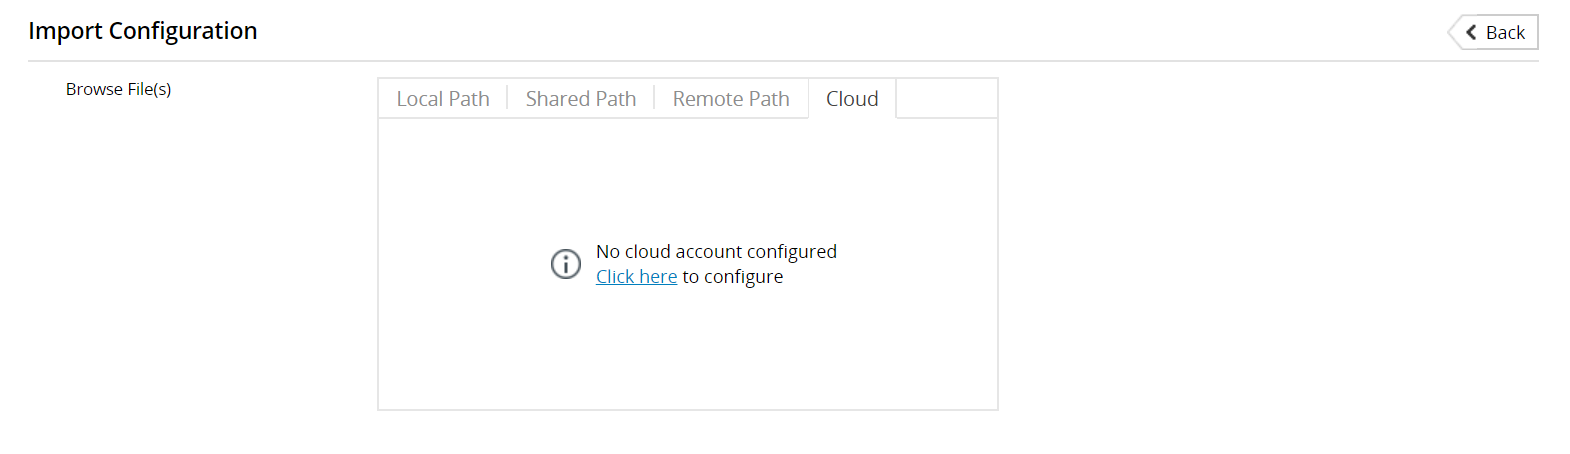
In the Cloud tab, click the link displayed to configure the AWS account.
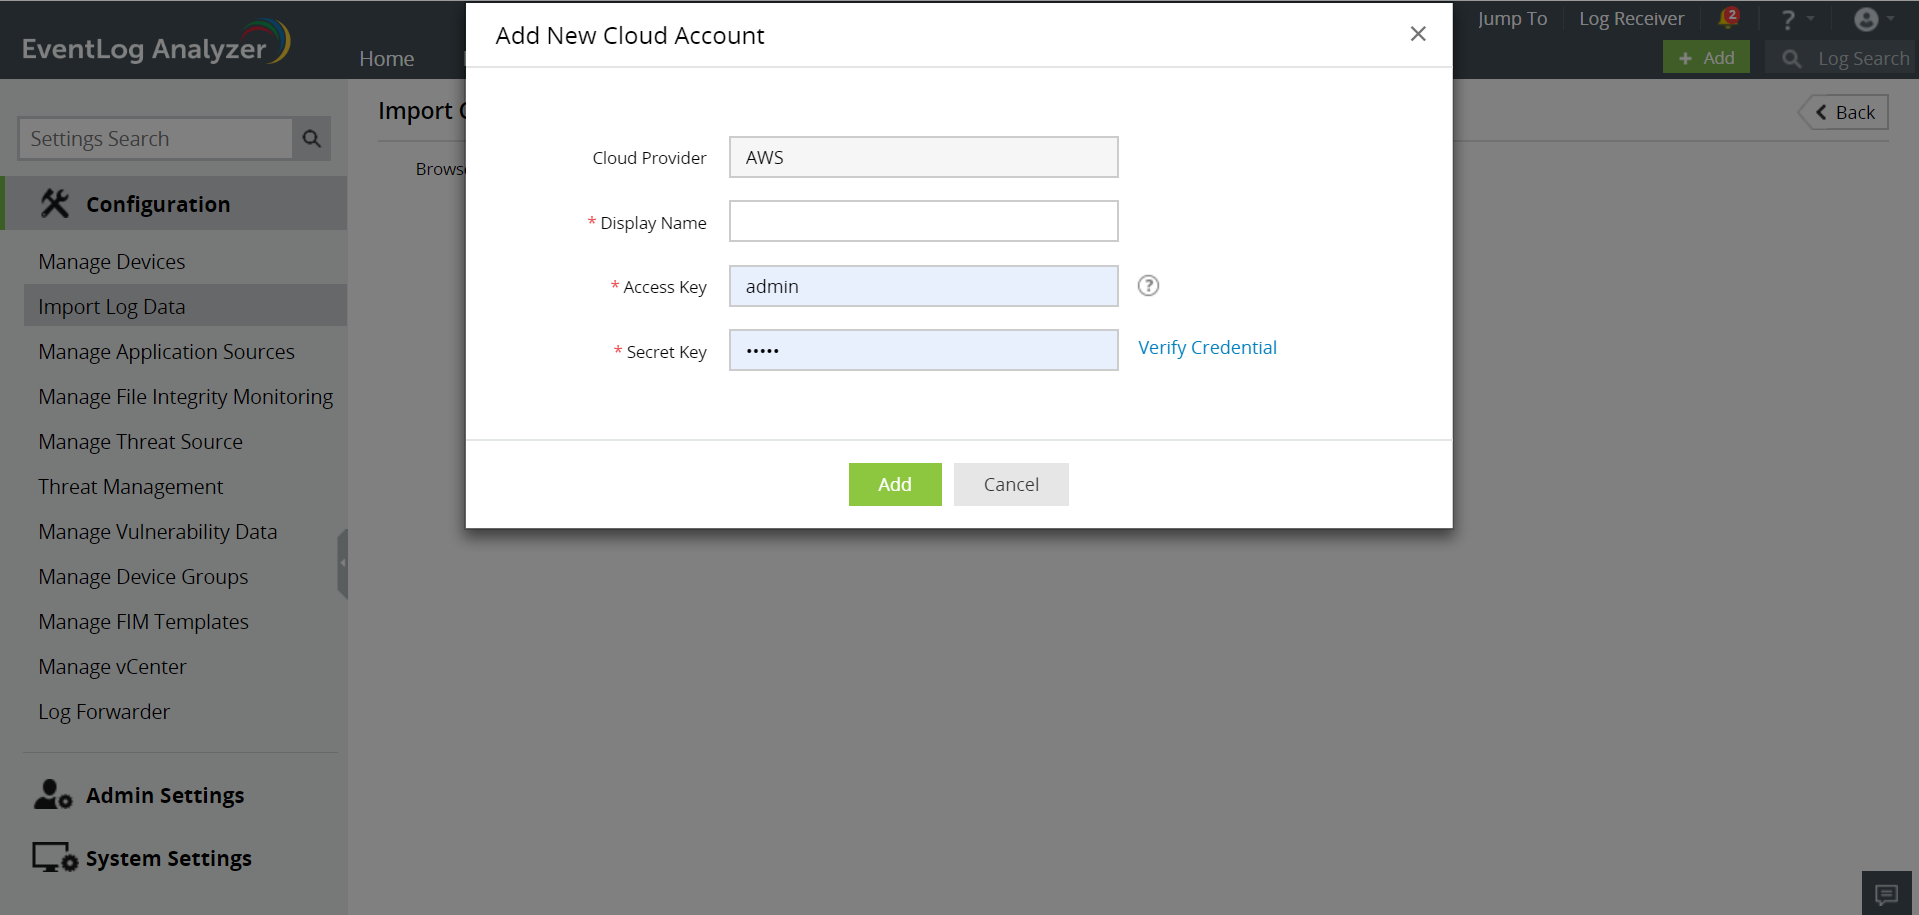
Enter the Display Name, Access Key, and Secret Key of the AWS account and click Add.
Once the AWS account gets added, it will be displayed in the drop-down list available in the Cloud tab.
From the drop-down list, select the AWS account and then the S3 bucket from which logs are to be imported.
Click Import to initiate log importing.
Steps to create specific naming conventions for files
Identify the log writing pattern from your application's log folder or from your application's configurations.
In Eventlog Analyzer, navigate to Settings → Import Logs → + Import logs → Remote Path and fill in the required details.
Browse the files and select the log file for which the log collection schedule has to be configured.
The selected log file's naming should follow a pattern (date, time, or any pattern according to your needs) which will be replicated in the subsequent files created by the product.
After selecting the log file, check the Schedule log import box and as well as the Specify filename pattern.
Click Advanced Options. There will be a text box for every file which has been selected for the scheduled pattern import respectively.
In the text box, input the filename pattern such that it matches the file name.
For example, consider an application which writes logs on a date-based schedule. Lets take the file name generated on Nov 22, 2023, as LOG_22_11_2023. Here the first part, "LOG_", will remain constant, and the latter part, i.e. the date "22_11_2023" changes daily. Keeping this in mind, select the pattern as "LOG_${DD}_${MM}_${YYYY}" from the drop down menus.
The drop down menu will provide multiple options to choose from as shown in the GIF below.
MySQL Logs
EventLog Analyzer supports only error logs and general logs from MySQL. MySQL logon failures are taken into account from MySQL general query logs.
To enable logging in MySQL,
Open the my.cnf file (in case of Linux) or my.ini file (in case of Windows) and add the below entries to the file.
For error logs: log_error=<error-log-file-name>
For general logs:
>= v5.1.29: general_log_file=<general-log-file-name> general_log=1 (or) ON
< v5.1.29: log=<log-file-name>
Restart the MySQL instance for the changes to take effect.
To import MySQL log files, you need to manually choose the log format. Once you've selected the right file, select MySQL Logs from the Log Format drop-down list in the Selected File(s) section.
Click Import to initiate the log importing process.
PostgreSQL Logs
Log format of PostgreSQL logs is determined by log_line_prefix parameter, set in postgresql.conf file.
The default format of PostgreSQL logs is '%m [%p] ' which logs a time stamp and the process ID.
Copy to Clipboard
log_line_prefix = '%m [%p] '
This format is supported by default in EventLog Analyzer.
Importing additional fields in EventLog Analyzer
If the user wants to add additional fields, log_line_prefix parameter in the postgresql.conf file must be changed.
The log_line_prefix parameter must follow the format(key- value pair) given below in the postgresql.conf file.
Time stamp with milliseconds or time stamp without milliseconds
time_stamp
%m or %t
Process ID
process_id
%p
Application name
application_name
%a
Database name
database_name
%d
Remote host name or IP address, and remote port
connection_from_with_port
%r
Remote host name or IP address
connection_from
%h
Session ID
session_id
%c
Transaction ID
transaction_id
%x
User name
user_name
%u
Command tag: type of session's current command
command_tag
%i
SQLSTATE error code
sql_state_code
%e
Process start time stamp
session_start_time
%s
SAP ERP Audit Logs
To add the SAP ERP application for monitoring, the audit logs have to be enabled.
To enable the SAP ERP audit logs:
To the DEFAULT.PFL file in the location <SAP_installed path>\sys\profile, add
rsau/enable = 1
rsau/local/file = <log location>/audit_00
Note: The user should have permission to read this audit file while importing.
DHCP Logs
EventLog Analyzer can read and report on DHCP server software for Windows and Linux systems. It provides various reports that simplifies network administration.
For Windows:
Note: Once you share the DHCP log location in Windows (i.e. %windir%\System32\Dhcp), you can automatically use this UNC path to fetch and import logs to EventLog Analyzer on a daily basis.
To configure, follow these steps:
Share the DHCP log folder.
Open EventLog Analyzer and go to Settings > Import Log > + Import Log > Shared\Remote path > browse the file and select DHCP Windows Log from the Log Format.
To learn how to import log files from different locations, refer here.
For Linux:
The default DHCP log location in Linux is "var/log/syslog" OR "var/log/messages" (for older versions).
If DHCP server logs are not available on the above files, please follow below steps. To store the DHCP server logs alone in a separate file, an admin would have to make changes to the following configuration files:
/etc/dhcp/dhcpd.conf- DHCP Server configuration file
/etc/rsyslog.conf- rsyslog configuration file
Lookup the value of "log-facility" in the dhcpd.conf file.
Lookup the log file path corresponding to the log-facility identified in the previous step in the ryslog.conf file. That is the DHCP server log file path.
To configure DHCP in EventLog Analyzer, follow these steps:
Share the DHCP log folder.
Open EventLog Analyzer and go to 'Settings' tab > Import Log > Shared\Remote path > browse the file.
To learn how to import log files from different locations, refer here.
DB2 Audit Logs
Db2 database systems allow auditing at both the instance and database levels. The db2audit tool is used to configure the auditing process. The tool can also be used to archive and extract audit logs, from both instance and database levels. The audit facility can be configured by following these six steps.
Configuring db2audit data path, archive path, and scope.
Creating an audit policy for database auditing.
Assigning the audit policy to the database.
Archiving the active logs.
Extracting the archived logs.
Importing the logs to EventLog Analyzer.
EventLog Analyzer also supports diagnostic logs. Click here to learn how to generate the diagnostic logs report.
1. Configuring db2audit data path, archive path, and scope
The configure parameter modifies the db2audit.cfg configuration file in the instance's security subdirectory. All updates to this file will occur even when the instance is stopped. Updates occurring when the instance is active will dynamically affect the auditing being done by the Db2 instance. To know more on all possible actions on the configuration file, refer source
Open DB2 Command Line Processor with administrator privilege.
Note: Replace policy_name with the policy name of your choice. Replace the given parameters with the command parameters of your choice. To know more on the allowed command parameters, refer source.
Run the following command to commit:
Copy to Clipboard
db2 commit
Now the audit policy has been created.
3. Assigning the audit policy to the database
Open DB2 Command Line Processor with administrator privilege.
Run the following command to assign a policy to the database:
Copy to Clipboard
db2 audit database using policypolicy_name
Note: Replace policy_name with the name of the audit policy that you created.
Run the following command to commit:
Copy to Clipboard
db2 commit
Now the created audit policy is assigned to the database.
4. Archiving the active logs
You can archive the active logs from both instance and database. The logs will be archived to the archive path that you configured in the first step.
Open DB2 Command Line Processor with administrator privilege.
Run the following command to archive the active database logs:
Copy to Clipboard
db2audit archive databaseyour_database
Note: Replace your_database with the name of the database.
Run the following command to archive active instance logs:
Copy to Clipboard
db2audit archive
Now the logs will be archived to a new file with a timestamp appended to the filename. An example of the filename is given below.
Note: Replace the instancelog with the filename of your choice. Replace db2audit.instance.log.0.20060418235612 with the filename of the archived instance logs.
Run the following command to extract archived database logs:
Note: Replace databaselog with the filename of your choice. Replace db2audit.db.your_database.log.0.20060418235612 with the filename of the archived database logs.
Both files will be extracted to the given archive path and can be imported into EventLog Analyzer.
6. Importing the logs to EventLog Analyzer
Now you will have to import the extracted database and instance log files into EventLog Analyzer. Here is a comprehensive guide on how to import log files in EventLog Analyzer.
Diagnostic Logs
EventLog Analyzer also provides a report for diagnostic logs. To generate the diagnostic logs report, follow the given steps.
Run the following command to find the location of the diagnostic log file.
Copy to Clipboard
db2 get dbm cfg | findstr DIAGPATH
or
Copy to Clipboard
db2 get dbm cfg | grep DIAGPATH
or
Copy to Clipboard
db2 get dbm cfg
Note: The path corresponding to Current member resolved DIAGPATH is the path to the diagnostic log file.
If you are unable to import a log file, ensure the following:
The credentials used are valid and have the necessary permissions.
The device is reachable.
The specified file exists and is accessible.
The log file format selected from the drop-down matches the log format of the chosen file.
Field extraction from logs
Navigate to the Import Configuration page.
Select the desired file(s) from a local, shared or remote path.
Under Selected files, click on the eye beside the required file.
You can create a custom field by clicking on the tools icon at the top-right corner of your log message. Follow the steps given in this page to use custom patterns for logs.
You can see the created custom fields on the left pane.
Finally, click Save.
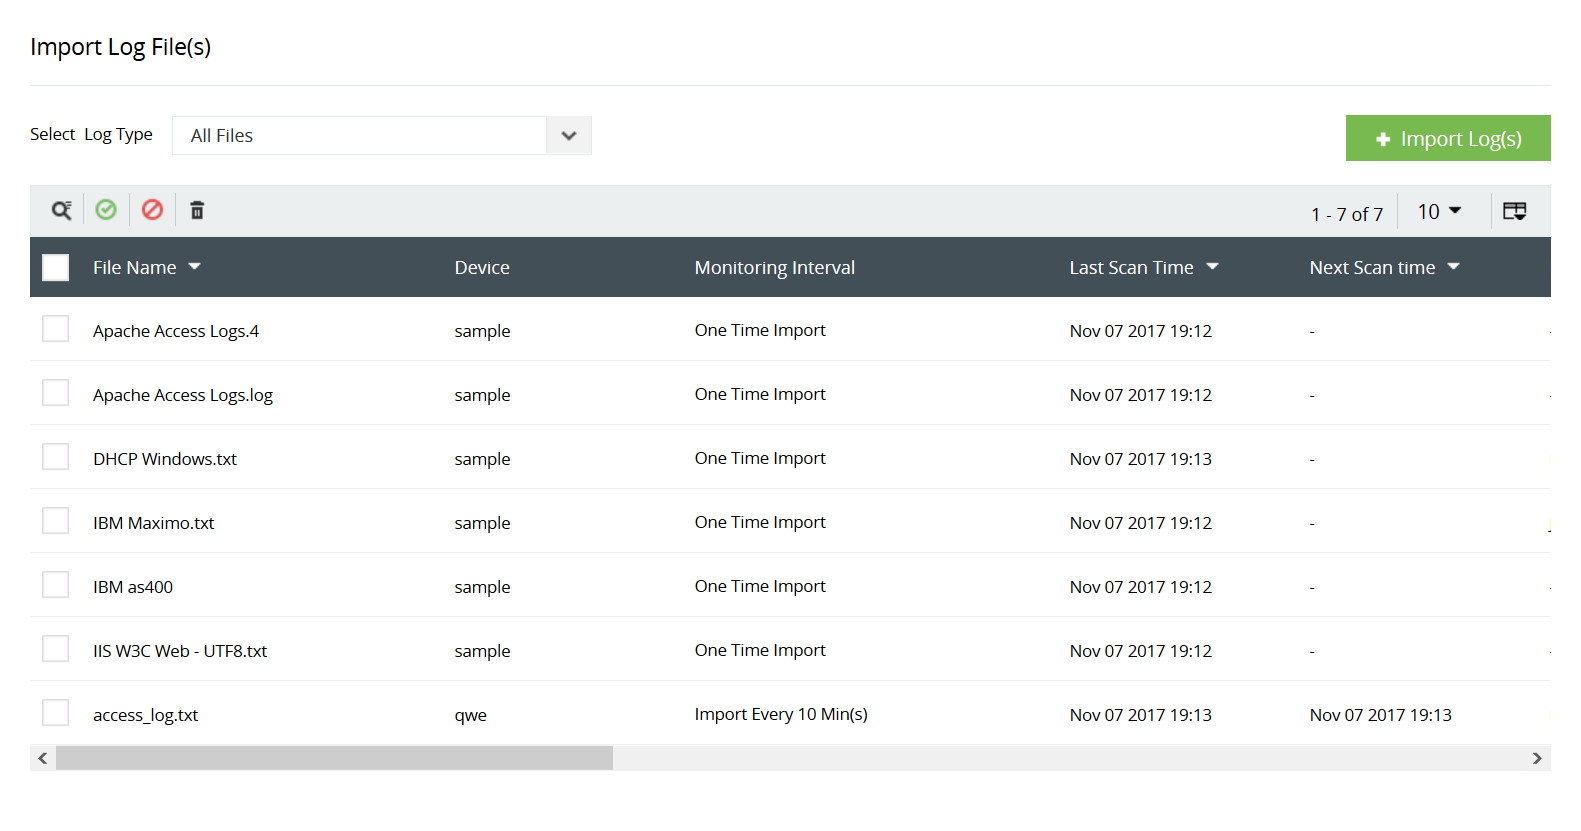
List of imported log files
You can view a list of all imported log files in your EventLog Analyzer installation. This is the default page that appears when the import log option is selected. This page provides details of the imported log file including, filename, device, monitoring interval, time taken to import the log file, log format, and size of the log file.
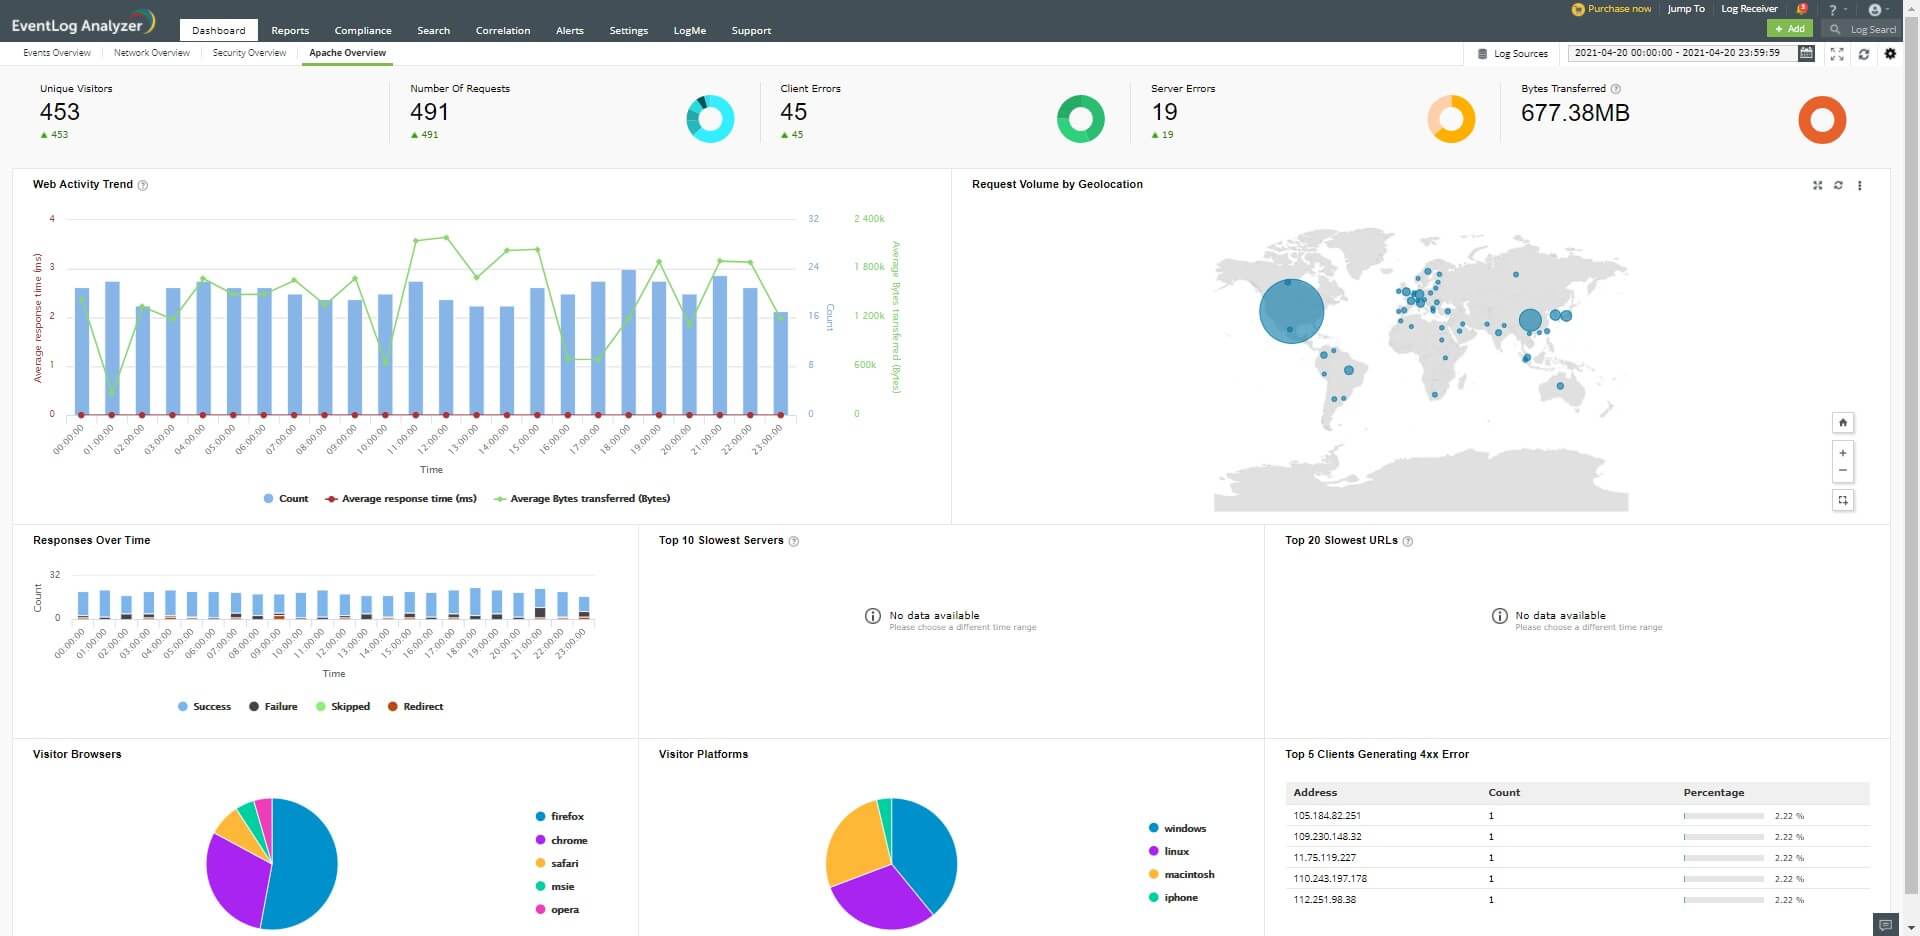
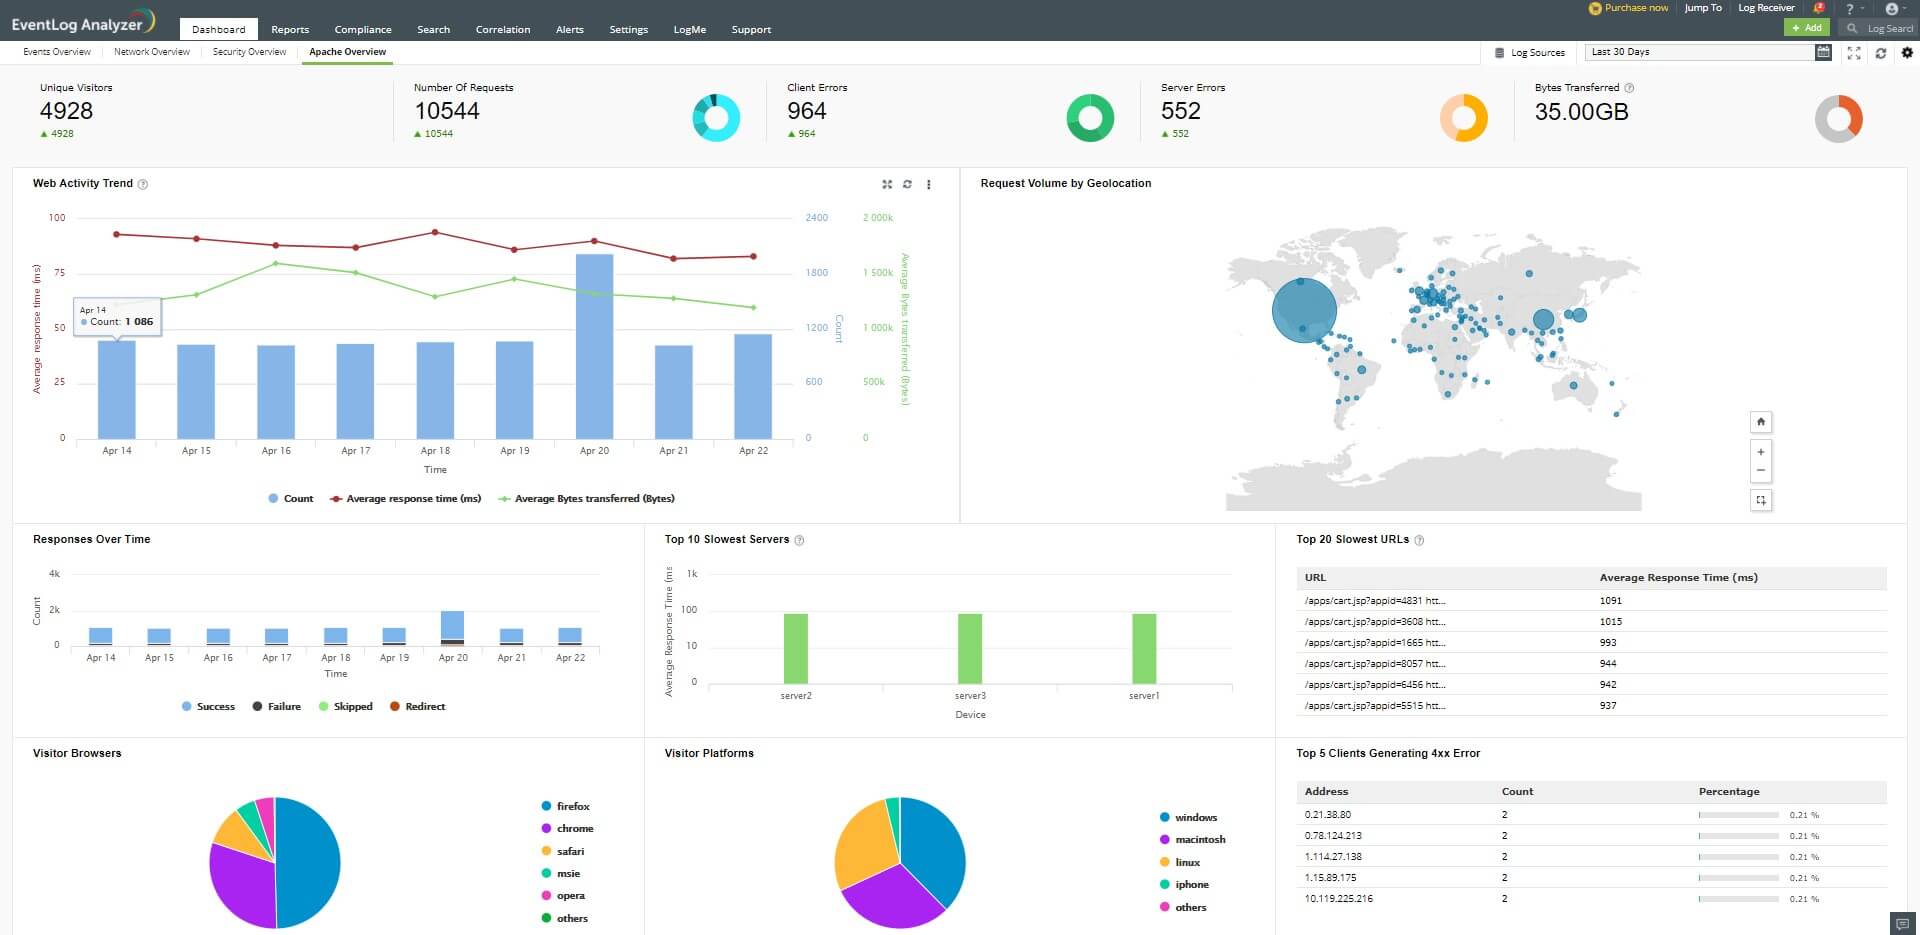
Apache Overview Dashboard: Parsing Additional fields by modifying the log format
The Combined Log Format is one of the log formats commonly used with Apache logs.
While importing the log files in the Combined log format, the log files will not include the values for the fields response time and bytes received.
The following widgets in the Apache Overview dashboard can display their values accurately only if the response time and bytes received fields are parsed.
Bytes Transferred
Top 20 Slowest URLs
Web Activity Trend
Top 10 Slowest Servers
In order to parse these additional fields, the log format has to be modified. The values for the additional fields can be obtained once the logs are configured with the parameters "%{ms}T" and "%I".
Eventlog Analyzer can parse the modified log format by default.
The modified log format containing the parameters for response time and bytes received is:
The modified log has 2 directives in addition to the commonly used Combined Log Format. These directives are present at the end of the format, therefore, the combined log format will continue to be parsed as it was parsed in the previous versions.
Procedure to change the Apache log format
Note: The configuration files by default are located at /etc/apache2/ in Debian/Ubuntu/Linux Mint or, /etc/httpd/conf on Red Hat/Fedora/CentOS
 Click here to expand