Summary
Database bottlenecks are among the trickiest causes of database performance degradation, because the problem starts at the database, yet the alerts show up everywhere simultaneously—the app tier, the middleware, and the server. Without the right tools, alert fatigue sets in, and your team ends up chasing symptoms rather than the source.
OpManager Nexus causal AI groups all those related alerts into a single problem, identifies the database event that triggered the cascade as the probable root cause, and filters out everything that is not connected. Your team gets straight to the fix instead of spending time figuring out where to start.
Application latency is one of the hardest performance problems to diagnose in a production environment. When response times degrade, your monitoring stack typically fires alerts across the application tier, the database, the server, and the network all at once. The challenge is not a lack of data; it's figuring out which signal caused everything else. This is where alert fatigue becomes a real operational risk: too many alerts, too little context, and no clear starting point.
What is causal AI?
Causal AI is a type of AI-powered root cause analysis that goes beyond spotting patterns. It figures out why something happened, not just that it happened. Instead of showing you a list of alerts that fired around the same time, it traces the chain of events back to the probable root cause. Think of it as the difference between a smoke detector that tells you there is smoke everywhere and an investigator who tells you exactly which wire sparked the fire.
Traditional event correlation groups alerts that occur together but can’t determine causation. Causal AI goes further by identifying the direction of impact—showing that a database timeout triggered an application error, not just that they’re related. This is critical in latency issues, where a slow query causes a chain reaction: driver timeouts, transaction errors, and response delays. Causal AI connects this cascade and pinpoints the source.
OpManager Nexus causal AI quickly identifies database-driven application latency by correlating incidents, grouping all related alerts into a single problem, filtering out noise with no causal connection, and identifying the database event that triggered the cascade as the probable root cause. This article walks through how that plays out when the latency is caused by a database bottleneck.
Use case: Database bottleneck triggering application latency
A financial services company runs a Java-based transaction processing application backed by a Cassandra cluster. During a routine deployment, Cassandra query times spike dramatically, triggering driver timeout exceptions within seconds. Transaction errors surge and response times deteriorate rapidly, leading users to report slow checkout flows across the application.
What OpManager Nexus observes across the stack
| Time (minutes) | Source | Event | Classification |
|---|---|---|---|
| 00:00 | APM component: Cassandra | Query execution time: 1,601ms to 30,105ms | Probable root cause |
| 00:42 | APM monitor | Driver timeout exception raised | Probable root cause |
| 01:15 | APM monitor | Transaction exceptions: 40 to 180 | Contributing factor |
| 01:48 | APM monitor | Response time: 615ms to 2,573ms | Contributing factor |
| 01:55 | Server monitor | CPU spike | Filtered out as this server is not associated with this application |
What causal AI uncovers automatically
OpManager Nexus AI-powered event correlation engine groups the first four events into a single problem. The CPU spike is excluded because the server monitor has no dependency on the affected application stack—it falls outside the Smart Group's scope of correlation, so your team never sees it mixed in with the actual problem.
On the Root Cause Analysis tab, the SQL execution time spike and the SQL timeout exception are identified as the probable root causes. Causal AI pinpoints the root cause and gives your team the precise context needed to act.
Outcome
The team uses the Root Cause Analysis tab to identify a query plan change that removed a critical Cassandra index, with Trace Analysis revealing the exact query, execution time, and wait points—no extra log analysis needed. After rolling back the change and restoring the index, the team confirms resolution via the Event Analysis tab as alerts clear and stability returns.
Impact: Without causal AI, teams spend 60–90 minutes manually correlating alerts. With Causal AI, the root cause is identified within minutes, reducing the mean time to repair (MTTR) from hours to minutes.
How OpManager Nexus works through the problem
The pipeline that takes you from raw alerts to a resolved problem runs through four stages.
Stage 1: OpManager Nexus starts by using Smart Groups to organize your monitors by their actual dependency relationships—application topology, application discovery and dependency mapping (ADDM) data, network connections, and server-to-application communication. This is what makes it possible to evaluate alerts together rather than in isolation.
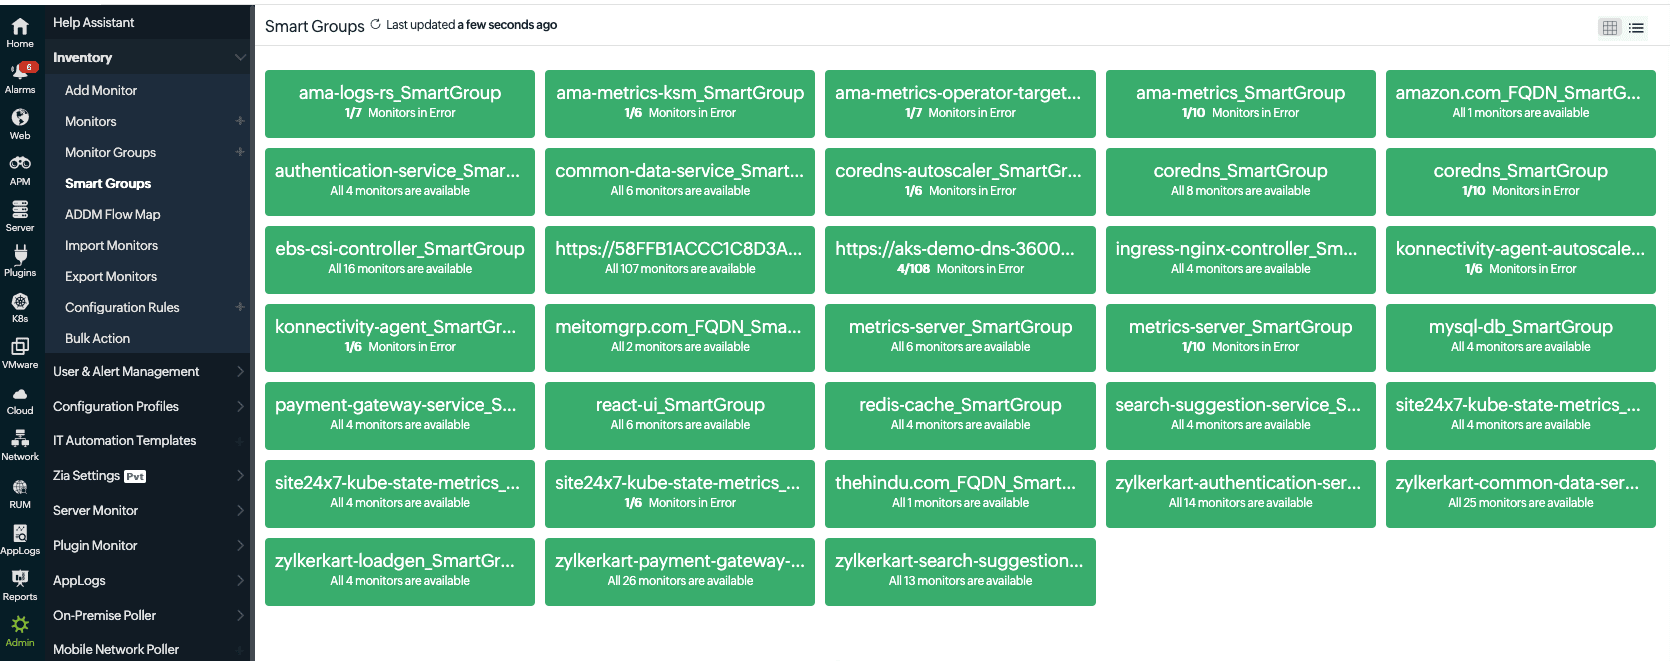 Figure 1. Smart Groups view showing interconnected pods, applications, servers, and databases in a single unified context
Stage 2: Within the correlation time window, all events from monitors in the relevant Smart Group are collected and evaluated together. Domain-aware correlation connects events using knowledge of your specific environment, like linking a database SQL timeout to an application slowdown while filtering out unrelated ones, such as a CPU spike on an unrelated server.
Stage 3: The correlated events are then surfaced as a single problem. To find it, navigate to Alarms and toggle to Problems. Each problem shows the Priority, Status, Smart Group, Start Time, Duration, and assigned Technician. Clicking it opens four tabs: Event Analysis, Root Cause Analysis, Summary, and Upstream/Downstream. The Root Cause Analysis tab lists the probable root causes in priority order, with Trace Analysis available for APM monitors. Once you assign a technician, the problem is acknowledged.
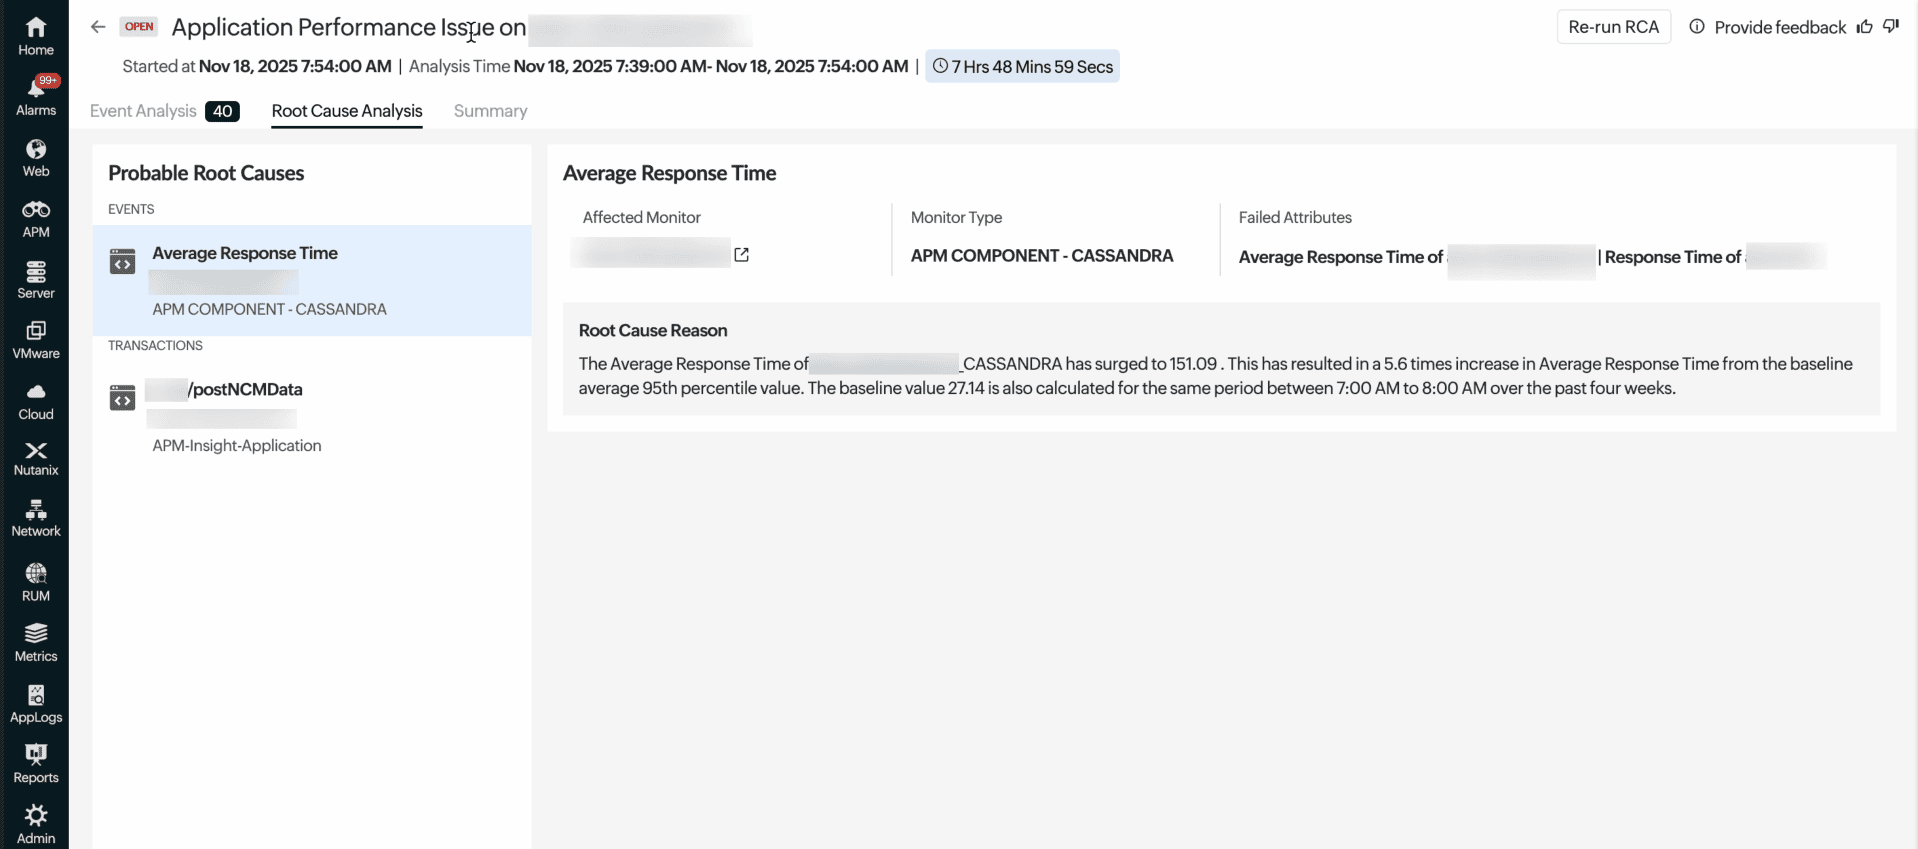 Figure 2. Root Cause Analysis tab showing SQL execution spike and timeout as the probable root cause
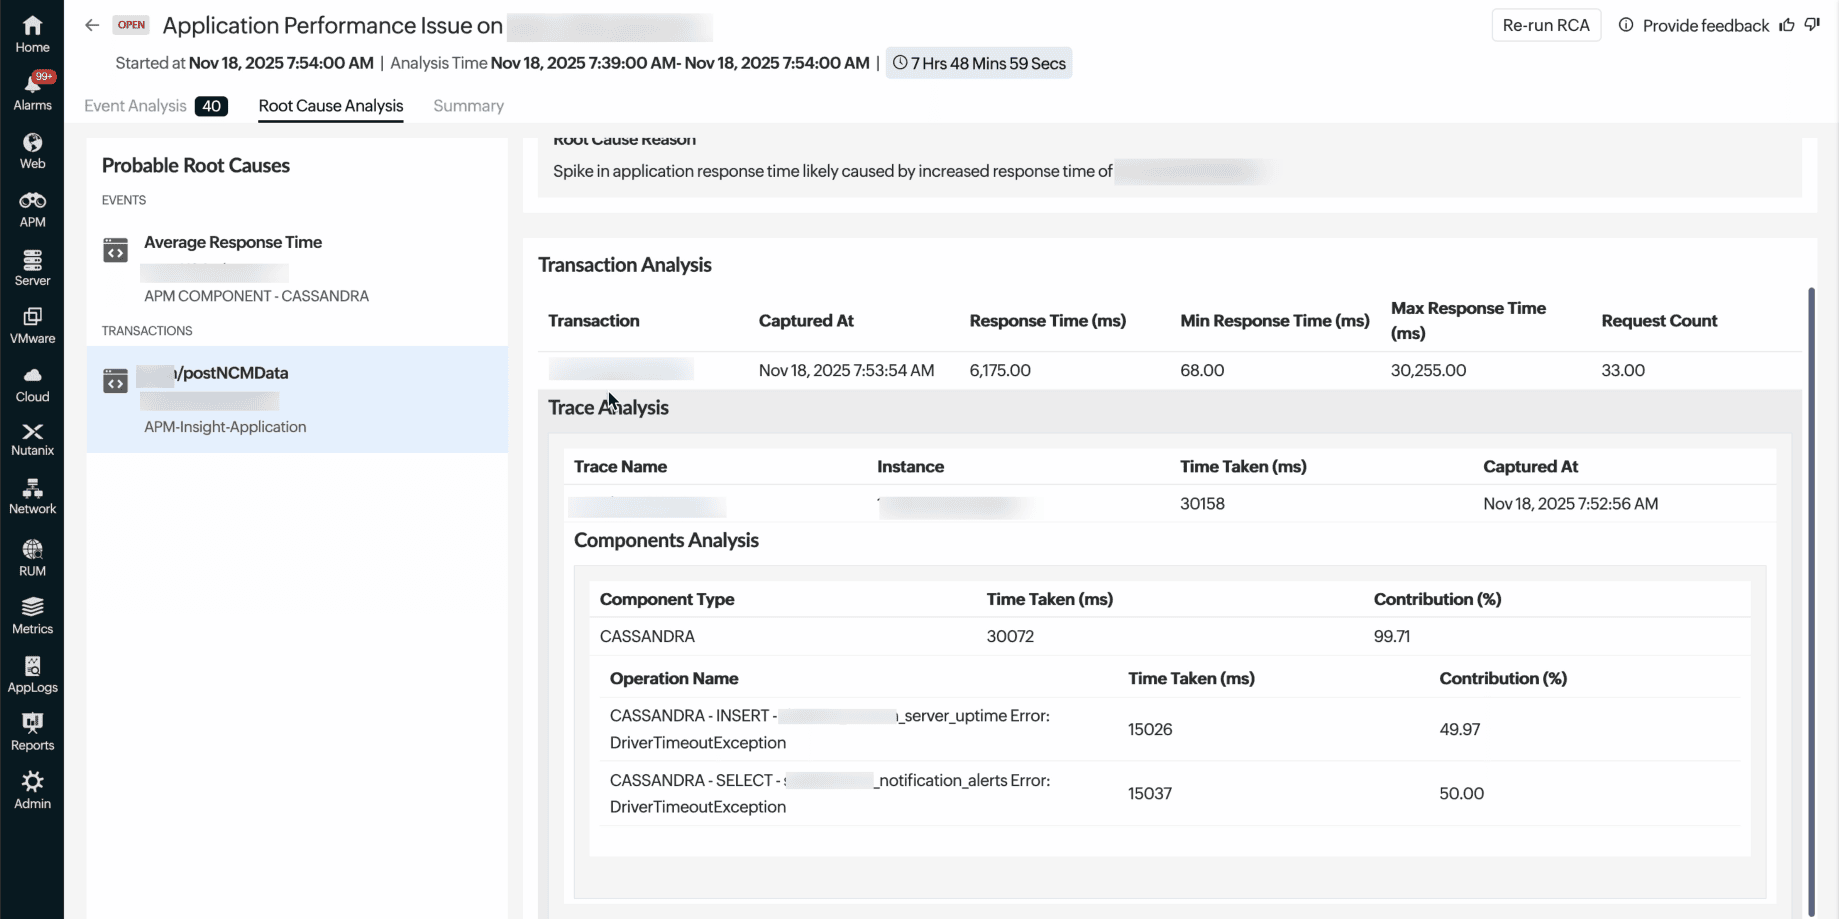 Figure 3. Trace Analysis reveals the exact query, execution time, and triggering method behind the issue
Getting started with causal AI
Setting up event correlation for database-driven latency requires three steps. Event correlation is enabled by default once your monitors are set up and reporting events; no toggling needed to activate it.
Step 1: Set up application monitoringInstall the Full-Stack Agent and the APM Insight agent to enable server and application monitoring.
Step 2: Analyze incidentsUse the Problems view to investigate events and identify the root cause quickly.
Fix database-driven latency faster with causal AI
Database performance degradation issues rarely announce themselves cleanly. They cascade across layers, generating alert storms that obscure the real problem. OpManager Nexus causal AI is purpose-built for these scenarios. Through AI-powered root cause analysis and incident correlation, it cuts through the noise, connects the right signals, and surfaces the probable root cause—often with Trace Analysis pinpointing the exact query or code path at fault. Your team starts the investigation in the right place, armed with the evidence they need. Causal AI identifies the cause; your team delivers the fix.
FAQ
What is domain-aware correlation?
Domain-aware correlation understands how components in your environment are actually connected, not just the timing of alerts. It uses dependency mapping (like APM Insight) to identify causal relationships, such as linking a Cassandra timeout to a Java exception. Unrelated events, like a CPU spike on an independent server, are excluded.
What databases does causal AI support for root cause analysis?
OpManager Nexus supports RCA for databases via APM Insight and standalone monitors, including Cassandra, MySQL, PostgreSQL, Microsoft SQL, Oracle, MongoDB, and Redis. It also supports cloud databases like Amazon RDS, Aurora, Azure SQL, and Google Cloud SQL. However, this automatic connection between a database issue and an application only works if both are added to the same Smart Group in OpManager Nexus.
What is the difference between event correlation and root cause analysis?
Event correlation is when several alerts are triggered at the same time and are linked to resources that depend on each other; OpManager Nexus clubs them together as one Problem, so you aren't flooded with individual alerts. Root cause analysis then identifies the triggering event within that group. In short, correlation answers what is happening, while RCA explains why it is happening and where it started.
Does causal AI work with cloud-hosted databases?
Yes, OpManager Nexus supports cloud databases like Amazon RDS, Aurora, Azure SQL, Cosmos DB, and Google Cloud SQL. Their alerts can be correlated with application events when part of the same Smart Group. For deep query-level insights, APM Insight agents provide trace-level visibility in RCA.