Summary
A Kubernetes deployment broke when a typo in a YAML file renamed a required environment variable, sending a pod into CrashLoopBackOff. Instead of three disconnected alerts reaching three different teams, Causal AI in OpManager Nexus groups them into one Problem, flags the YAML update as the probable root cause, and surfaces the exact config diff—so the team fixed the typo and confirms recovery without any cross-team triage or manual log hunting.
A routine Kubernetes deployment can break due to a small mistake—like a typo in an environment variable or a misconfigured secret. The container fails to start, and Kubernetes keeps restarting it. This quickly creates a flood of alerts, each looking like a separate issue.
Teams end up with too many alerts and no clear starting point. You know something’s broken—but not what caused it. That’s the gap Causal AI in OpManager Nexus fills: AI-powered root cause analysis that connects the deployment change to the pod crash automatically, without manual log hunting or cross-team triage.
Previously in this series: How Causal AI can resolve application latency caused by database bottlenecks
Why Kubernetes failures are hard to diagnose manually
A misconfiguration in a deployment YAML doesn't announce itself — and without faulty deployment detection, there's no automated way to tie a config change directly to the crash it caused. When a required environment variable is renamed or removed during an update, the container fails on startup, and Kubernetes, doing exactly what it's designed to do, keeps restarting it. What you see from the outside is a CrashLoopBackOff. What you don't immediately see is why.
As restarts accumulate, more alerts begin to fire. The pod monitor reports a crash. The deployment monitor flags unavailable replicas. If your observability stack includes Kubernetes change tracking, a YAML update event appears too—but in a separate part of your monitoring stack, disconnected from the pod alert. Each signal is valid on its own, but none of them automatically point to the same cause.
To connect these manually, you'd need to check pod logs, compare deployment revisions, identify what changed between the last stable version and the current one, and trace the config change back to the crash—across different monitoring layers, often across different teams. Instead of fixing the issue, teams spend valuable time figuring out where to start. Both mean time to discovery (MTTD) and mean time to repair (MTTR) grow with every minute spent on manual correlation, prolonging the impact on users.
Use case
A development team updates their Kubernetes deployment with a small configuration change. But during the update, they accidentally make a typo in the YAML file — the environment variable REQUIRED_VAR is wrongly written as REQUIRED_VA_BROKEN.
Since the application needs this environment variable to start, the container fails every time it tries to run. Kubernetes keeps restarting the pod, but it crashes again each time, eventually ending up in a CrashLoopBackOff state.
What the observability stack sees
Within minutes, multiple alerts fire across different layers, triggering automated incident correlation across pod, deployment, and configuration monitors simultaneously:
| Time | Monitor type | What it reports |
|---|---|---|
| Apr. 8, 2026, 3:12 pm | Kubernetes Pod monitor | Pod crash-08-apr-699467797b-v9jd2 in CrashLoopBackOff — BackOff restarting failed container alpine-checker |
| Apr. 8, 2026, 3:13 pm | Kubernetes Deployment monitor | Unavailable Replicas exceeds 0 count |
| Apr. 8, 2026, 3:13 pm | Kubernetes Deployment monitor | YAML Updated — Configuration YAML has been updated |
Without correlation, these alerts reach your team separately:
- The development team investigates the pod restart loop.
- The infrastructure team looks at replica availability.
- No one immediately connects the config change to the crash.
Time is spent across teams trying to piece together what changed and when.
OpManager Nexus uses Causal AI to automatically correlate these alerts and group them into a single problem. Instead of three disconnected alerts, your team sees one unified incident with the YAML update flagged as the probable root cause, meaning the platform understood the relationship between a deployment config change and a pod-level crash without any manual configuration.
What OpManager Nexus actually shows you
Let’s see how OpManager Nexus makes this easier:
Event Analysis
The Event Analysis tab surfaces pod restart monitoring data and pod logs inline alongside the correlated events. This matters because pod logs are often the last piece of the puzzle — and the one that requires the most manual effort to find. Instead of switching contexts to run kubectl logs or digging through a separate log aggregator, the container's own error output is already there.
The logs show a repeated error: Missing required environment variable REQUIRED_VAR— confirming the container cannot start. This immediately tells the team the crash is environment-related, not a code defect or infrastructure failure.
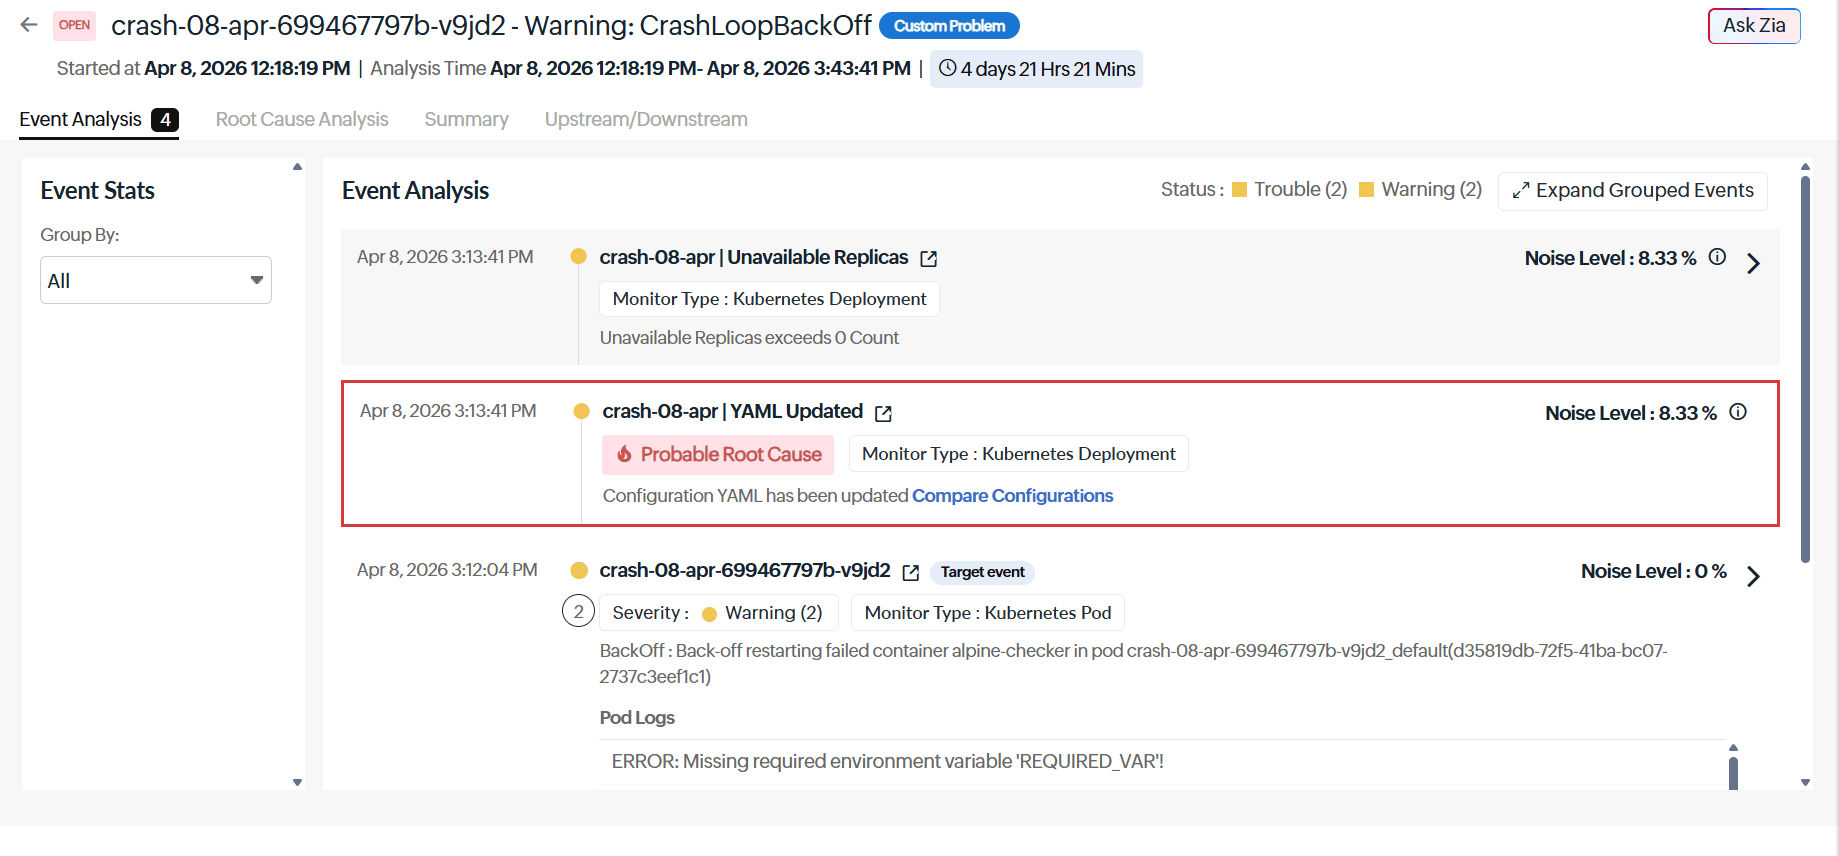 Figure 1. Event Analysis shows pod logs inline with events, where the repeated Missing required environment variable REQUIRED_VAR error quickly confirms an environment-related crash
without needing kubectl logs or external tools.
Figure 1. Event Analysis shows pod logs inline with events, where the repeated Missing required environment variable REQUIRED_VAR error quickly confirms an environment-related crash
without needing kubectl logs or external tools.
Root Cause Analysis (RCA)
The RCA tab clearly shows that a recent YAML update in the crash-08-apr Kubernetes deployment is the likely cause of the issue. It also provides a built-in YAML comparison, so the team can easily see what changed between the two versions. From this difference, they notice that the environment variable name was accidentally changed from REQUIRED_VAR to REQUIRED_VA_BROKEN.
The team fixes the typo, updates the YAML file, and redeploys it. They then use the Event Analysis tab to confirm that the pods are normally running again.
Everything needed to find and fix the issue such as the config change and the error details, are available in one place. No need to involve multiple teams or manually search through logs.
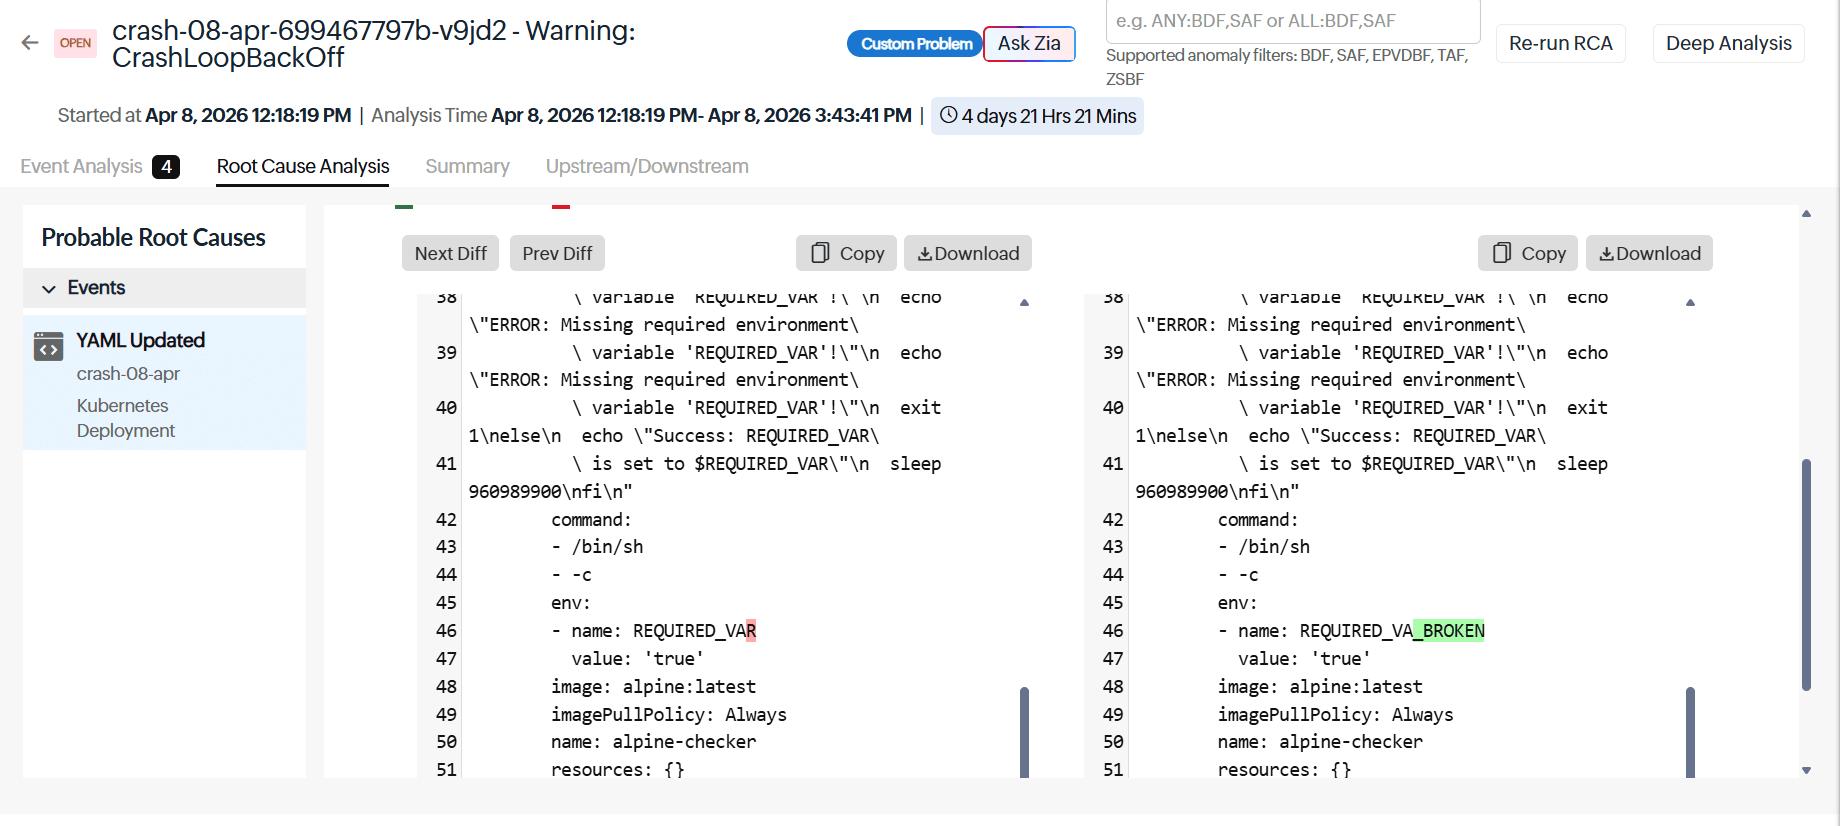 Figure 2. Root Cause Analysis tab flags the recent YAML update as the root cause and shows a built-in diff highlighting the REQUIRED_VAR > REQUIRED_VA_BROKEN change.
Both MTTD and MTTR improve, not because the team works faster, but because they start with the right information from the beginning.
How Causal AI handles automated incident correlation in OpManager Nexus
OpManager Nexus doesn’t just group alerts—it understands how your system is connected and filters signals based on real relationships. This is what makes it a Kubernetes observability platform rather than a simple alerting tool.
Here’s what makes the correlation accurate:
- Smart Groups: OpManager Nexus automatically creates Smart Groups using your actual environment data such as Kubernetes topology, Application Discovery and Dependency Mapping (ADDM), application interactions, and pod-to-deployment relationships. This means related components (like a pod and its parent deployment) are always evaluated together, while unrelated alerts occurring in the same window are ignored. There's no manual setup. Smart Groups are generated as soon as Kubernetes monitoring is enabled.
- Domain-aware correlation: OpManager Nexus goes beyond simple time-based correlation by understanding events in a Kubernetes context. It recognizes causal relationships—such as a YAML config change leading to a pod crash—and identifies the config change as the probable root cause, rather than just grouping events by timing. Using topology-aware logic, it filters out unrelated alerts (like network latency issues), resulting in a single, focused Problem with a clear cause instead of a cluttered incident that requires manual triage. This is the mechanism behind AIOps alert noise reduction in Kubernetes environments — instead of dozens of alerts per incident, your team receives one prioritized Problem. The result is measurable Kubernetes MTTR reduction: your team spends zero time on manual alert triage and goes straight to the fix.
Getting set up in four steps
Follow these steps to get started with event correlation in OpManager Nexus:
Step 1: Deploy the OpManager Nexus Kubernetes monitoring agent as a DaemonSet in your cluster.
Step 2: Once the agent is running, OpManager Nexus automatically discovers your Kubernetes components, creates Smart Groups based on their dependencies, and enables event correlation.
Step 3: Set thresholds for the metrics that matter most such as unavailable replicas, pod restart counts, container crash rates, and deployment configuration changes.
Step 4: When an issue occurs, navigate to Alarms > Problems and open the relevant Problem. You can use Root Cause Analysis tab to identify the issue and Event Analysis to review logs and events.
Conclusion
In the above incident, the team went from a CrashLoopBackOff alert to a corrected deployment in minutes. A typo in a single environment variable name could have taken significant manual effort to trace across pod logs, deployment revisions, and config history. Instead, Causal AI in OpManager Nexus correlated the YAML update to the pod crash automatically, surfaced the exact diff, and gave the team one clear starting point. When a routine update quietly breaks a deployment, OpManager Nexus makes sure your team finds the line that changed—before users feel it.
FAQs
What is CrashLoopBackOff in Kubernetes?
CrashLoopBackOff is a Kubernetes error state where a container keeps failing on startup and Kubernetes keeps restarting it, only for it to crash again each time. It usually signals something is wrong with the container's configuration, environment variables, or dependencies.
What is the difference between an event and a Problem in OpManager Nexus?
An event is a single alert triggered when something crosses a threshold or changes state. A Problem is created when multiple related events are automatically grouped together because they share a common underlying cause. Instead of seeing three separate alerts, your team sees one Problem with context and a probable root cause already identified.
What is domain-aware correlation?
Domain-aware correlation means the correlation engine understands how specific environments work, not just that two alerts happened around the same time, but whether they are actually related. In Kubernetes, for example, it knows that a YAML config change and a pod crash are causally connected, so it links the right events together and filters out the unrelated ones.
How do Smart Groups work in OpManager Nexus?
Smart Groups automatically cluster interdependent monitors using Kubernetes topology, ADDM, and service/application relationships. During incidents, correlation is limited to monitors within the same group—e.g., a pod failure is analyzed with its deployment and related events, excluding unrelated alerts. They are auto-created when Kubernetes monitoring is enabled, require no manual setup, and can be enriched with Tags or Monitor Groups.
What is mean time to detect (MTTD) and why does it matter in Kubernetes monitoring?
MTTD is the time taken to detect and understand an incident after it begins. In Kubernetes, one root issue often triggers multiple disconnected alerts across layers, increasing MTTD. Causal AI reduces this by correlating alerts in real time, helping teams identify the true cause from the first notification instead of chasing symptoms.