Kubernetes observability for modern container platforms

Leverage Kubernetes observability across clusters, workloads, and microservices with OpManager Nexus. Monitor cluster health, correlate metrics, logs, events, and traces and quickly troubleshoot performance issues across on-premises, cloud, and hybrid Kubernetes environments.

What you get

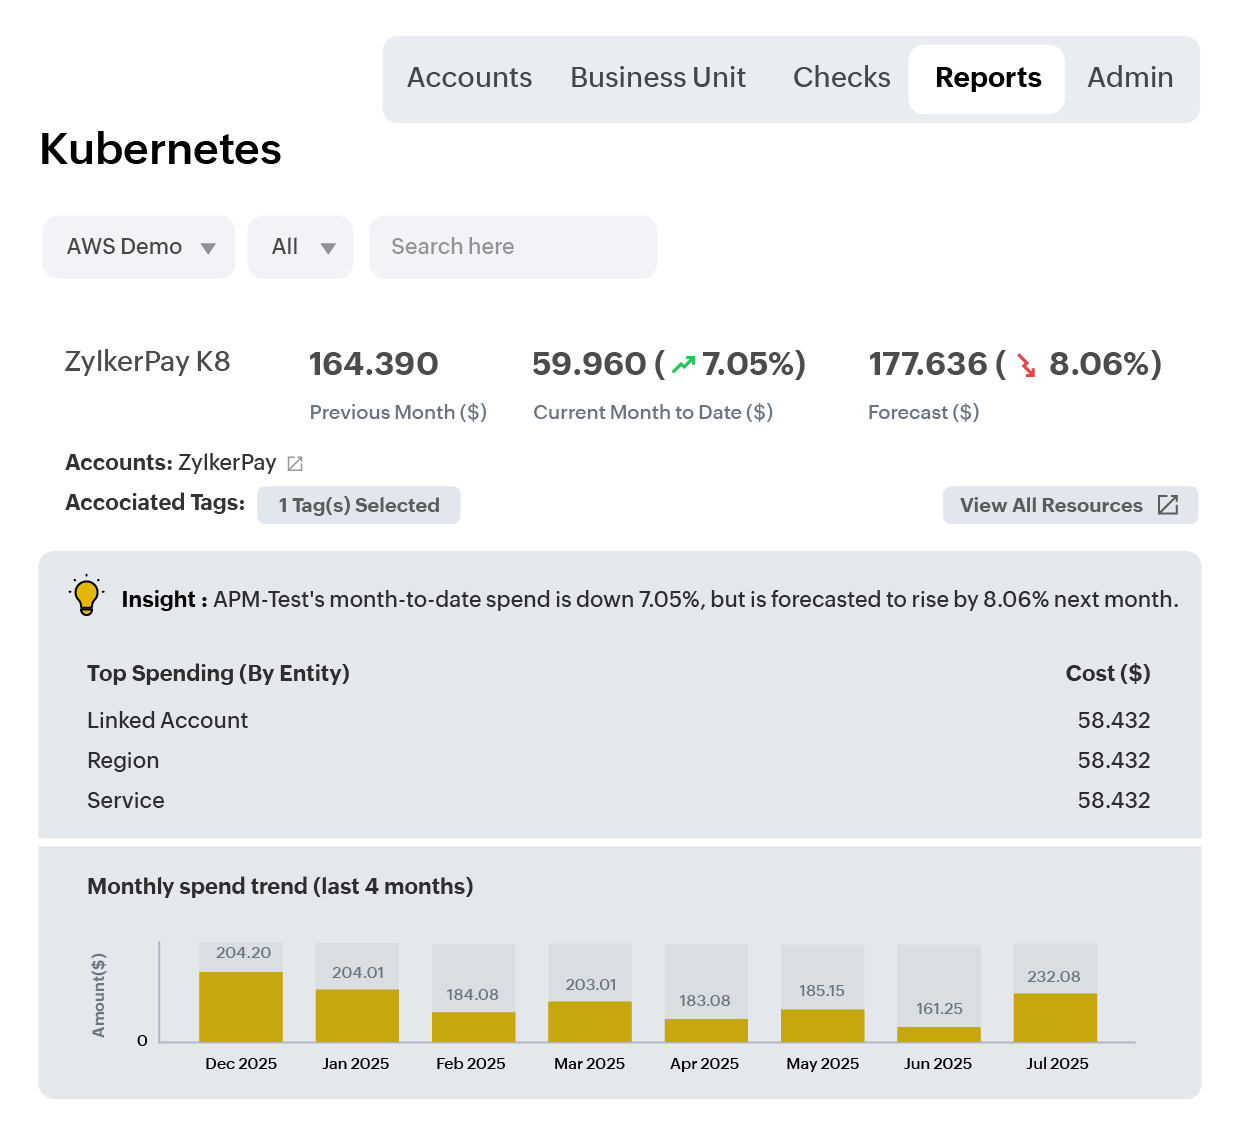
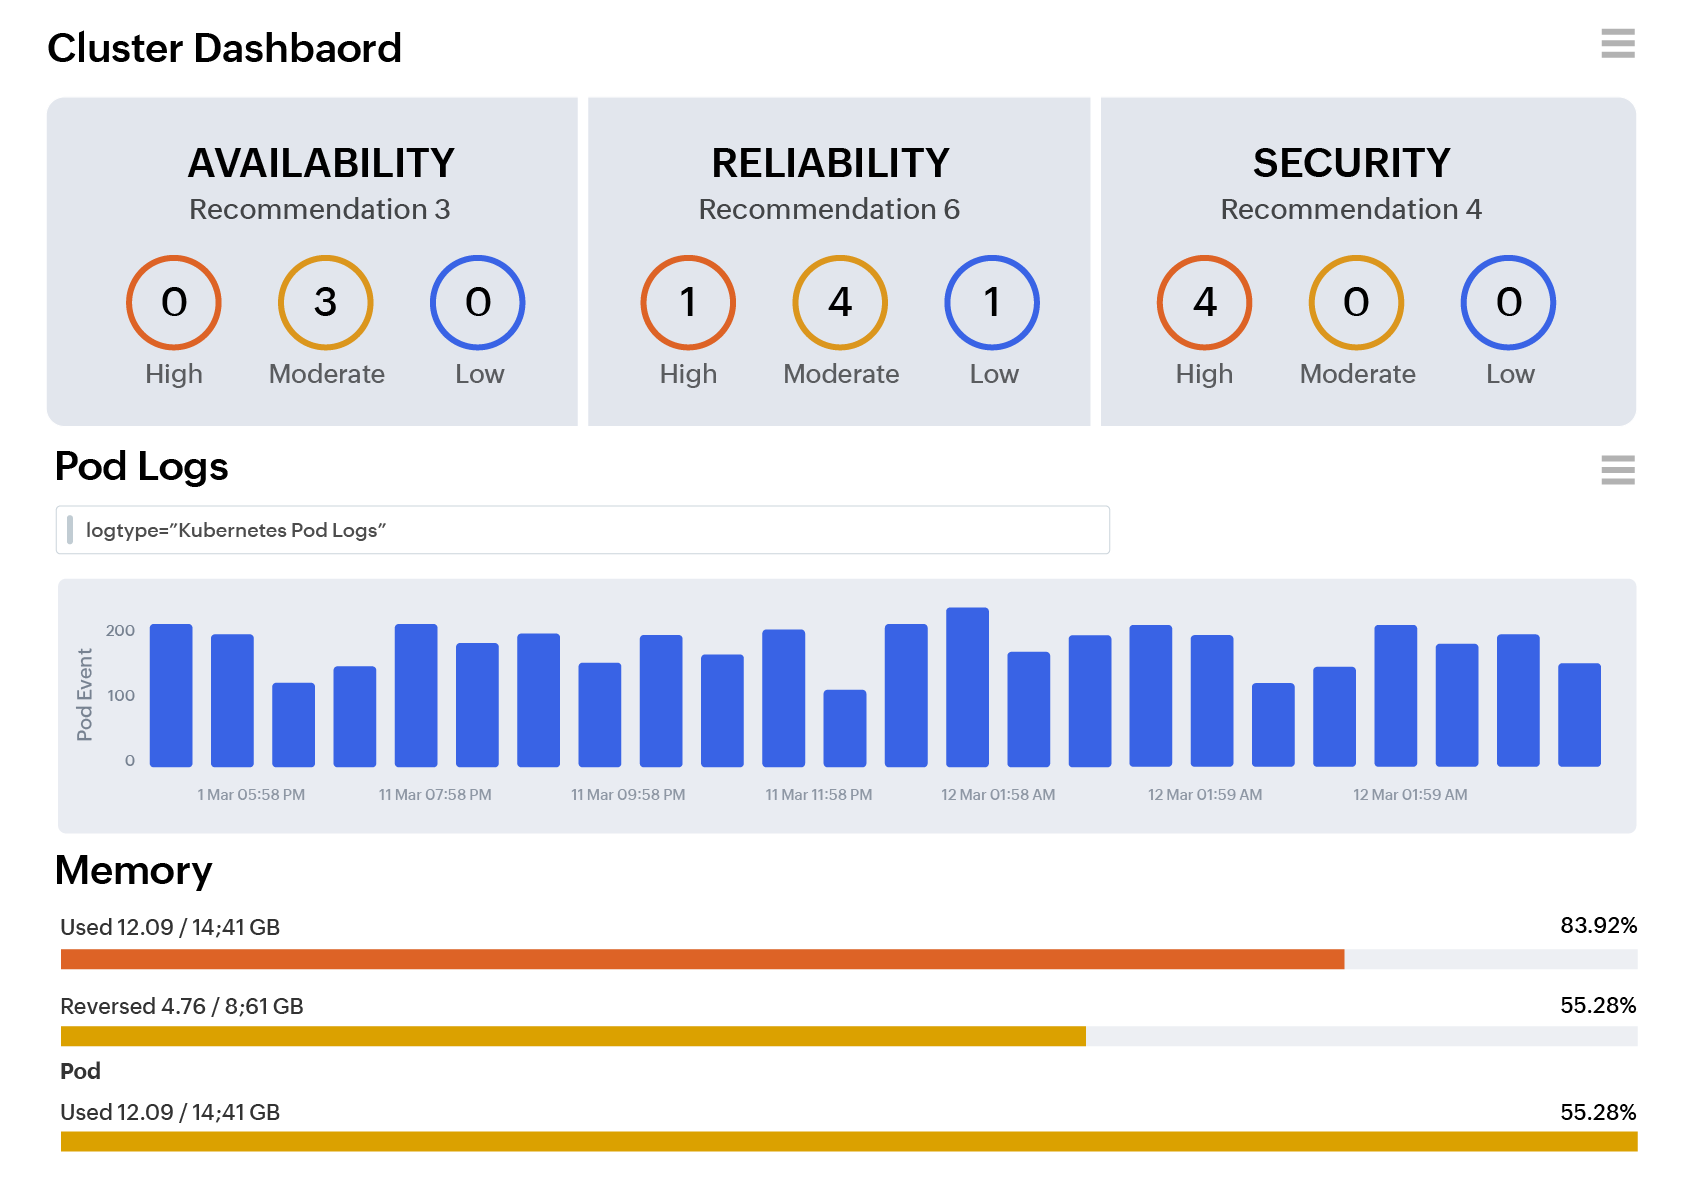
OpManager Nexus provides real-time visibility into the health, performance, and security of Kubernetes environments across on-premises, cloud, and hybrid deployments. With unified telemetry collection via Prometheus and OpenTelemetry, platform teams can detect and investigate issues across every layer of their clusters. They can also correlate metrics, logs, events, and traces alongside security signals to get complete visibility into their Kubernetes workloads and microservices.

What is Kubernetes Observability?

Unified Telemetry

Unified Telemetry

Collect and analyze metrics, logs, events, and distributed traces across every layer of your Kubernetes cluster.

Advanced Analysis

Beyond Traditional Monitoring

Go beyond tracking predefined conditions—ask new questions about system behavior without deploying additional instrumentation.

Dynamic Environments

Built for Dynamic Environments

Designed for container workloads that continuously scale, restart, and change across on-premises, cloud, and hybrid infrastructure.

Internal State Visibility

Internal State Visibility

Understand what is happening inside your cluster at any given moment, across nodes, pods, deployments, and microservices.

Get complete Kubernetes observability with OpManager Nexus

Monitor clusters, workloads, and microservices with a unified observability platform, across on-premises, cloud, and hybrid Kubernetes environments.

Start your free trial