When users report that an application is slow, the investigation almost always turns into a cross-team exercise. The application team checks transaction traces. The network team checks interface utilization. The server team checks CPU and memory. The security team checks firewall session tables. Each team works within its own toolset, using its own monitoring console, and applying its own interpretation of the evidence.
The result is a fragmented picture: Each domain reports that its own layer looks acceptable in isolation, while users continue to experience degradation. When the root cause sits at the intersection of these layers—such as a saturated wide area network (WAN) link, a firewall session table hitting capacity, or a misconfigured quality of service (QoS) policy—no team can see it because no single domain tool has visibility across the entire chain.
Cross-layer root cause analysis (RCA) solves this by treating the network, infrastructure, and application as a single service chain rather than three separate monitoring domains. This article explains how it works, what it requires, and what it changes for network operations center (NOC) operations.
Why single-layer monitoring fails at RCA
Traditional monitoring tools are domain-specific by design. Network monitoring tools track interface metrics, bandwidth, and routing health. Infrastructure monitoring tools track CPU, memory, and disk utilization. Application performance monitoring (APM) tools track transaction response times, error rates, and code-level performance. Each does its job well within its own boundary. The problem is that service failures rarely respect those boundaries. Most real-world incidents, particularly the ones with the highest business impact, involve a failure at one layer that causes degradation at another. A network event causes application slowness. An infrastructure resource constraint causes database query latency. A firewall policy change causes intermittent packet loss that only manifests under load.
When monitoring is siloed, the symptom is visible in the application layer while the root cause lies in the network or infrastructure layer. As a result, the application team escalates the issue to the network team, who escalates it to the security team, who finds nothing obviously wrong and returns the ticket. Meanwhile, mean time to repair (MTTR) accumulates, pushing the incident's SLA toward a breach.
Most high-impact incidents have a root cause at one layer and visible symptoms at another. Single-layer monitoring tools can see the symptoms, but only cross-layer correlation can identify the cause.
The service dependency map: The prerequisite for cross-layer RCA
Cross-layer RCA is only possible when the relationships between layers are mapped and maintained. A service dependency map is the structure that makes this possible.
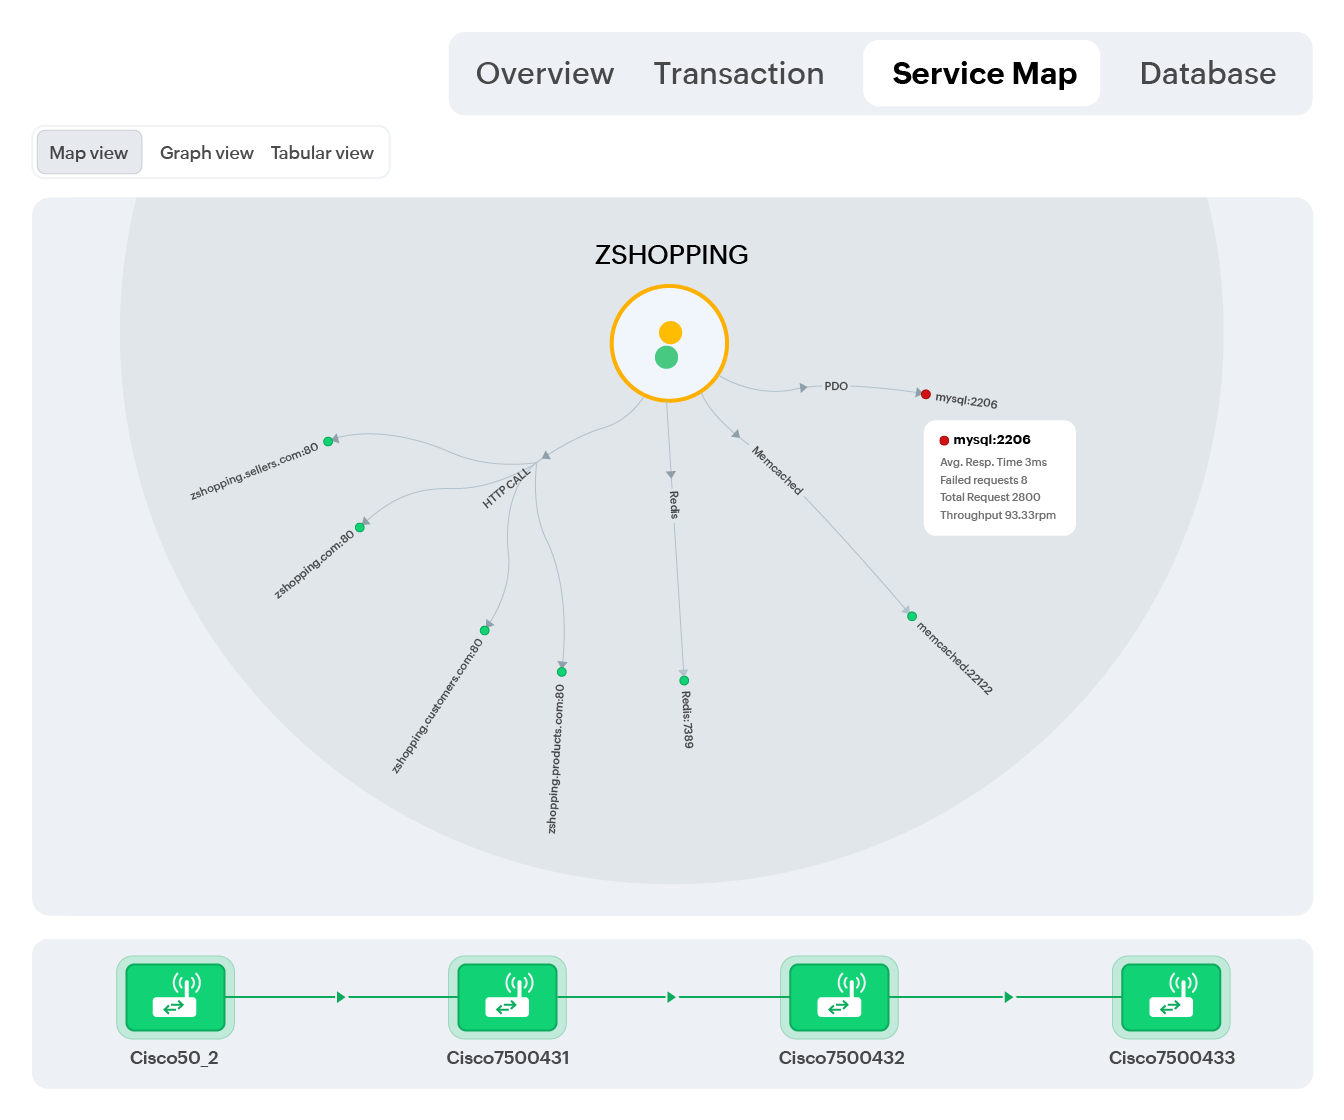
The service dependency map connects each monitored entity to the entities it depends on and the entities that depend on it. An application server depends on a database server, a WAN link, and a firewall. The database server depends on storage and the same network path. The WAN link depends on the internet service provider (ISP) circuit and the edge router. Each dependency is a potential propagation path for failure.
OpManager Nexus builds and maintains this map continuously using data from multiple discovery mechanisms: Simple Network Management Protocol (SNMP) polling for network devices, agent-based monitoring for servers, APM agents for application services, NetFlow and sFlow analysis for traffic paths, and native cloud API connectors for cloud-hosted resources. The resulting map is updated in real time as devices are added, removed, or reconfigured.
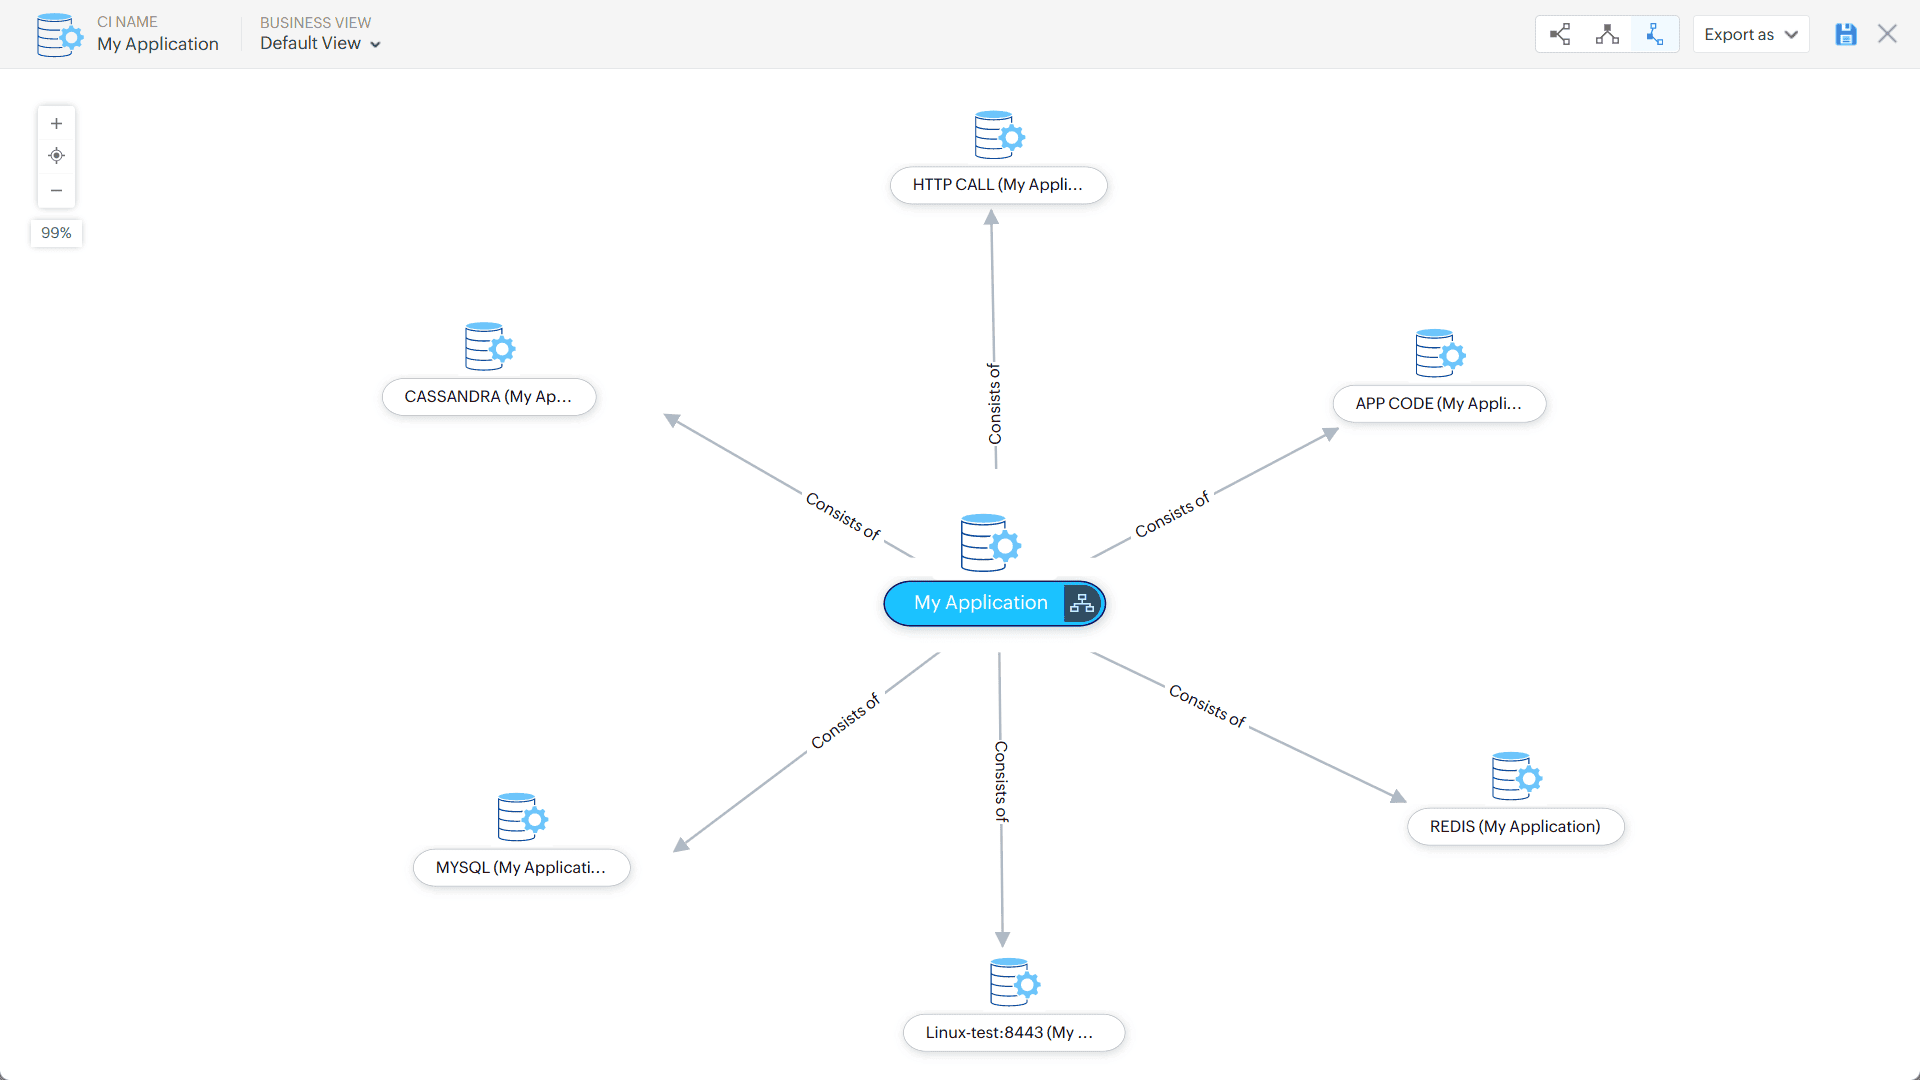
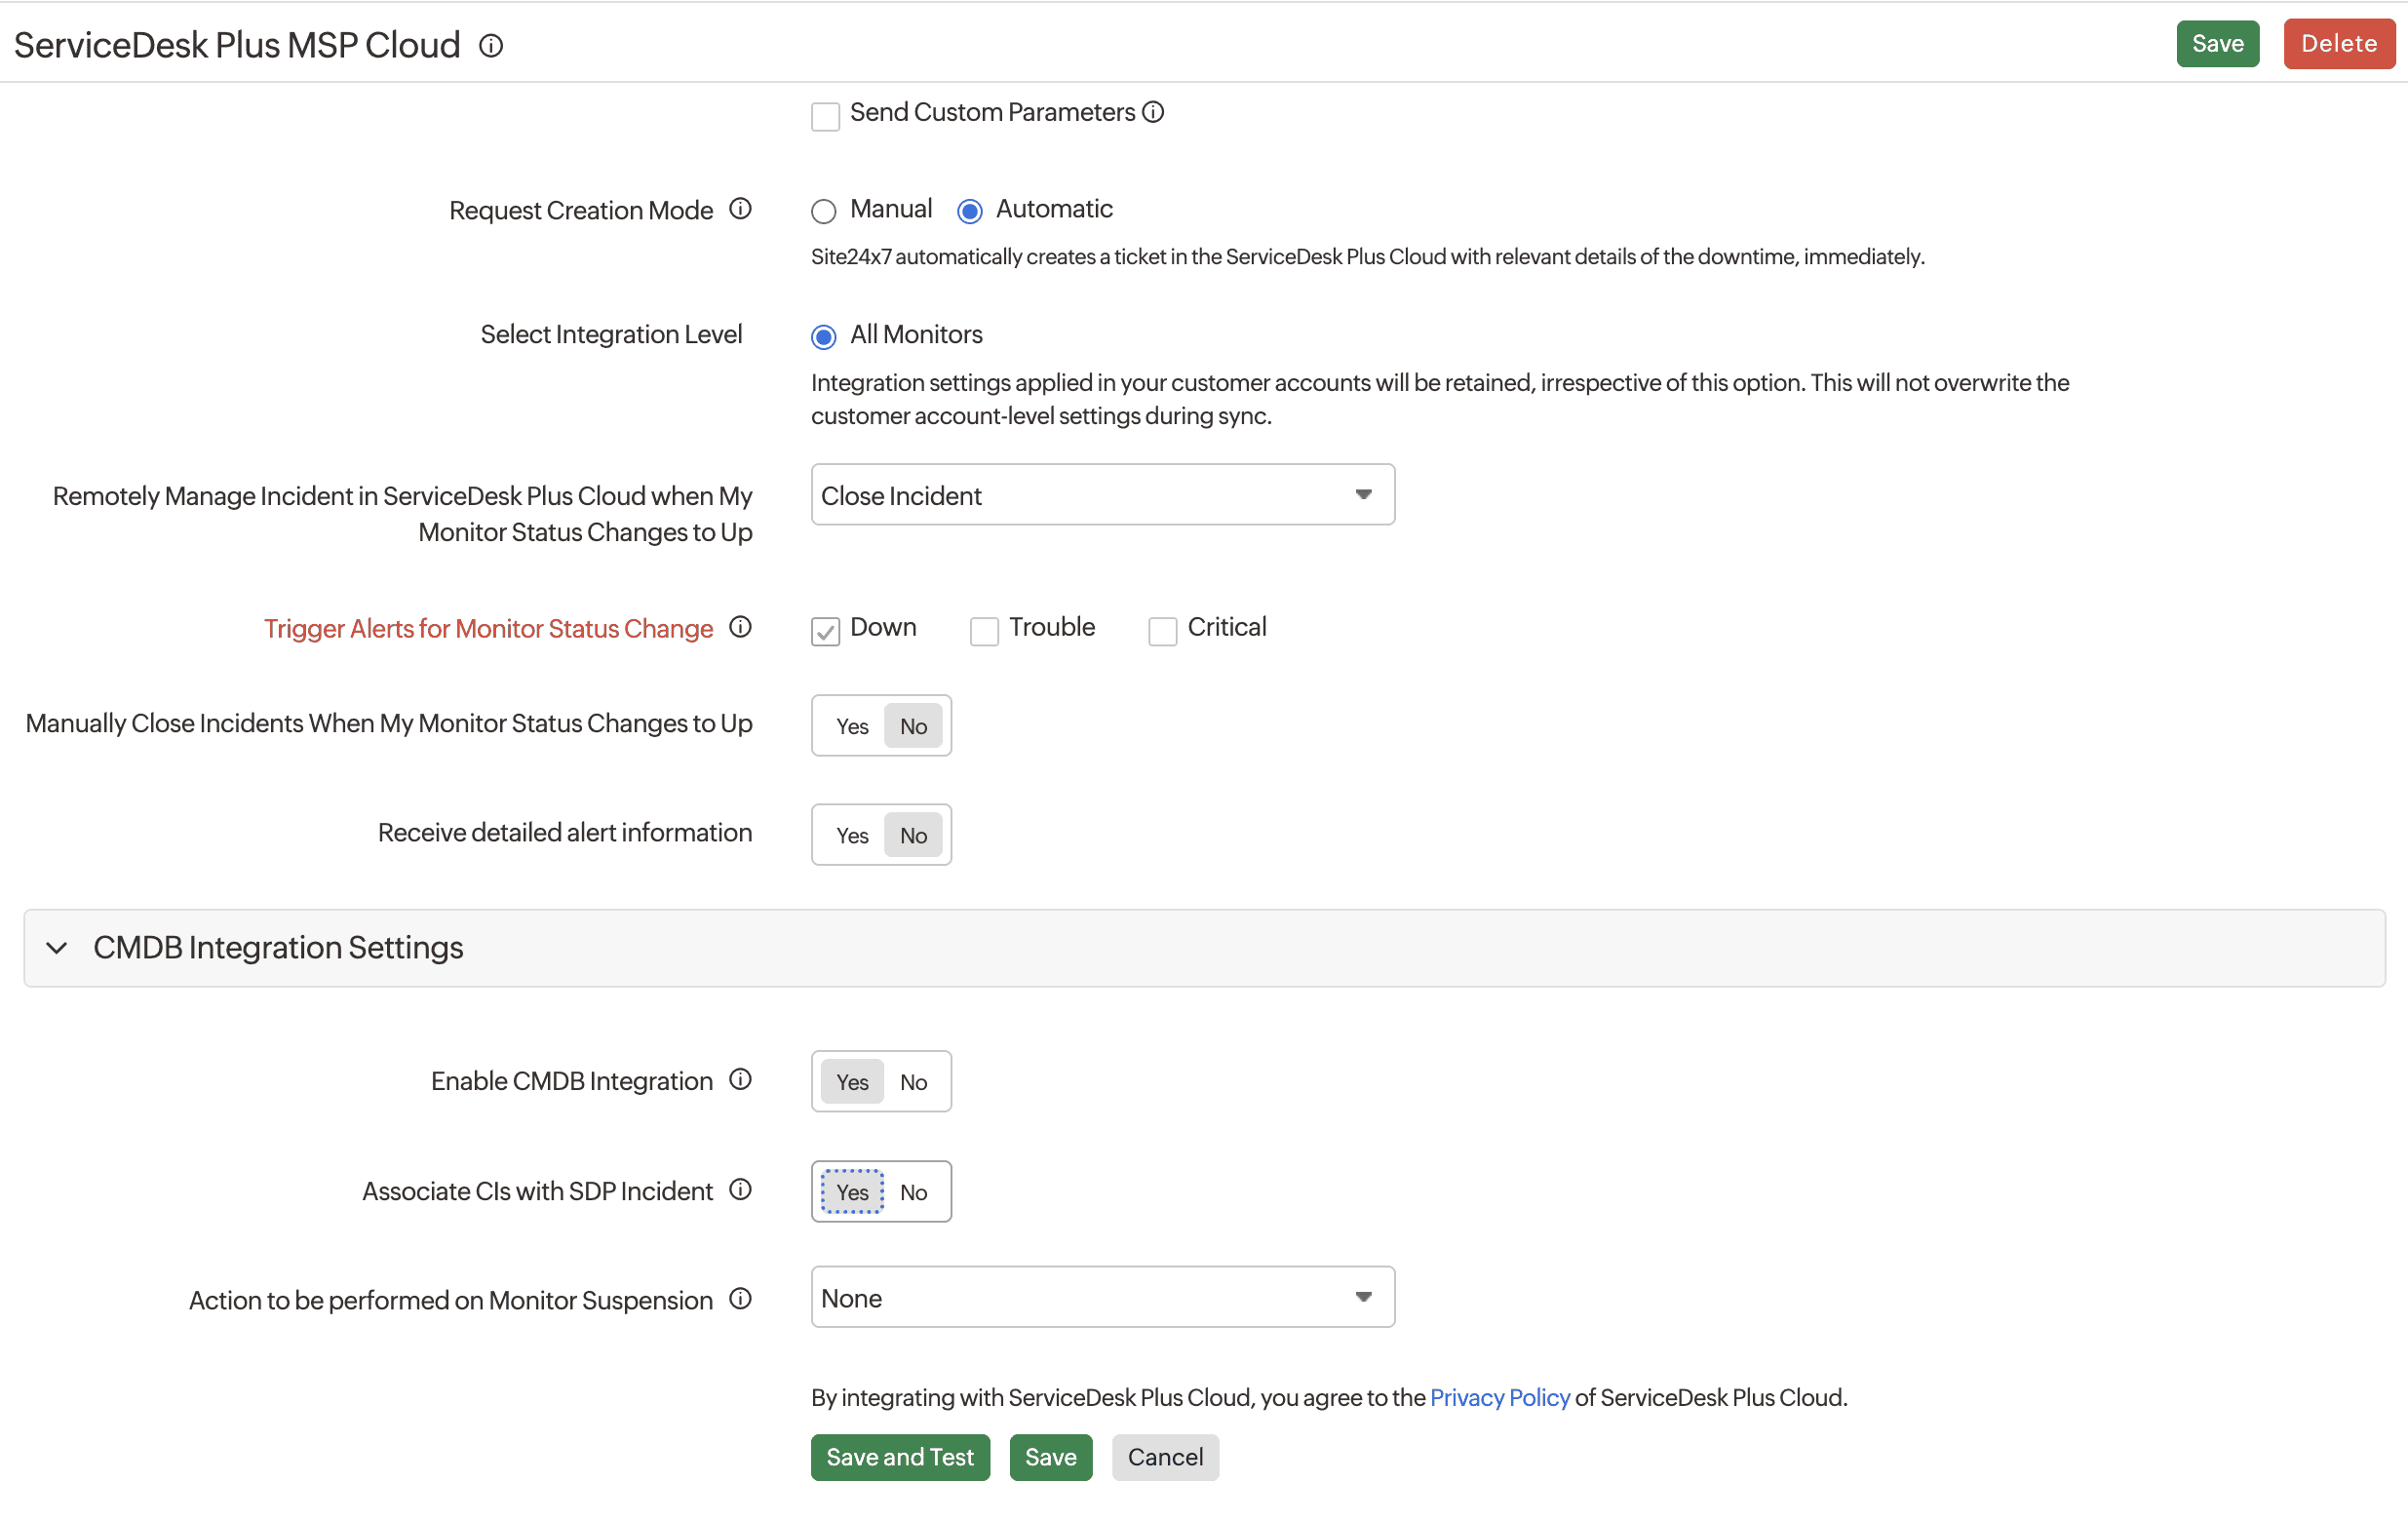
The configuration management database (CMDB) in this context is the persistent record of the map. Configuration item (CI) attributes stored in ServiceDesk Plus—such as owner, location, business service association, and criticality tier—are layered onto the topology to give each node its operational context. When an alert fires, the platform can traverse the map to understand what the affected CI connects to, what it depends on, and what depends on it.
How cross-layer correlation works in practice
When application slowness is detected, the platform does not wait for an engineer to begin an investigation. It immediately begins traversing the service dependency map from the affected application outward, collecting telemetry from every node in the chain simultaneously.
In the scenario of a saturated WAN link causing application degradation, the correlated telemetry picture looks like this:
| Layer | Observed anomaly |
|---|---|
| Application (APM) | Apdex score drops below threshold; transaction response time increases threefold; error rate rises on external API calls. |
| Server (infrastructure) | CPU and memory within normal range; no local resource constraint; application process healthy. |
| Database | Query response time normal when tested locally; latency only on queries initiated from application servers at the branch. |
| Firewall (SNMP) | Session table utilization at 94%; throughput normal; no policy violations logged. |
| WAN link (NetFlow/SNMP) | Interface utilization at 97% capacity; packet loss detected at 1.2%; jitter elevated on real-time traffic classes. |
| Branch switch | All interfaces up; local switching healthy; upstream WAN interface showing input errors. |
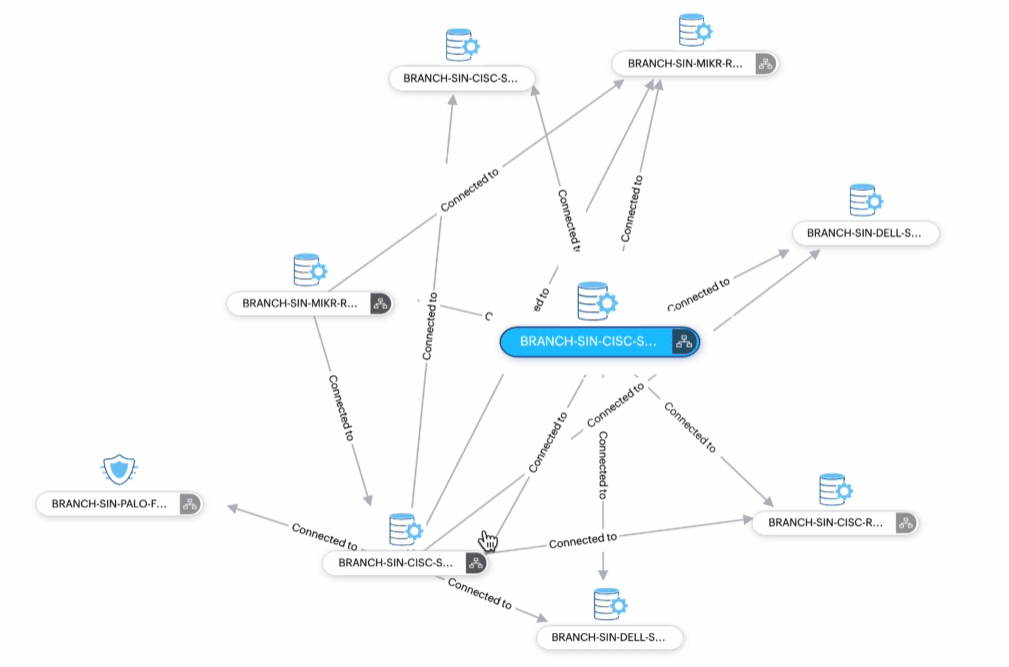
Without cross-layer correlation, this picture requires a human to collect data from six separate tools and identify the pattern. With cross-layer correlation, the platform assembles the picture automatically, identifies the WAN link as the common dependency for every observed anomaly, and produces a root cause determination: WAN link saturation is causing packet loss and latency on all traffic traversing the branch-to-DC path, including application transactions, database queries, and API calls.
The incident ticket is created with the analysis pre-populated with the following details: root cause, causal map, impact analysis, affected CIs, impacted business services, and a probable fix recommendation based on the diagnosis.
Topology-aware alert suppression
A consequence of the same failure propagating through multiple layers is that every layer generates its own alerts. Without suppression, the NOC receives alerts for application degradation, server connectivity, database latency, firewall session pressure, and WAN interface errors—all from the same root cause.
Topology-aware suppression uses the service dependency map to identify which alerts are caused by the same root event. Once the WAN link is identified as the root, all downstream alerts—such as application slowness, database latency, and firewall session pressure—are suppressed as symptomatic. They remain visible in the correlation context of the master incident, but they do not generate additional tickets.
The result is a single, enriched incident rather than a cascade of tickets. The NOC team works on bringing one incident to resolution, and the IT service management (ITSM) system reflects the operational reality accurately, rather than being flooded with duplicate tickets that need to be manually linked and closed.
Impact analysis quantification
Knowing the root cause of an incident is half the picture. Understanding the scope of impact is the other half, and impact scope is what determines incident priority, escalation path, and resource allocation.
Impact analysis in OpManager Nexus traverses the dependency map from the root event outward and quantifies:
- The number of application services experiencing degradation.
- The business services affected, mapped from CI to service tier in the ServiceDesk Plus CMDB.
- The number of users or user groups experiencing the impact.
- The service level agreements (SLAs) at risk, calculated from the time elapsed and the applicable SLA thresholds.
- The sites or locations affected for geographically distributed environments.
This information is included in the incident record at creation. The engineer does not need to calculate the impact analysis manually. Impact analysis is available the moment the ticket appears in the ITSM queue, and priority is calculated automatically from the combination of technical severity and business impact. For example, a WAN outage affecting a single test server is treated very differently from a WAN outage affecting a payment processing application that serves thousands of customers.
The incident the engineer receives
The practical output of cross-layer RCA is an incident record that looks fundamentally different from what traditional monitoring produces. Instead of receiving an alert that says Application response time threshold exceeded, the engineer receives a:
- Root cause: WAN link utilization at 97%, packet loss 1.2%, located at Chennai DC to Mumbai branch circuit.
- Causal map: Application servers to database to WAN link to firewall session pressure.
The engineer joins the incident already at the diagnosis stage, not the beginning of the investigation. The time saved is the time the NOC team was previously spending building this picture manually across multiple consoles.
Cross-layer RCA does not just find the root cause faster. It changes what the engineer is doing as they address the incident from investigation to resolution.
Guided resolution and automation
Once the root cause is identified, the platform can support resolution in two ways depending on the risk level of the action.
For approved, low-risk actions, such as adjusting quality of service (QoS) policies, rerouting traffic to a secondary circuit, restarting a service on a dependent server, or clearing stale sessions from a saturated firewall table, IT Automation can execute the remediation directly. The action is logged with a full audit trail, and the incident is updated with the automated steps taken.
For higher-risk actions, such as ISP escalation, firewall policy change, WAN circuit failover, or database failover to a standby instance, the platform initiates an approval workflow. The change manager receives the enriched incident context and the proposed action, approves or modifies it, and the approved action is executed. This keeps automation moving quickly while maintaining the governance controls that high-risk changes require.
Post-resolution, the incident is closed automatically when the affected CI metrics return to baseline. The RCA narrative, timeline, and resolution steps are preserved in the ServiceDesk Plus knowledge base and the post-incident review record.
What this means for MTTR
The combination of cross-layer correlation, topology-aware suppression, blast radius analysis, enriched incident creation, and guided resolution produces a measurable reduction in MTTR. The stages where time is saved are:
- Initial triage: The alert-to-diagnosis time is reduced because the diagnosis is already done at incident creation.
- Cross-team coordination: The cross-team investigation phase is eliminated because the platform has already assembled the multilayer picture.
- War room time: Pre-enriched incidents with a clear root cause and probable fix significantly reduce or eliminate the war room phase for most incident patterns.
- Escalation cycles: Accurate blast radius and priority calculation means that the right resource is assigned from the start, reducing the back-and-forth cross-team escalation that inflates MTTR. In this incident, the events logged in the window were the application's Apdex drop, the firewall's 94% session utilization, the WAN link's 97% utilization with 1.2% packet loss, and the input errors on the branch switch's upstream interface.
The WAN saturation scenario described above is not a special case. It is what cross-layer RCA looks like whenever a failure at one layer produces symptoms in another—whether a database index rebuild that starves a network link, a certificate expiry that looks like an application outage, or a misconfigured load balancer that surfaces as slow page loads. OpManager Nexus applies the same mechanism each time: ADDM (Application Discovery and Dependency Mapping) keeps the service dependency map current, causal AI traces the failure back to its origin, and the ServiceDesk Plus CMDB integration ensures that the resulting incident carries accurate CI and business service context from the moment it is created and across the full stack of network, infrastructure, application, cloud, and synthetic monitoring.
FAQs
1. What is cross-layer root cause analysis?
Cross-layer root cause analysis (RCA) identifies how a failure in one layer of the IT stack, such as the network, causes visible symptoms in another layer, such as an application. It treats network, infrastructure, and application monitoring as one connected service chain instead of three separate domains.
2. How is cross-layer RCA different from traditional single-layer monitoring?
Single-layer tools only see what happens inside their own domains, typically causing each team to report that its layer looks healthy while the user-facing problem continues. Cross-layer RCA correlates telemetry across every layer at once so that the platform can identify the one dependency, such as a saturated WAN link, that is causing anomalies everywhere else.
3. What is a service dependency map?
A service dependency map records how every monitored entity, from an application server to a firewall to a WAN circuit, depends on and is depended on by other entities. It is the structure that lets a monitoring platform trace a symptom back through the chain to its actual source.
4. What is topology-aware alert suppression?
Topology-aware alert suppression uses the service dependency map to recognize when multiple alerts—such as application slowness, database latency, and firewall session pressure—all trace back to the same root event. It suppresses the downstream, symptomatic alerts as duplicate tickets while keeping them visible in the context of the one master incident.
5. How does cross-layer RCA reduce MTTR?
It reduces MTTR by removing the manual work that normally happens before a fix even starts: triage, cross-team escalation, war room coordination, and back-and-forth reassignment. Because the platform pre-populates the incident with root cause, causal map, and impact analysis, engineers begin at the diagnosis stage instead of the investigation stage.