LLM Observability

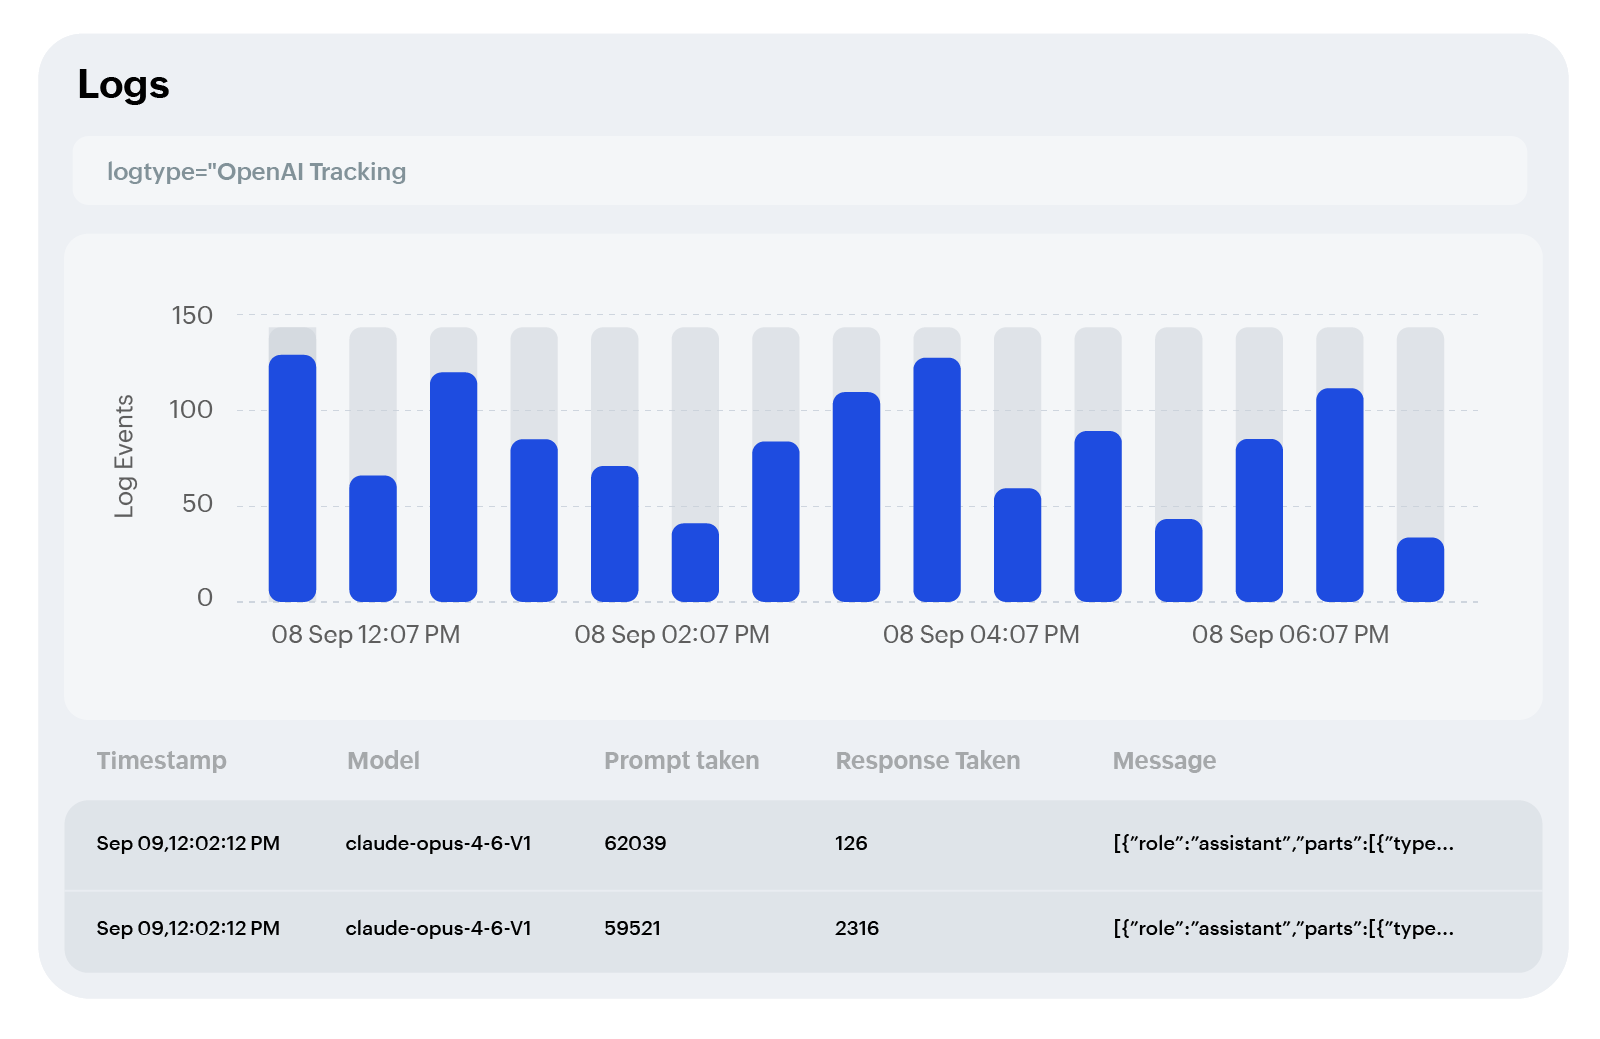
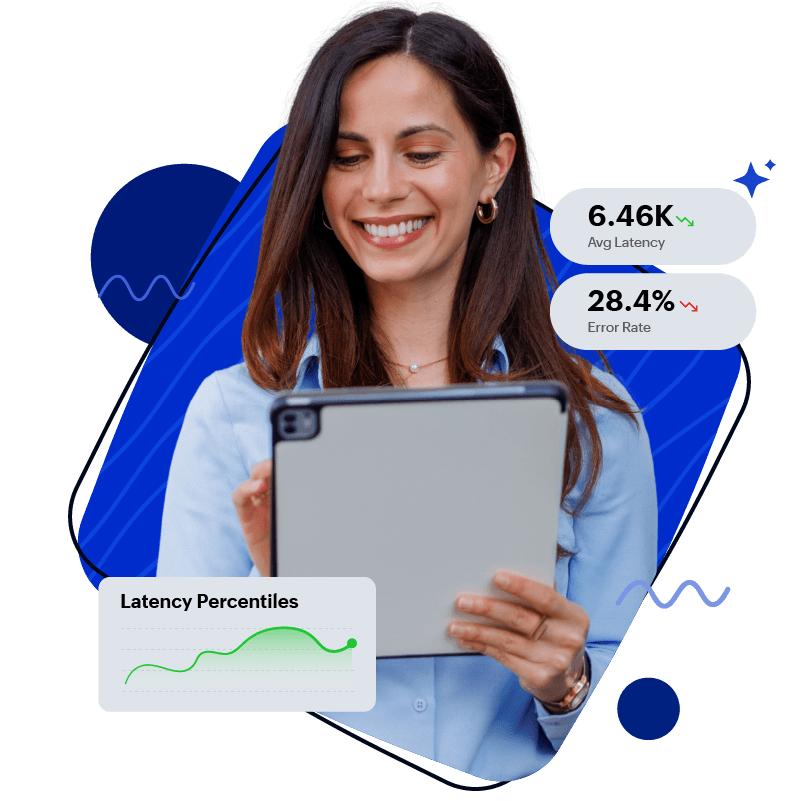
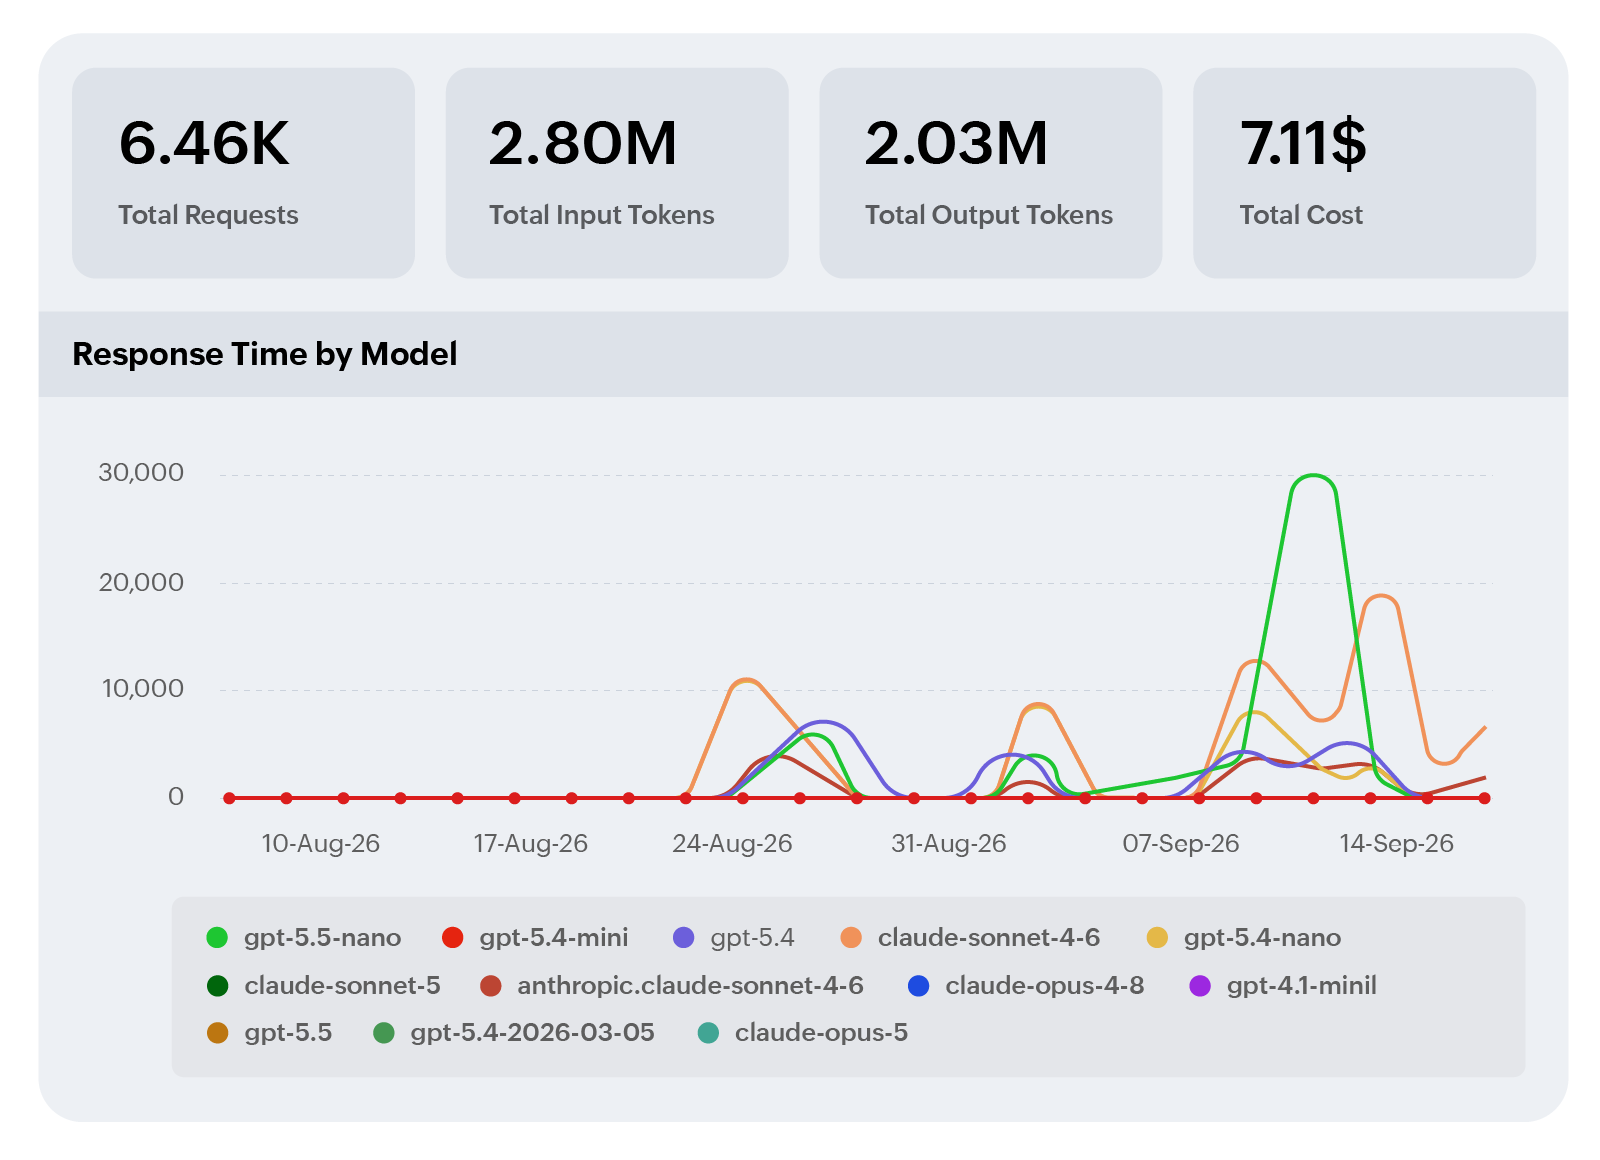
OpManager Nexus gives you a live view across every model running in production; latency, token usage, cost per request, and error rates, all in one dashboard. When something shifts, you see it before your users do.

LLM observability dashboard showing latency, token usage, and cost per model

Feature overview

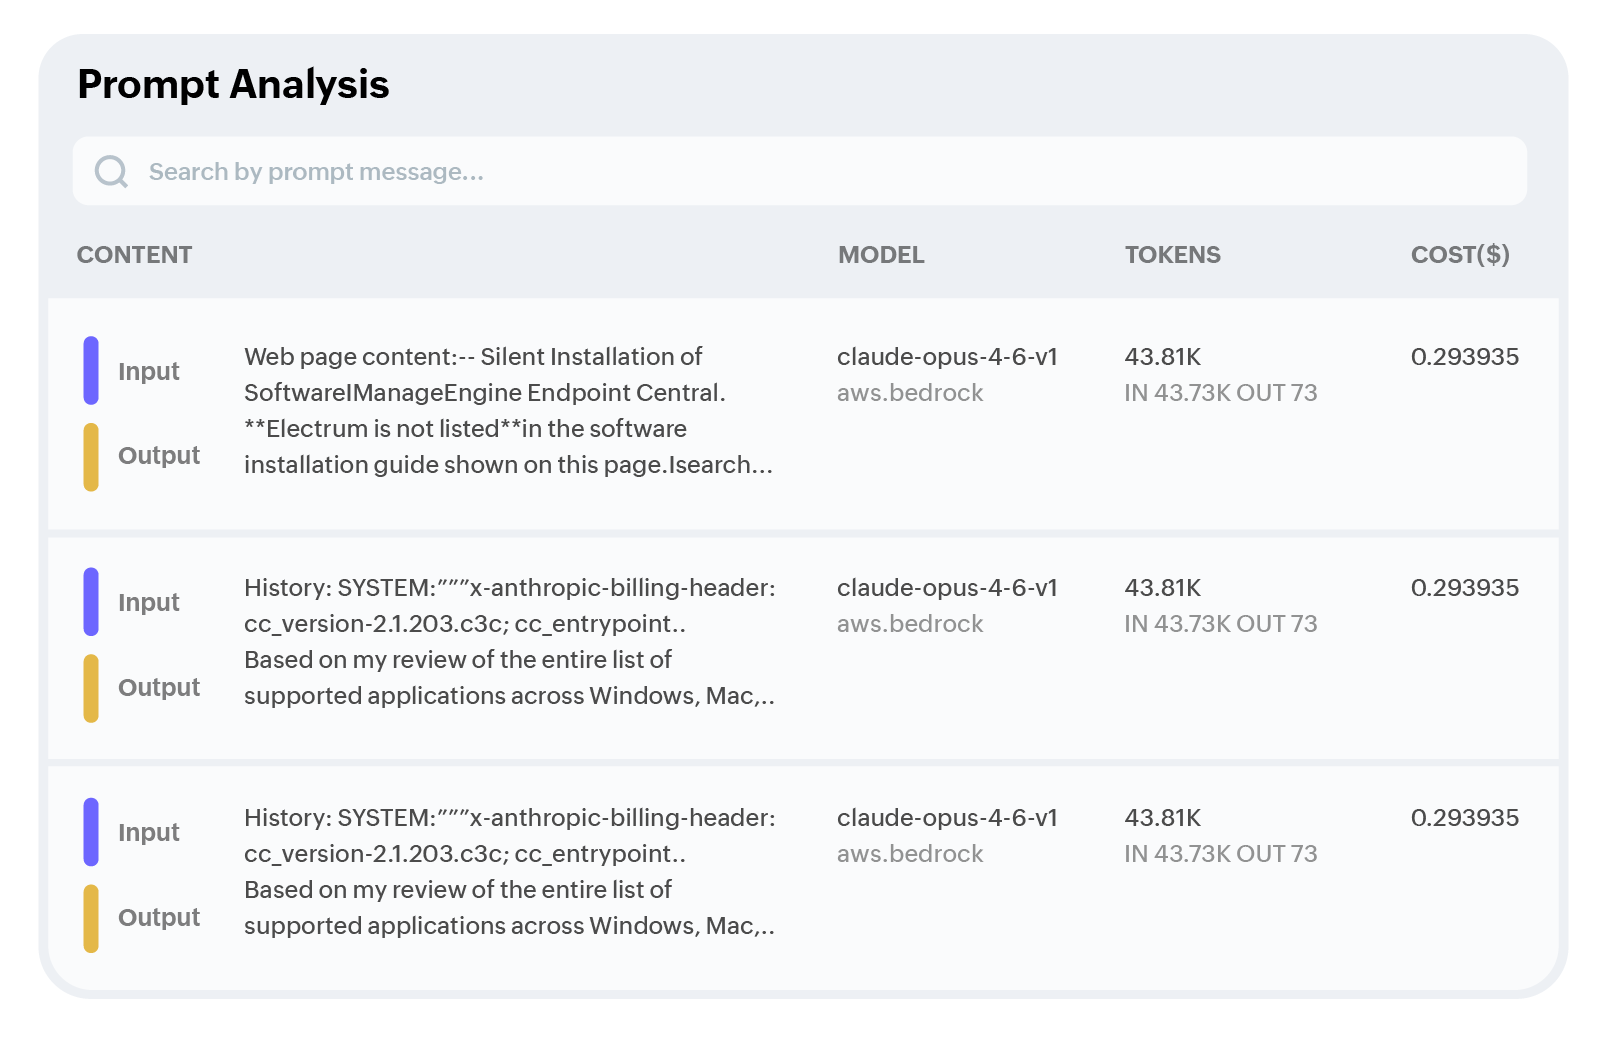
How much do you actually know about what your LLMs are doing in production right now? Most teams know a model is deployed. Few know why costs spiked overnight, which requests are failing, or whether the model is responding the way it should. OpManager Nexus gives your team that visibility across every model, so problems get caught before users do.
Do you know what AI is doing in your IT stack right now?

Get complete visibility into every LLM running in your stack today. Every hour without it is an hour your team is flying blind on cost, performance, and model behavior. Start your free trial and see everything in minutes.

Start your free trial