See it all, solve it fast: The observability dvantage for IT teams
Our ITOM survey of over 450 IT administrators, CIOs, and CTOs reveals that 45% of organizations are focusing on implementing observability and AIOps. This emphasis is understandable because without comprehensive observability, IT teams lack full visibility across the IT stack, hindering their ability to quickly identify and resolve issues. This often results in prolonged troubleshooting and potential user dissatisfaction.
Full-stack observability provides key benefits, including comprehensive visibility for actionable insights and improved performance optimization. These benefits are seamlessly achieved using ManageEngine OpManager Nexus.
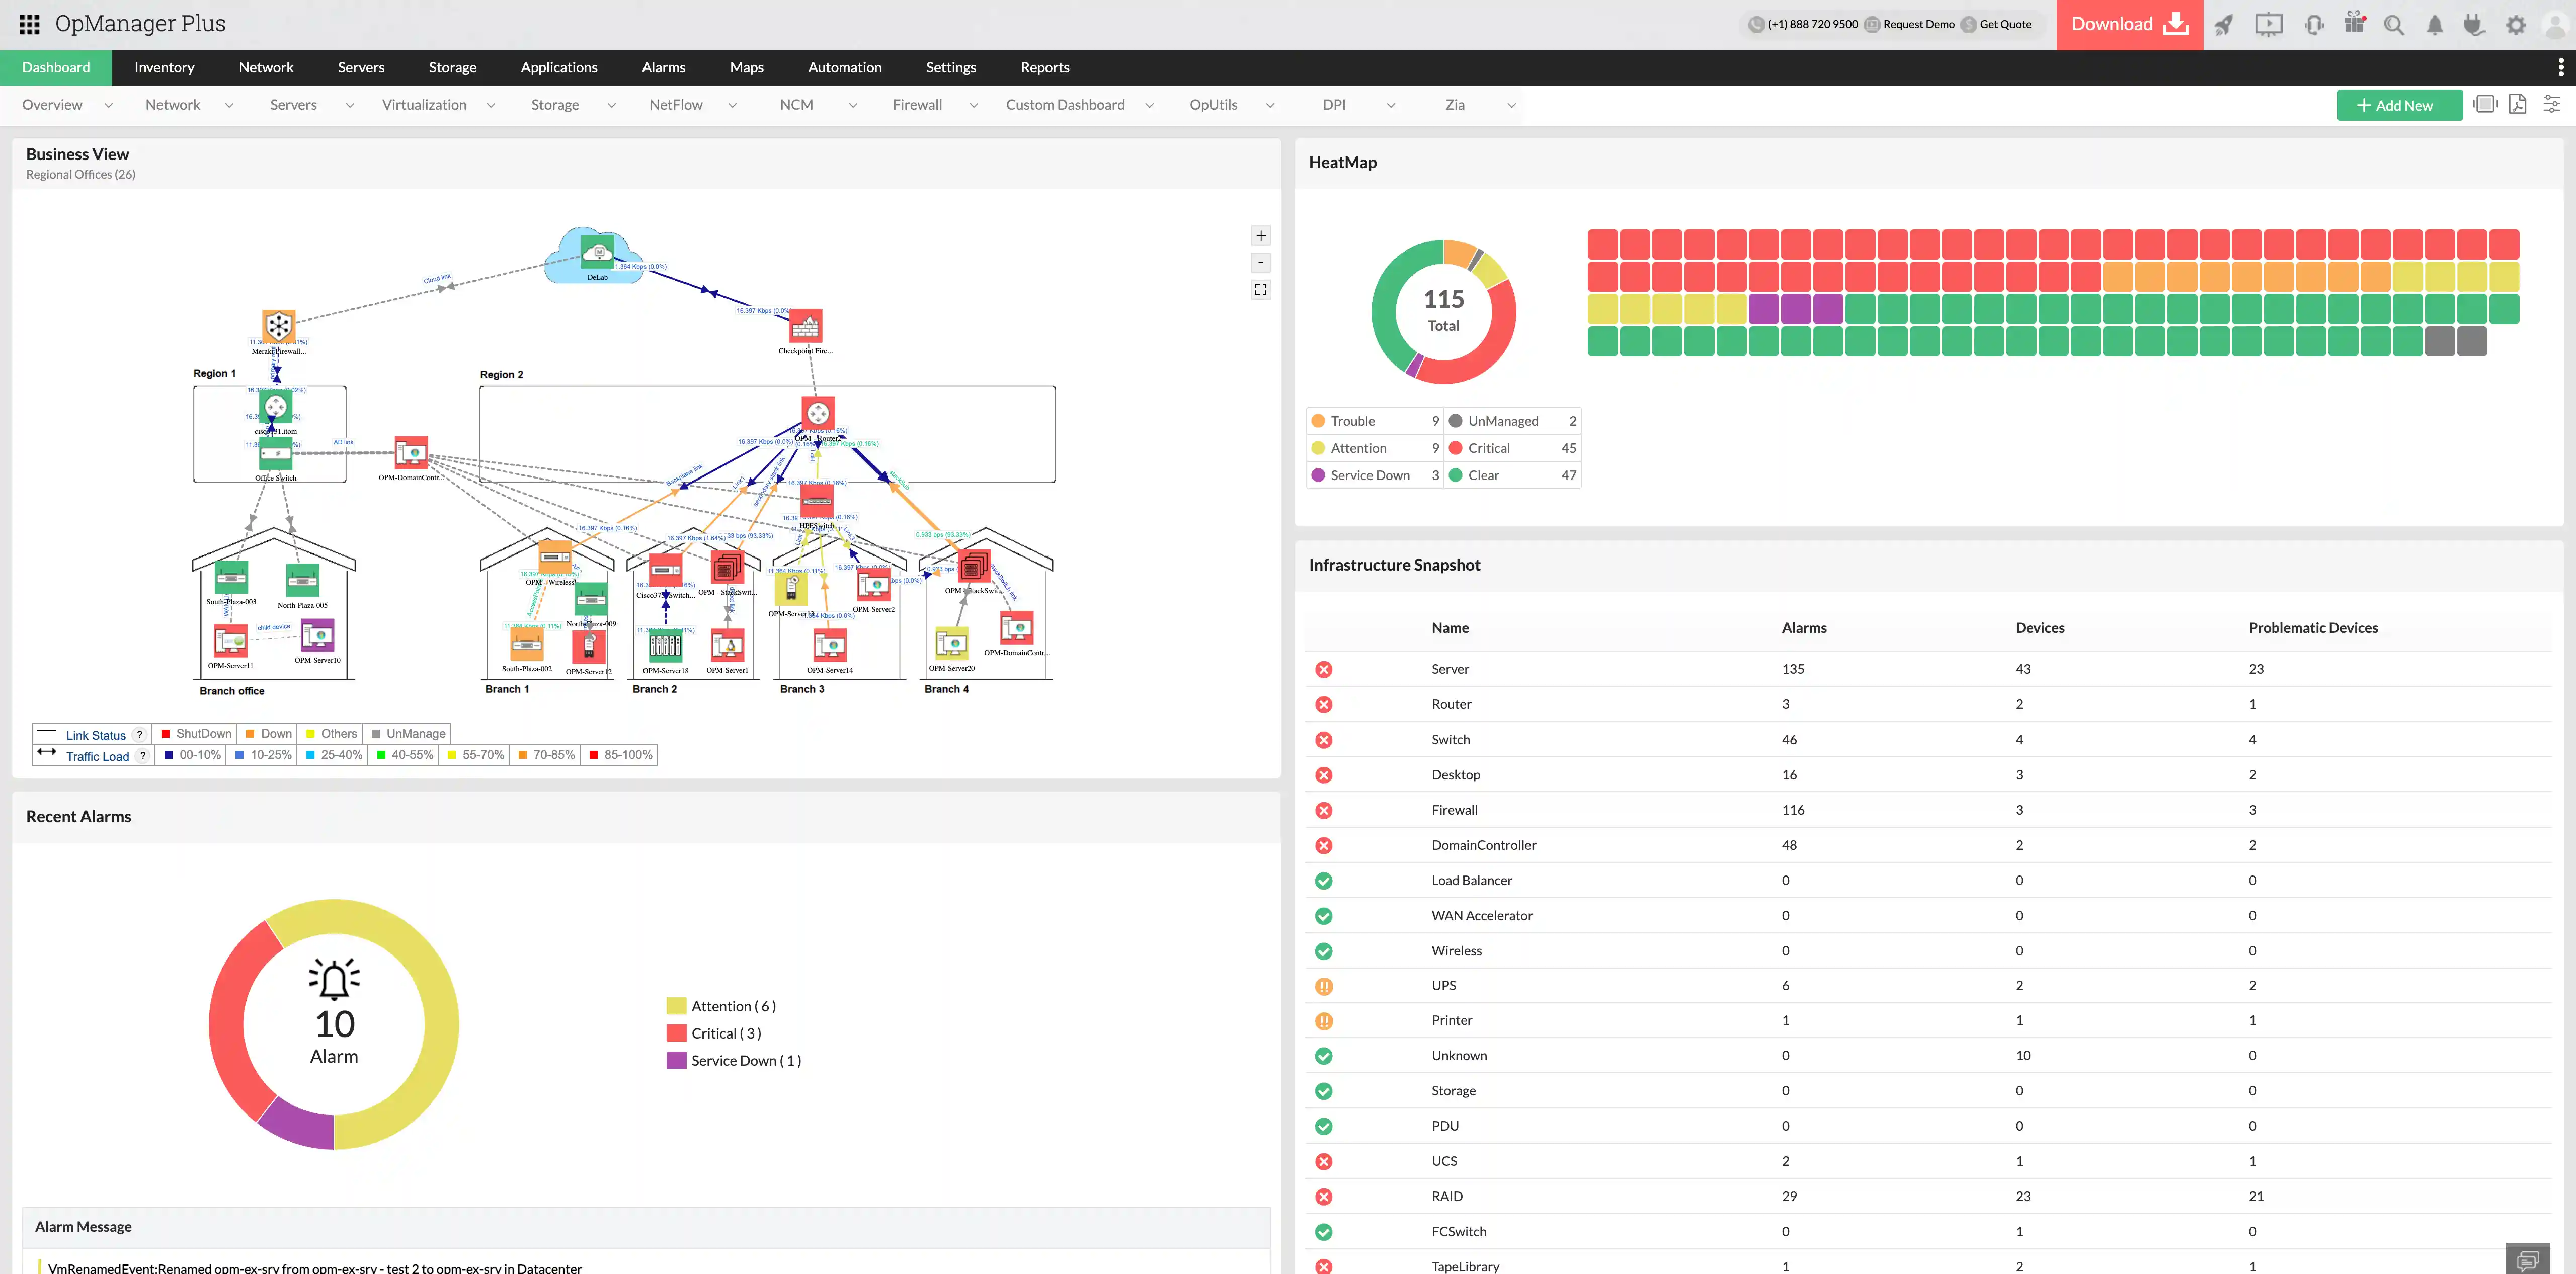
OpManager Nexus enhances IT operations by providing detailed end-to-end visibility into every layer of the IT infrastructure. It delivers insights into each stack, enabling actionable optimizations through its advanced IT operations monitoring and AIOps capabilities.
4 Layer visibility
Server and Storage layer
Monitor server performance across diverse physical and virtual environments. Track key metrics for servers, storage, and networking. Optimize capacity planning and performance.
Network layer
Monitor and optimize the performance of 1000+ network devices, including routers, switches, firewalls, and wireless infrastructure. Gain deep insights into bandwidth consumption, traffic patterns, and IP address management.

Application layer
Gain unified visibility into the performance of both cloud (AWS, Azure, Office 365) and on-premise applications. Conduct in-depth code-level diagnostics, monitor synthetic transactions, and manage critical web services.
Security layer
Centralize firewall management through rule auditing, enforcement, and policy compliance. Implement role-based access control and efficiently deploy configuration changes across network devices to maintain optimal security posture.
Enhance your IT operations with comprehensive observability in OpManager Nexus
Harness observability to turn insights into action. Get dedicated visibility into application monitoring, network and hardware performance, configuration monitoring, bandwidth management, firewall log analysis, and IP/switch port management—all in one platform, enhanced by AIOps.
Applications monitoring
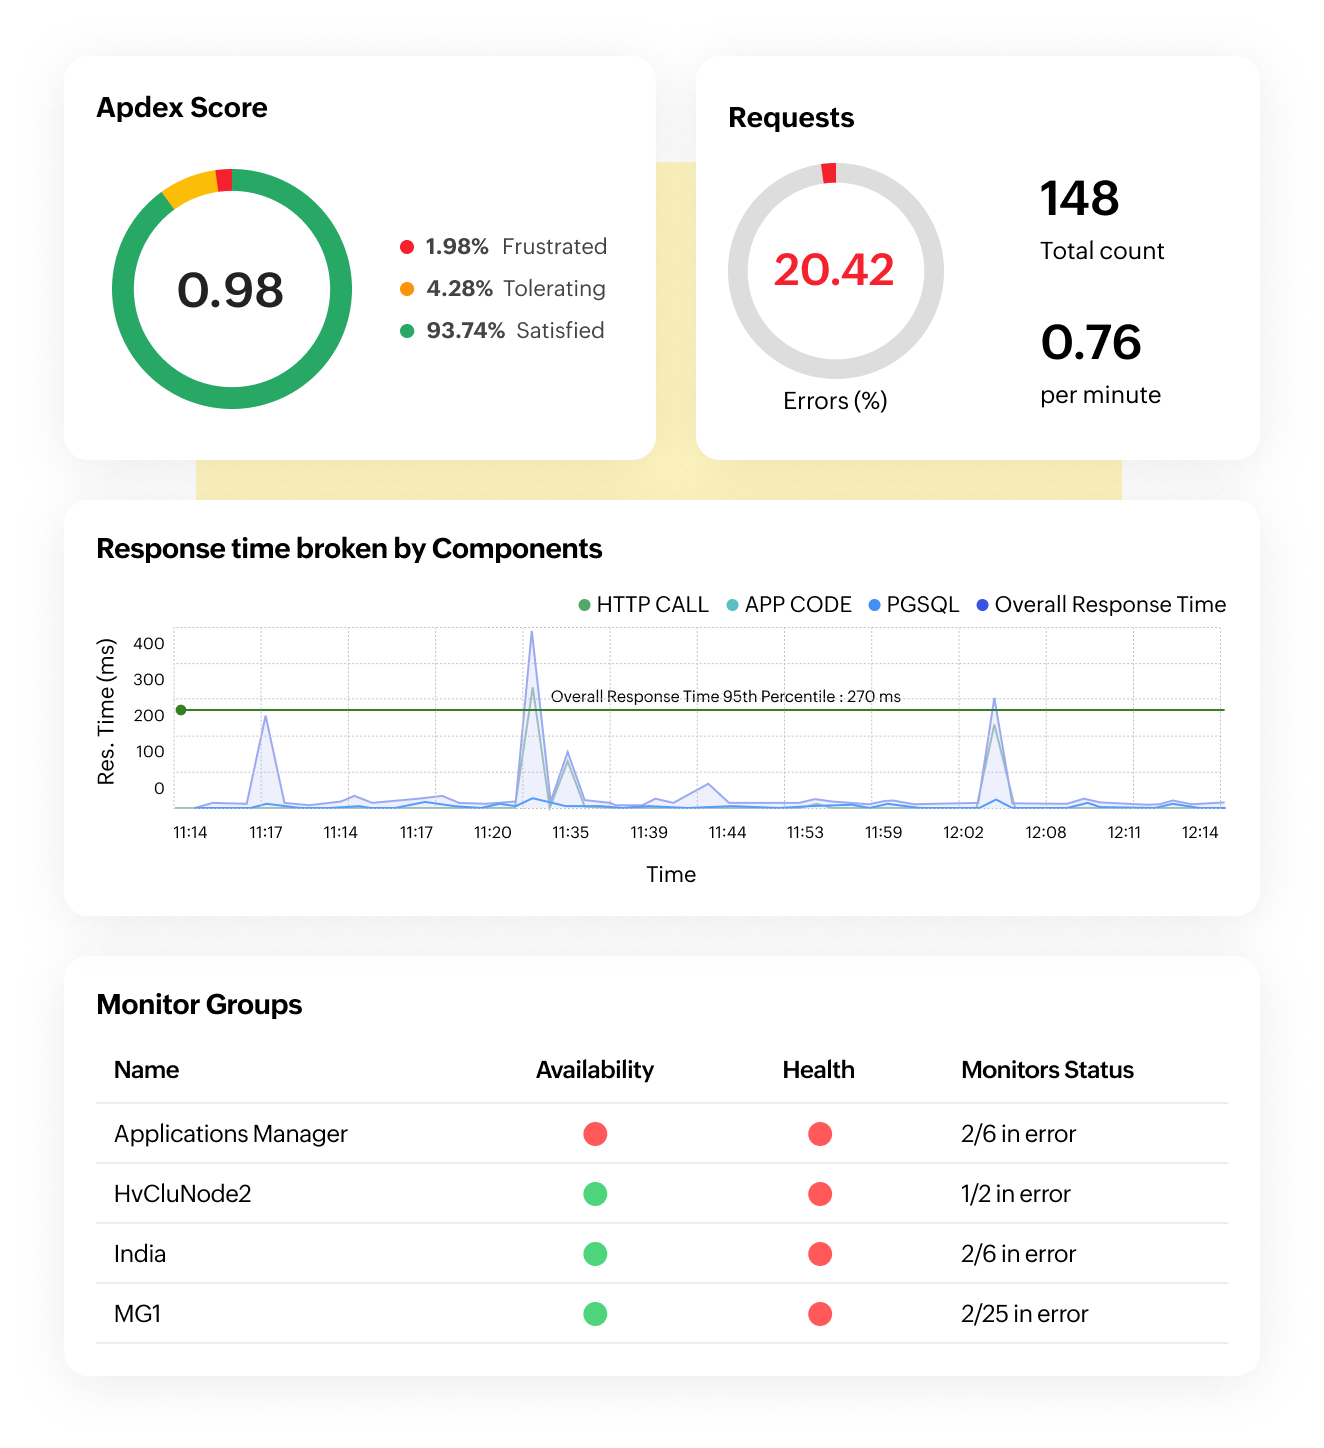
Monitor over 150 applications across your entire IT landscape to ensure seamless performance and reliability. Identify and resolve bottlenecks, optimize resource allocation, and deliver consistently exceptional user experiences. Also, eliminate visibility gaps and get unified insights across your frontend and backend components.
Key functionalities:
- Application performance monitoring: Gain code-level visibility into the performance of business critical applications across micro-services and distributed architecture.
- Infrastructure, cloud, and container monitoring: Proactively monitor your servers, databases, virtualization platforms, and cloud environments such as AWS and Azure from a single console.
- Digital experience monitoring: Measure website, application, or service performance from the end-user perspective using synthetic transactions and real user monitoring.
Network performance monitoring
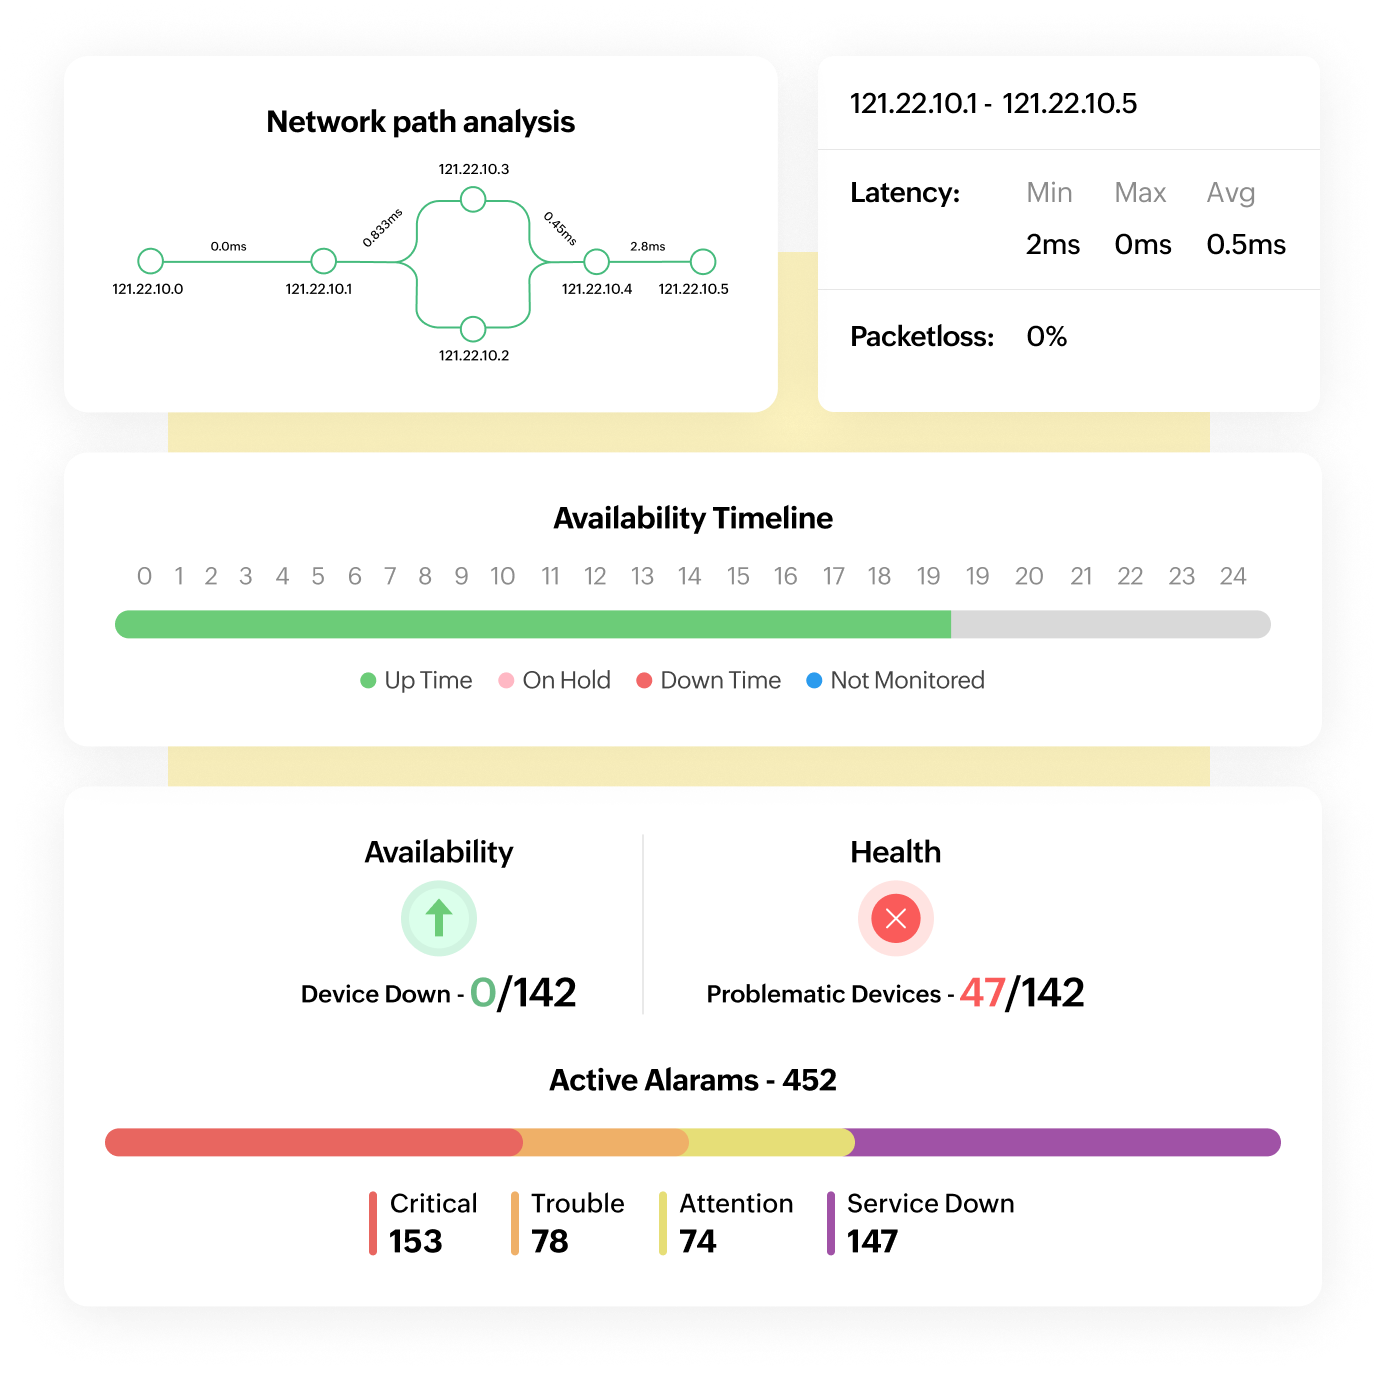
Prevent unexpected downtime and optimize network performance. Proactively identify and address network issues by monitoring the health of your IP-based devices, visualizing system performance, and analyzing network traffic, bandwidth utilization, and device performance.
Key functionalities:
- Proactive monitoring: Ensure maximum uptime with proactive monitoring for health, availability, and performance of devices. Regular pings detect issues instantly, sending immediate alerts to minimize downtime.
- Network path analysis: Monitor each network hop and set alerts for packet loss and response times to quickly address performance issues and congestion.
- Network visualization: Effortlessly visualize your networks in various formats, including Layer 2 maps, business views, VM topology, 3D rack views, and more.
Bandwidth and traffic monitoring
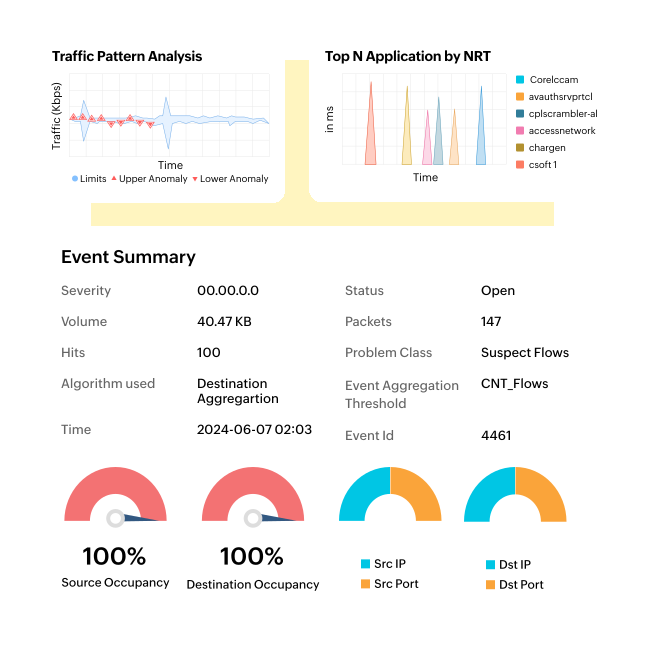
Gain real-time insights into your network traffic by viewing detailed information on your bandwidth usage. See which applications are hogging the most bandwidth, which devices are generating the most traffic, and how much traffic is being used over a specific period of time.
Key functionalities:
- Traffic monitoring: Seamlessly uncover bandwidth bottlenecks. Analyze traffic, filter data by time, and prioritize critical applications for optimal performance.
- Traffic shaping: Optimize network performance by controlling bandwidth-hungry applications and allocating bandwidth to critical ones with traffic shaping.
- Advanced forensics: Use forensic analysis to quickly troubleshoot issues by examining specific traffic patterns.
Configuration management
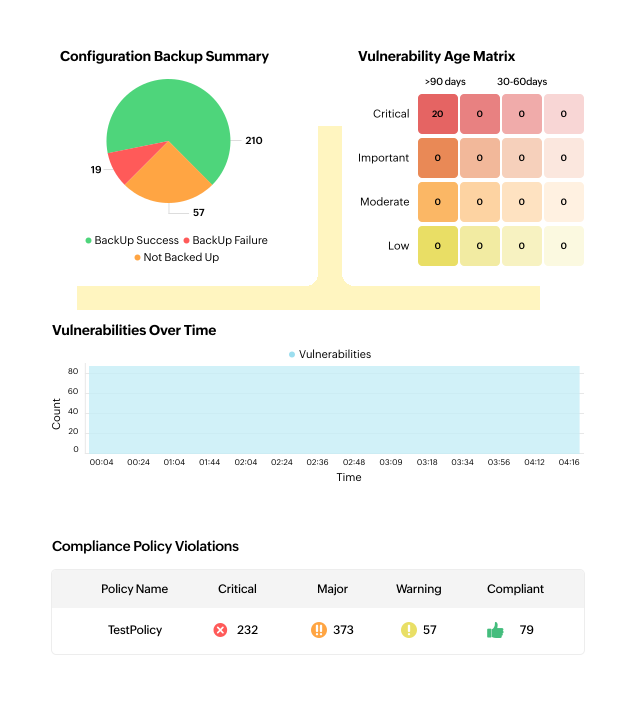
Keep a step ahead of faulty configuration changes, compliance violations, and conflicts with improved visibility into your network and enhanced control over change workflows. With real-time change management, automated backups, and robust compliance features, you can seamlessly manage the entire life cycle of device configurations.
Key functionalities:
- Automated configuration backup: Activate change detection to automatically back up and compare device configurations. If changes are detected, the new version is saved.
- Change management: Limit access with role-based control, get instant change alerts, use rollback to revert to previous versions, and compare configurations with Diff View.
- Compliance management: Ensure compliance with standards like CIS, SOX, HIPAA, and PCI DSS. Create custom policies from scratch and easily solve rule violations.
Firewall and log analysis
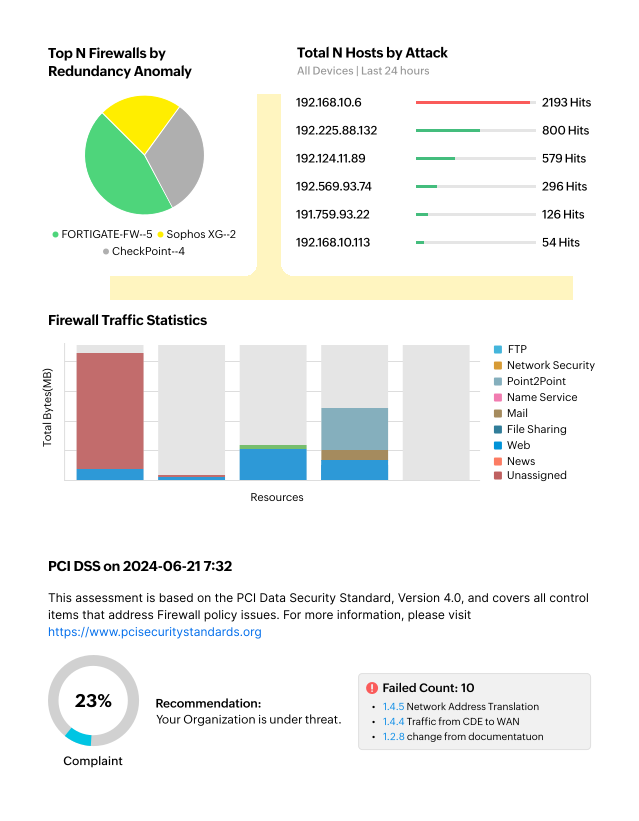
Strengthen your network's first line of defense by proactively identifying and mitigating threats. Monitor network security devices, detect suspicious traffic patterns, manage firewall policies, and conduct regular security audits to protect your network.
Key functionalities:
- Firewall policy management: Gain insights into firewall rule efficiency. Identify unused rules and optimize performance with suggested reordering recommendations.
- Firewall compliance management: Simplify compliance efforts with predesigned audit reports covering industry mandates including PCI DSS, HIPAA, GDPR, NIST, ISO, etc.
- Firewall log analysis: Protect your network by uncovering hidden threats. Conduct in-depth log analysis to visualize risks and build a robust defense strategy.
IP and switch port management
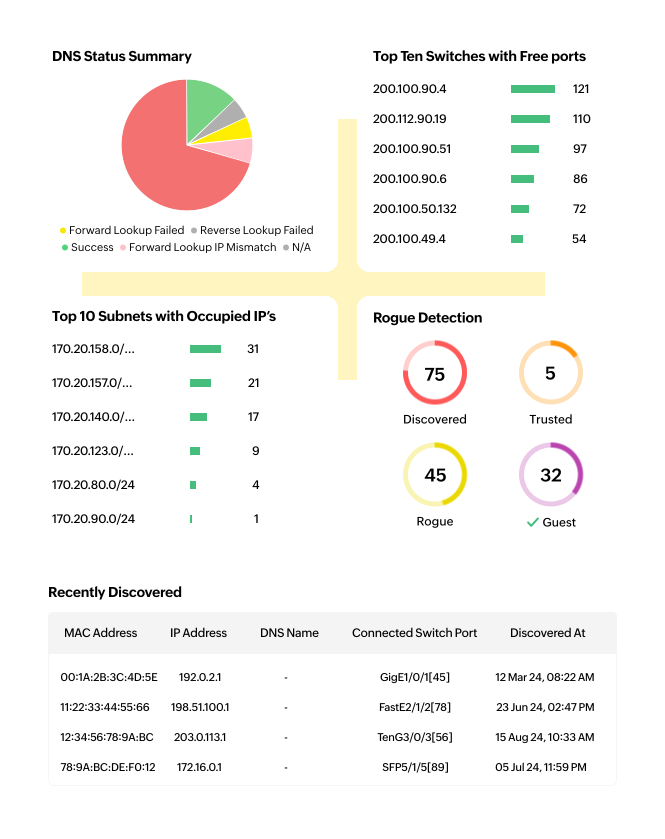
Streamline network administration with powerful IP and switch port management. Utilize our extensive toolkit to detect rogue devices, monitor bandwidth, and protect critical systems with Cisco configuration backups and more.
Key functionalities:
- IP address management: Gain full visibility into IP address usage with advanced scanning and analytics. Enhance network efficiency by syncing IPs with Active Directory.
- Switch port mapping: Accelerate troubleshooting with quick device-to-port mapping and avoid manual tracing. Get visibility into stacked switches, trunk ports, and virtual IPs.
- Rogue device detection: Gain visibility into new network devices, classifying them as trusted, rogue, or guest. Get alerts for guest access expiration.
Harness advanced AIOps features for optimal performance
Data gathering and noise reduction
Filter out irrelevant data and noise, enabling IT operations teams to focus on high-impact issues and boost efficiency.
Adaptive thresholds
Automate threshold configuration to allow network administrators to monitor various devices in dynamic environments closely.
Root cause analysis
Identify primary suspects, determine root causes, and collect essential data to resolve issues before they escalate.
Enhanced capacity planning
Utilize machine learning to accurately predict resource depletion timelines for memory, disk space, and CPU utilization.
Automated remediation
AIOps dynamically adjusts application capacity by deploying additional instances to maintain peak performance.
Automated workflow
Access 70+ pre-built workflow actions to effortlessly create custom rules tailored to your IT management needs.
Edition & Pricing
Explore the potential ROI of implementing OpManager Nexus for your business
Scale infinitely, observe deeply with enterprise edition
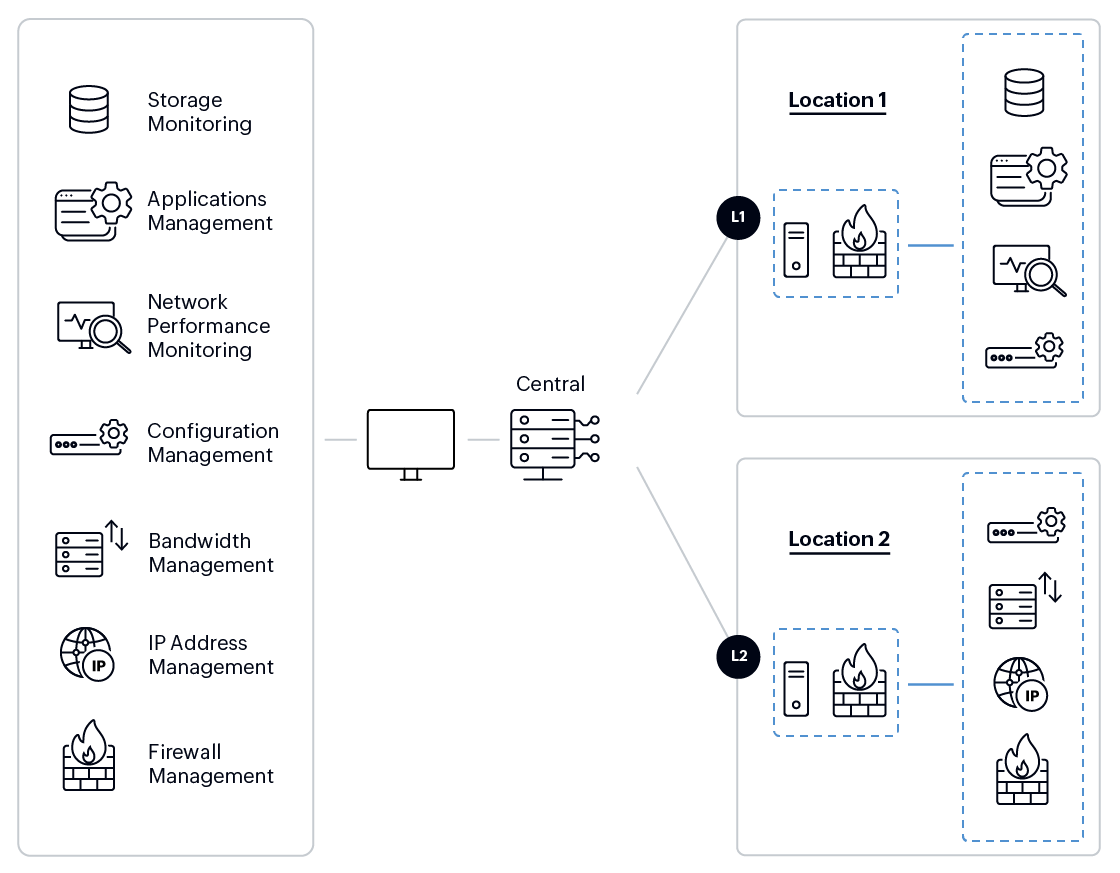
Experience the power of distributed network management with OpManager Nexus enterprise edition. Monitor and manage your entire IT infrastructure, no matter the location, through a single, unified console backed by our reliable Probe-Central architecture.
Loved by customers all over the world

“Easy Implementation, Excellent support & Lower Cost Tool - Team Lead, IT Services Industry”
Reviewer Role: Infrastructure and Operations
Company size: 500M - 1B USD
We have been using OpManager since 2011 and our overall experience has been excellent. The tool plays a vital role in providing the value to our organization and to the customers we are supporting. The support is excellent and staff takes full responsibilities in resolving the issues. Innovation is never stopping and clearly visible with newer versions.
“OpManager - 10 steps ahead of the competition, one step away from being unequaled - Network Services Manager, Government Organization”
Reviewer Role: Infrastructure and Operations
Company size: 5,000 - 50,000 Employees
I have a long standing relationship with ManageEngine. OpManager has always missed one or two features that would make it truly the best tool on the market, but over it is the most comprehensive and easy to use the product on the market.
“Easy Implementation with a feature rich catalogue, support has some room for improvement - NOC Manager, IT Services Industry”
Reviewer Role: Program and Portfolio Management
Company size: 500M - 1B USD
The vendor has been supportive during the implementation & POC phases providing trial licenses. Feature requests and feedbacks is usually acted upon swiftly. There was sufficient vendor support during the implementation phase. After deployment, the support is more than adequate, where the vendor could make some improvements.
“Great Monitoring tool - CIO in Finance Industry”
Reviewer Role: CIO
Company size: 1B - 3B USD
ManageEngine provides a suite of tools that have made improvements to the availability of our internal applications. From monitoring, management and alerting, we have been able to peak performance within our data center.
“Simple Implementation, Easy To Use. Very Intuitive. - Principle Engineer in IT Services”
Reviewer Role: Enterprise Architecture and Technology Innovation
Company size: 250M - 500M USD
ManageEngine support was responsive to all our queries.




“OpManager helps me monitor all aspects of the data-center and equipment like servers, switches and routers. It is fast, intuitive and centralized and you do not need to be an expert to deal with OpManager.”
Altaleb Alshenqiti
NGHA

“Donald Stewart, IT Manager of Crest Industries is happy with ManageEngine OpManager for its end-to-end network monitoring software. It is easy-to-use and offers fault and performance management for router.”
Donald Stewart
IT Manager, Crest Industries

“John Rosser, MIS Manager of Yale Chase talks about the proactive nature of ManageEngine OpManager & how his organisation gained value from it.”
John Rosser
MIS Manager