Managing VMware Alerts
OpManager's dynamic alerting and threshold capabilities are central to a proactive monitoring approach. OpManager seamlessly fetches events from each vCenter/ESX Host, similar to SNMP traps. Currently, a list of important events is supported, and this list is updated every release. Apart from these events, OpManager also monitors threshold for critical performance indicators and raises alerts.
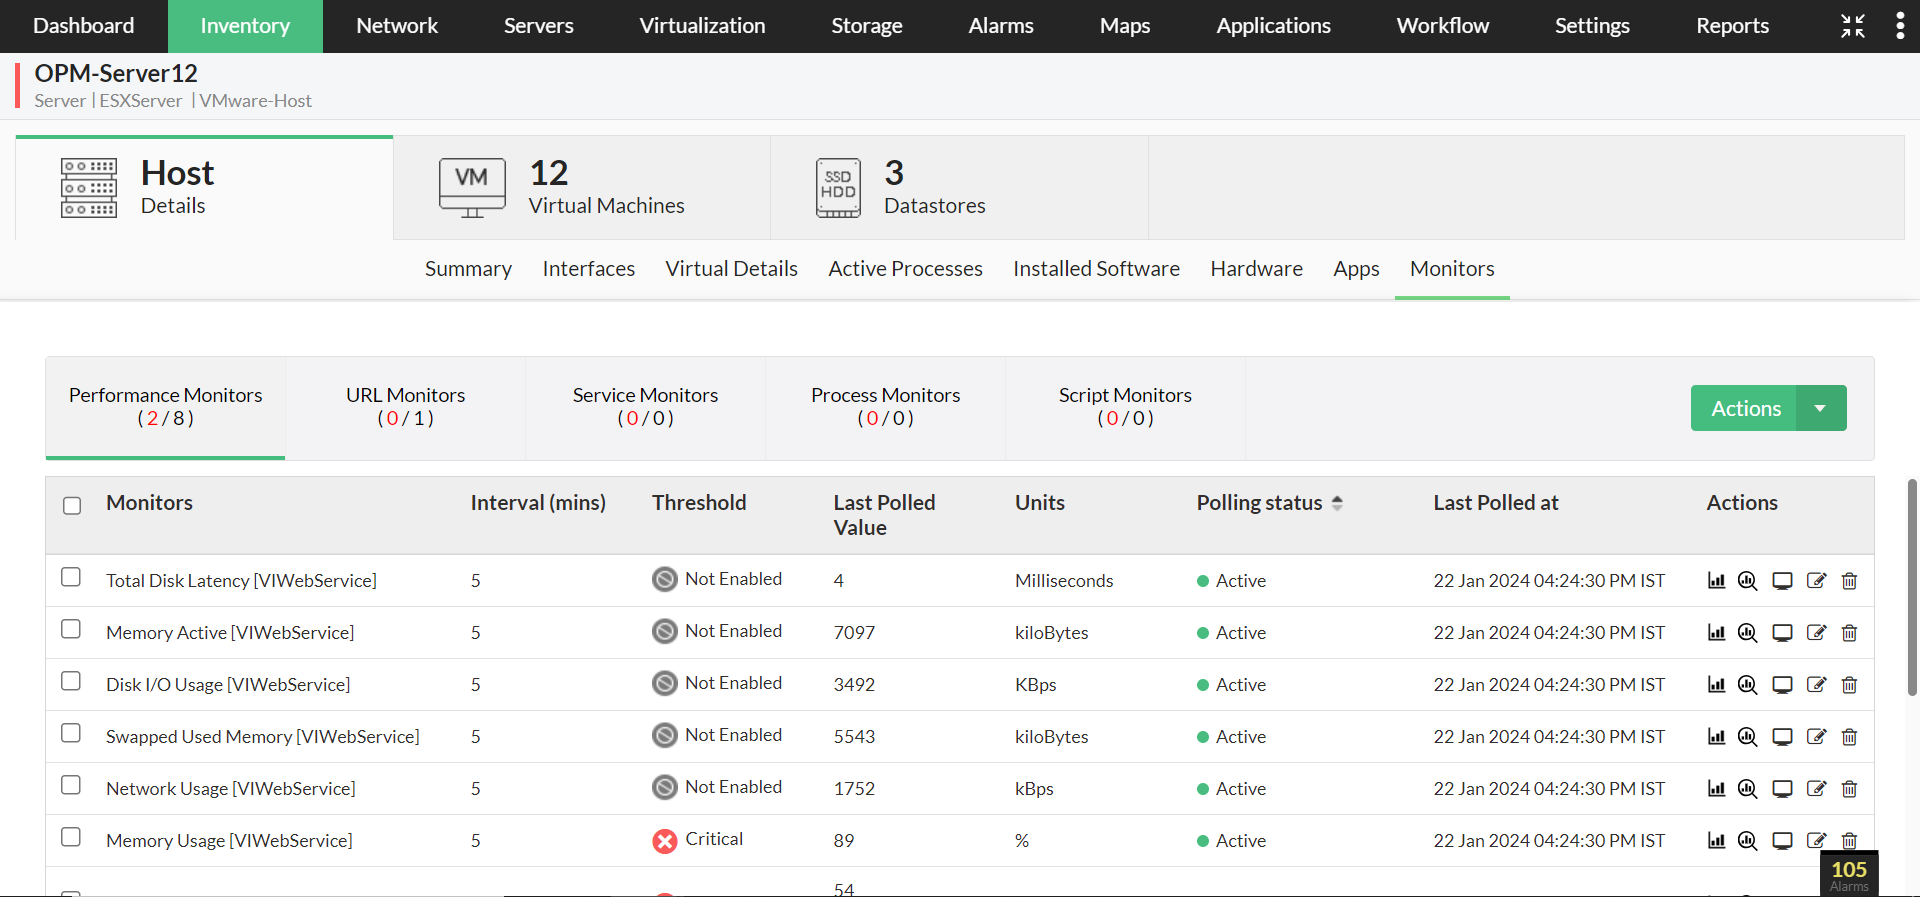
To tailor this system to your requirements, and change the pre-set threshold values for each performance monitor, go to the Monitors section under the snapshot page of the host / VM / Datastore.
To view the complete list of VMware monitors,
- To view the complete list of VMware monitors, navigate to Settings → Performance Monitors and apply a filter using the ‘VIWebService’ protocol.
- Under the Performance Monitors tab, click on 'Actions' and then on 'Add Performance Monitor'. This will display a list of all performance monitors available in OpManager.
- To view the list of Performance monitors for VMware hosts@nbsp;alone, navigate to the VMware-Host Monitors section.
- To view the list of Performance monitors for VMs, navigate to the VMware - VM snapshot page- Monitors tab - VM Monitors section.
- To view the list of Performance monitors for Datastore, navigate to the VMware - Datastore snapshot page - Monitors tab - Datastore Monitors section.
- You can also view and add the performance monitors for hosts/VMs by clicking on 'Add Monitors' under their corresponding Device Templates.
Table 1: List of few Threshold Monitors for critical performance indicators related to host, datastore & VM's supported by OpManager
| S.No. | Threshold Monitors | Virtual Device Type | Resource |
|---|---|---|---|
| 1. | Host Network Received Packets | Host | Network |
| 2. | Host Network Transmitted Packets | Host | Network |
| 3. | Host Network Usage (avg) | Host | Network |
| 4. | Host CPU Utilization (avg) | Host | CPU |
| 5. | Host Memory Utilization (avg) | Host | Memory |
| 6. | Host Disk Read Latency | Host | Disk |
| 7. | Host Disk Write Latency | Host | Disk |
| 8. | Datastore Freespace | Host | Network |
| 9. | VirtualMachine Network Packets Received | VM | Network |
| 10. | VirtualMachine Network Packets Transmitted | VM | Network |
| 11. | VirtualMachine Network Usage (avg) | VM | Network |
| 12. | VirtualMachine CPU Utilization (avg) | VM | CPU |
| 13. | VirtualMachine Memory Usage (avg) | VM | Memory |
Table 2:@nbsp;Few of the@nbsp;VCenter / ESX hosts' Events supported by OpManager
| S.No. | Events | Virtual Device Type | Severity |
|---|---|---|---|
| 1. | VmFailedToPowerOffEvent | VM | Critical |
| 2. | VmPoweredOffEvent | VM | Attention |
| 3. | VmPowerOffOnIsolationEvent | VM | Clear |
| 4. | VmFailedToPowerOnEvent | VM | Critical |
| 5. | VmPoweredOnEvent | VM | Attention |
| 6. | VmFailedToSuspendEvent | VM | Critical |
| 7. | VmSuspendedEvent | VM | Attention |
| 8. | VmFailedToRebootGuestEvent | VM | Critical |
| 9. | VmGuestRebootEvent | VM | Clear |
| 10. | VmFailoverFailed | VM | Trouble |
| 11 | VmPrimaryFailoverEvent | VM | Critical |
| 12. | VmUpgradeFailedEvent | VM | Critical |
| 13. | VmUpgradeCompleteEvent | VM | Clear |
| 14. | VmDisconnectedEvent | VM | Attention |
| 15. | VmConnectedEvent | VM | Attention |
| 16. | VmDiskFailedEvent | VM | Critical |
| 17. | VmRelocatedEvent | VM | Attention |
| 18. | VmRelocateFailedEvent | VM | Critical |
You can view the complete list of ESX host/vCenter Events that are supported by OpManager, under Settings → Monitors → VMware Events.
Note:OpManager only triggers alarms based on VMware events, and they have to be manually cleared once the issue/notification has been taken care of.
In addition to this, you can also enable Physical NIC/Host Bus Adapter based alerts in OpManager for your VMware parent devices. These alerts can be enabled during discovery of that parent device or from the Update Inventory page, by enabling the "Raise alerts for Physical NIC & Host Bus Adapter" option. These are the available status messages in OpManager and their NIC/HBA equivalents:
Physical NIC status messages:
| S.No | OpManager status message | Corresponding NIC status |
|---|---|---|
| 1 | Clear | Connected |
| 2 | Critical | Disconnected |
Host Bus Adapter status messages:
| S.No | OpManager status message | Corresponding HBA status |
|---|---|---|
| 1 | Clear | Online |
| 2 | Attention | Unbound (or) Offline |
| 3 | Trouble | Fault |
To gain in-depth insights into OpManager's VMware monitoring practices, explore the following help documents.