Security dashboard
Last updated on:
In this page
Overview
The Security Analytics Dashboard offers a unified view of your organization's threat landscape, turning detection data into actionable insights. Key elements of this dashboard:
- Visual representation of high-level metrics
- MITRE ATT&CK mapping
- Historical trends
With compact widgets for quick decision-making and expanded views for deep investigations, the dashboard helps monitor evolving threats, uncover patterns, and streamline incident response with precision.
Security tab in the dashboard
- In the product console, click on the Security tab in the dashboard as highlighted below.
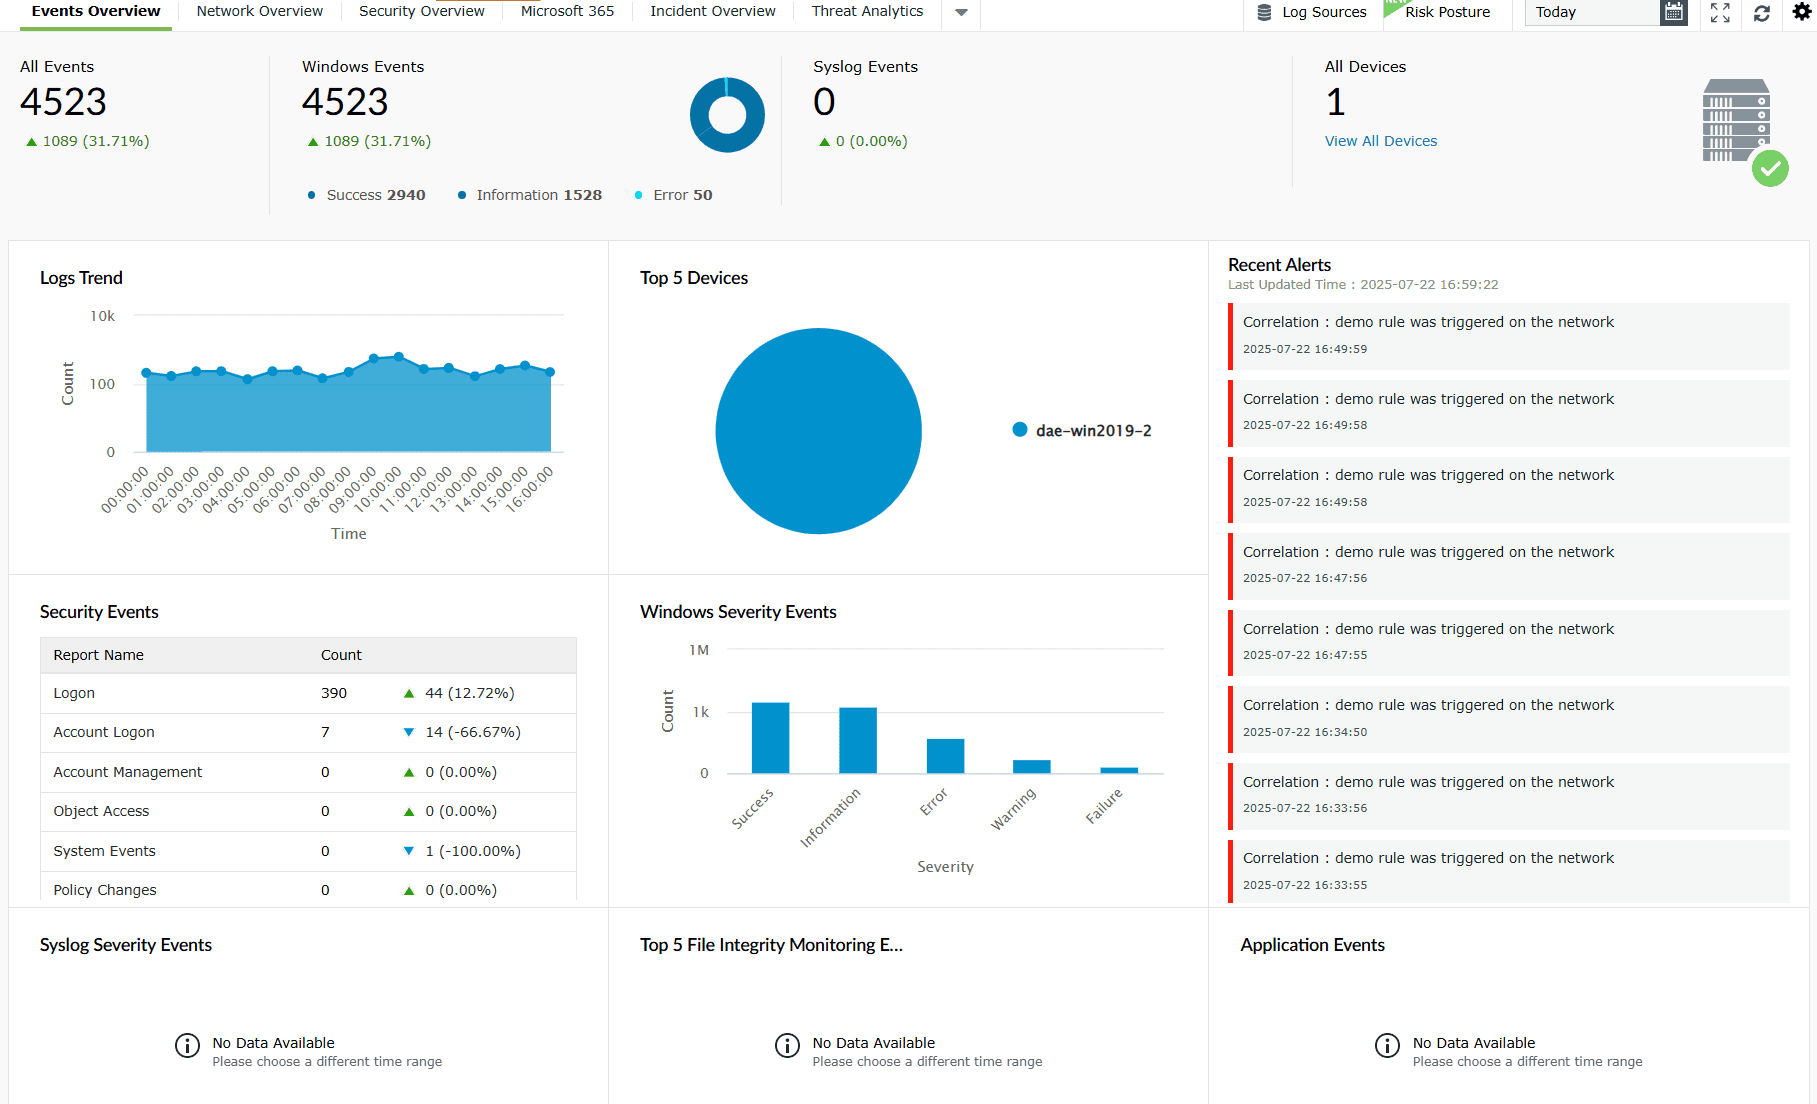
Image 1: Security tab in the dashboard - You will be taken to the Security Analytics dashboard.
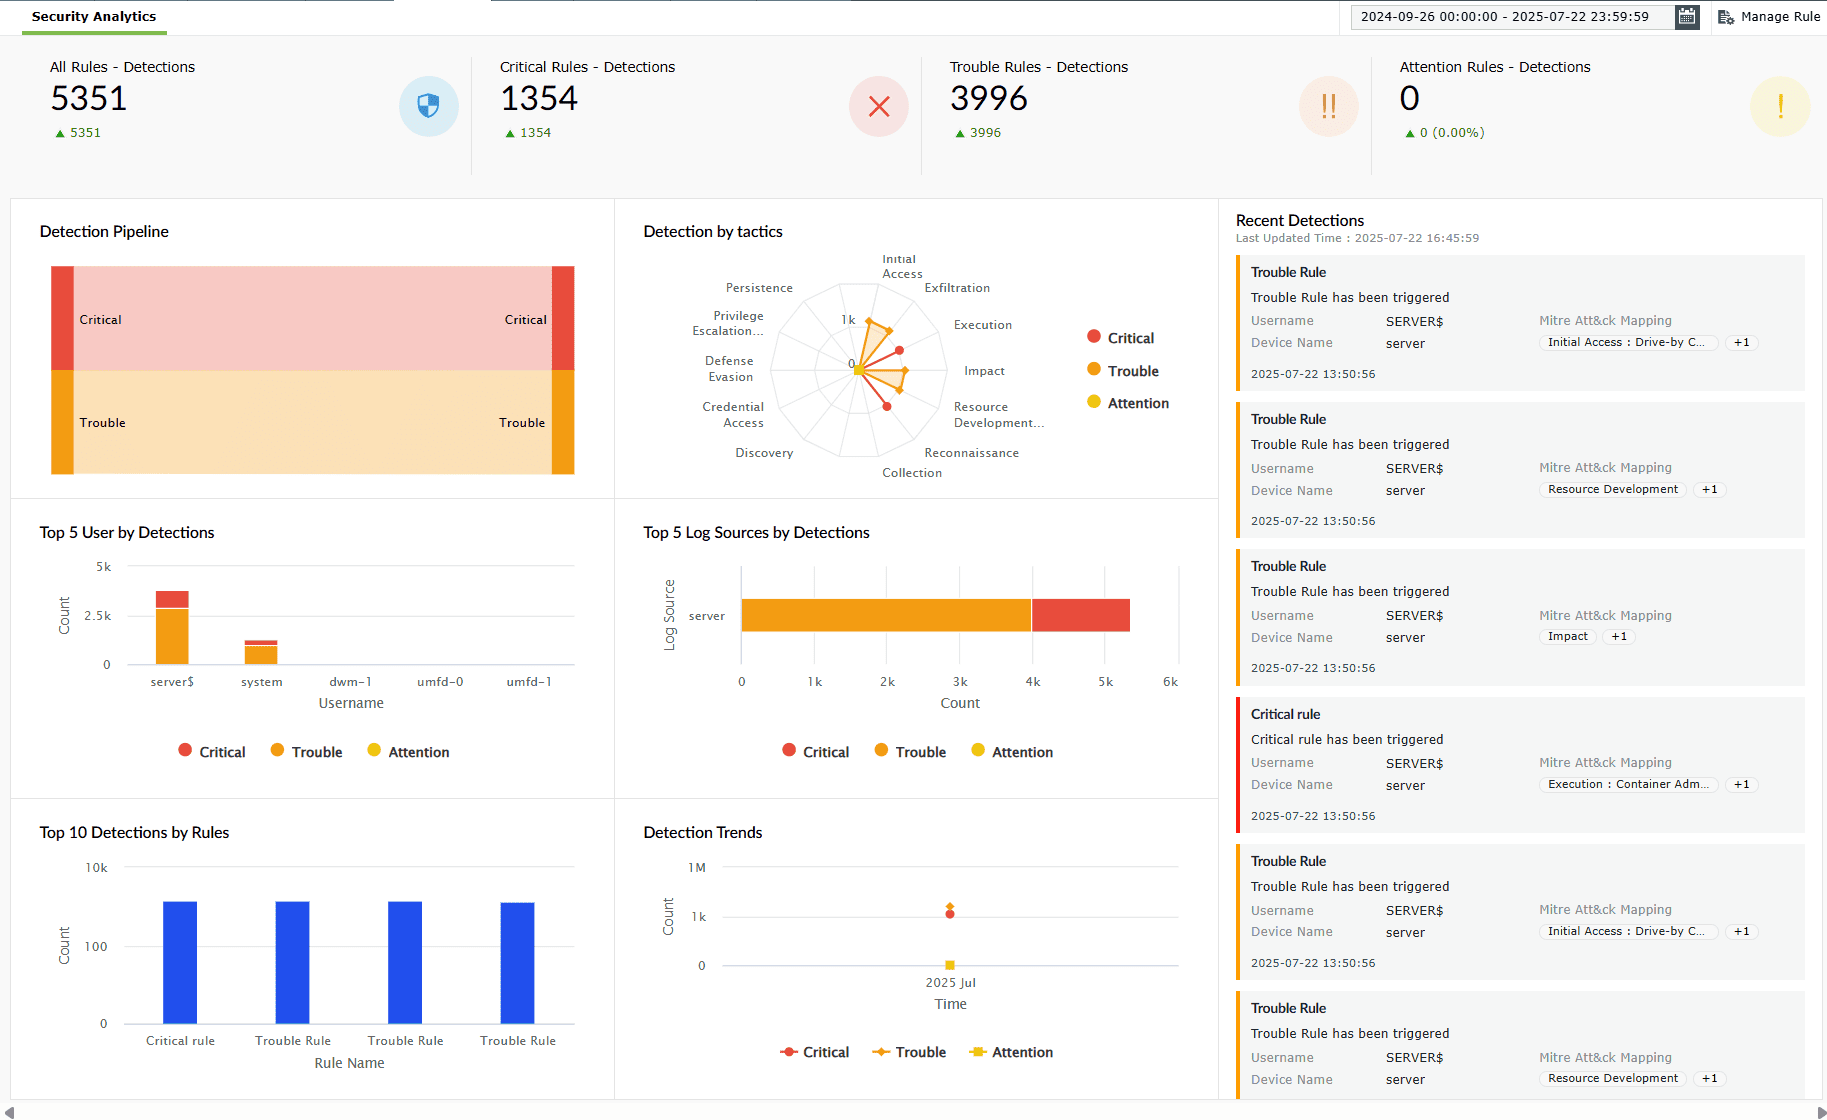
Image 2: Security analytics dashboard
Read further to understand the role of each widget in this tab and how it contributes to your network's security analytics.
- To make the best use of this dashboard make sure that the rules for the detection are active and properly configured since this dashboard provides data and insights based on the currently active rules and their unique configurations.
- For users operating on builds prior to the PPM update, detection data generated before this update will continue to be shown under Detection Reports. Detections post the PPM update will be shown in the Security Dashboard.
Security Analytics- A breakdown of the dashboard
Data in precise numbers
The four compact elements in the top-most ribbon of the Security Analytics dashboard offer a high-level snapshot of detection activities across all three severity levels with accurate numbers, providing quick visibility into the total number of detections classified based on their distribution in severity levels of the rules as follows:
- All Rules - Detections
- Critical Rules - Detections
- Trouble Rules - Detections
- Attention Rules - Detections
These shall assist the security teams instantly gauge the overall threat landscape, prioritize the incident response efforts, and also monitor trends in the detection volumes over time.
A. Compact views
1. All Rules - Detections
This component provides the total count of all the detections made across every configured rule, offering a quick overview of your organization's threat landscape.
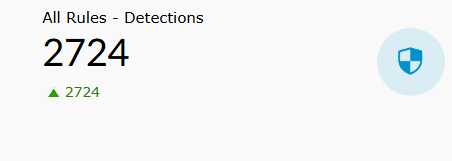
Details displayed
- Detection count: Total number of triggered detections across all rules.
- Growth/decline indicator: A green arrow highlights the decrease in detection counts, whereas a red one indicates an increase.
Role in Security Analytics
- Acts as the primary metric for overall threat volume.
- Helps track total security events within a given time frame.
- Serves as a baseline for comparing the distribution of critical and trouble detections.
2. Critical Rules - Detections
This component focuses on detections triggered by high-severity (critical) rules that require immediate attention.
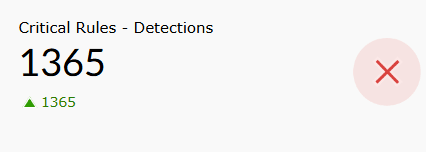
Details displayed
- Detection count: Total number of critical detections.
- Visual indicator: A red icon emphasizes the high-priority nature of these events.
- Growth/decline trend: Green arrow indicates a decrease in detection volume, whereas a red one indicates an increase.
Role in Security Analytics
- Highlights security events with the highest risk and urgency.
- Helps prioritize immediate incident response actions.
- Serves as a key metric for assessing serious vulnerabilities or ongoing attacks.
3. Trouble Rules - Detections
This component displays the count of detections flagged by medium-severity (trouble) rules, representing potential risks or suspicious activities.
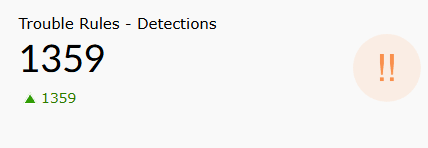
Details displayed
- Detection count: Total number of trouble-level detections.
- Visual indicator: Orange icon signals events that need closer monitoring.
- Growth/decline trend: Green arrow indicates changes in detection volume, whereas a red one indicates a decline.
Role in Security Analytics
- Helps monitor and investigate potential threats before they escalate.
- Provides visibility into less urgent but still relevant anomalies.
- Assists in tuning detection rules for medium-risk scenarios.
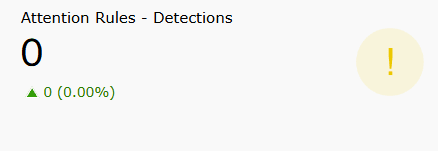
4. Attention Rules - Detections
This component tracks detections triggered by low-severity (attention) rules, indicating minor anomalies or early warning signs.
Details displayed
- Detection count: Total number of attention-level detections.
- Visual indicator: Yellow icon signifies a lower risk level.
- Growth/decline trend: Green arrow indicates changes in detection volume, whereas a red one indicates a decline.
Role in Security Analytics
- Offers context for early detection of unusual behavior.
- Helps identify non-critical patterns that could develop into threats.
- Complements higher-severity detections by providing a broader security overview.
B. Expanded view of all four components
While the compact displays offer quick yet effective insights, clicking on the displayed count of any of these four components provides an expanded view of the same, which includes added details and context surrounding these detections.
Upon clicking on the total count displayed in the compact view of any of the components, the expanded view appears with data arranged in an array of columns as shown above.
Available actions
- Clicking on the Export as
 button allows you to choose a format to export the said data either in a PDF format or a CSV file.
 - Clicking on the Report export history
 icon allows you to view the complete history of the past data exports that have taken place for that particular report.
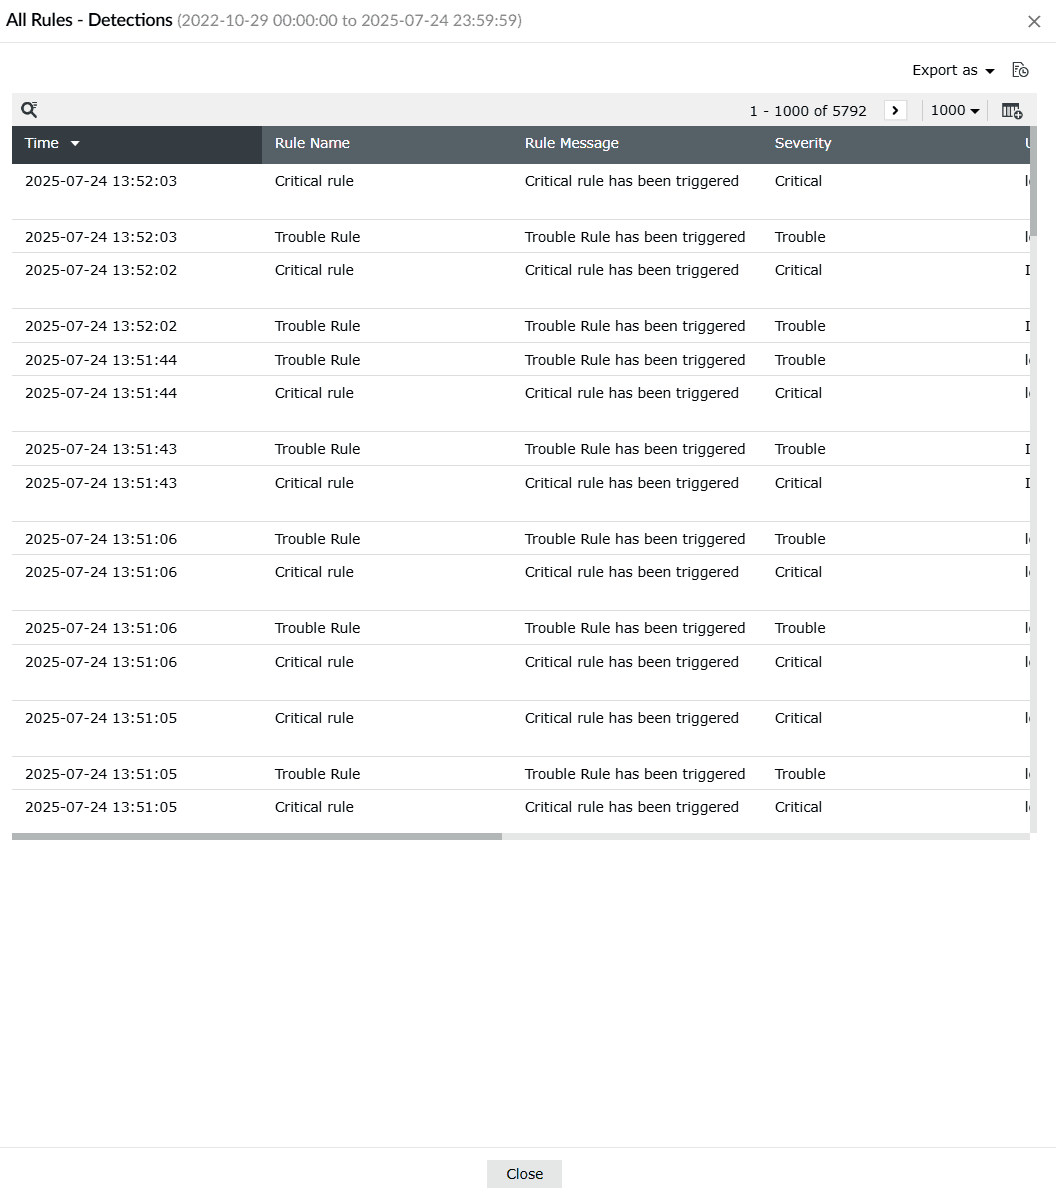
Image 3: All rules detections in security analytics dashboard - Clicking on the
 icon on the top-right corner of the data table allows you to select/deselect and Apply what data you wish to view separated by columns.
Details displayed (list of available columns)
- Time: Timestamp for when the rule was triggered.
- Rule Name: Detected rules categorized by their severity level- Critical, Trouble, or Attention.
- Rule Message: A brief descriptive message about the triggered detection.
- Severity: Indicates the severity of the rule detected.
- Username: The account responsible for the activity.
- Log Source: Source system or device associated with the detected activity.
- MITRE ATT&CK Mapping: Tactic and technique classification aligned with the MITRE ATT&CK framework.
- Tags: Additional contextual tags, such as industry verticals.
Role in Security Analytics
- Enables deep investigation of every triggered rule by showing when and where it occurred.
- Assists in prioritizing response based on severity, helping SOC teams act swiftly on critical alerts.
- Maps suspicious activities to known threat tactics (via MITRE ATT&CK) for quicker threat attribution and analysis.
- Enhances visibility into user behavior, log source reliability, and attack patterns.
- Supports fine-tuning of rules by providing granular, real-time feedback on their effectiveness and noise levels.
Read also
This page explained the security dashboard's purpose, how to access it, and the role of its widgets. You also learned how compact and expanded views help track detections by severity, uncover patterns, and prioritize response.