View Log Alerts
Last updated on:
In this page
Overview
This page outlines how to view and work with log alerts generated in the product. From the Alerts module, you can monitor triggered alerts, review their severity and status, drill down into the alert context, configure views, and perform follow-up actions such as exporting alerts, whitelisting, or launching associated playbooks. The module also provides integrations for external ticketing systems and supports real-time filtering to tailor the alert list based on alert criteria and operational needs.
Alerts
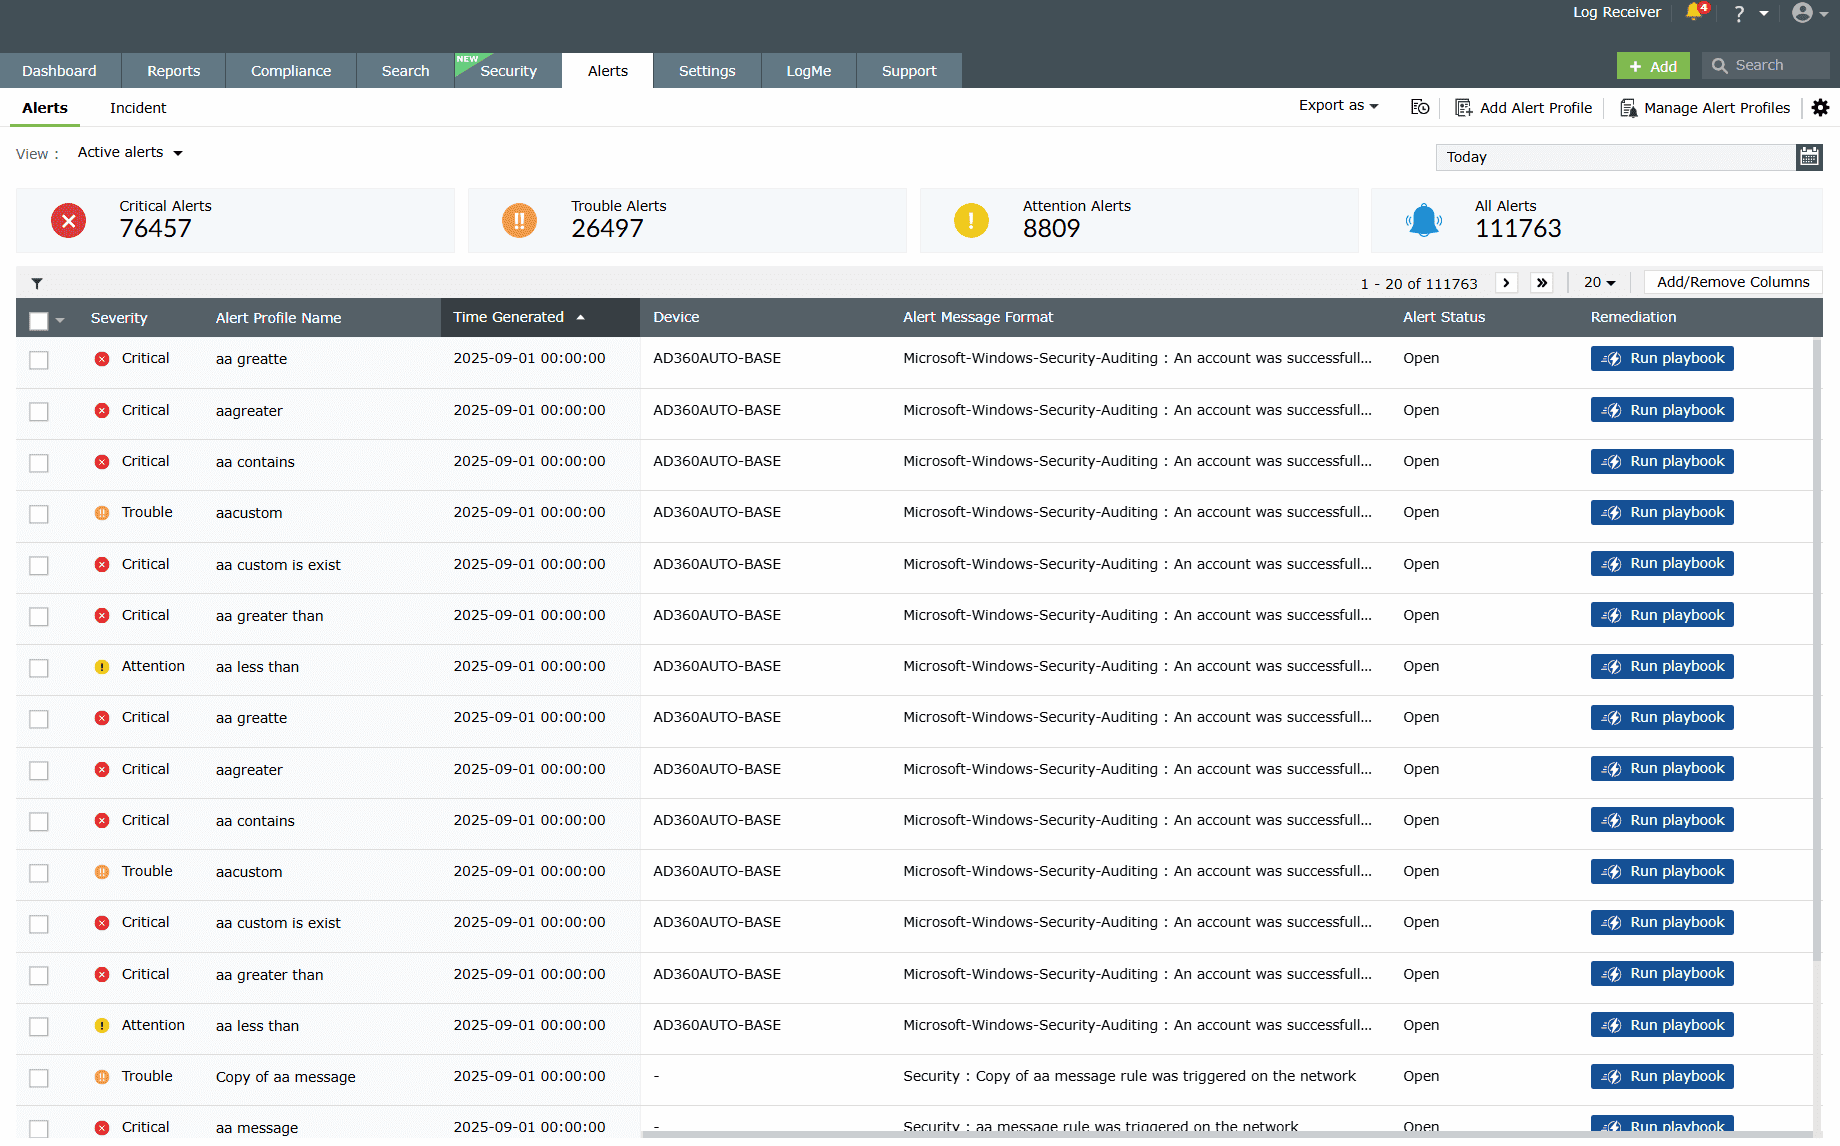
The Alerts tab lists details of all alerts triggered (if you have not set up any alert profiles, the tab directs you to do so). You can view the timestamp of the alert, the device which triggered it, the severity, the status of the alert, and the message.
Filtering alerts
- Click on the filter icon at the top-left corner of the table.
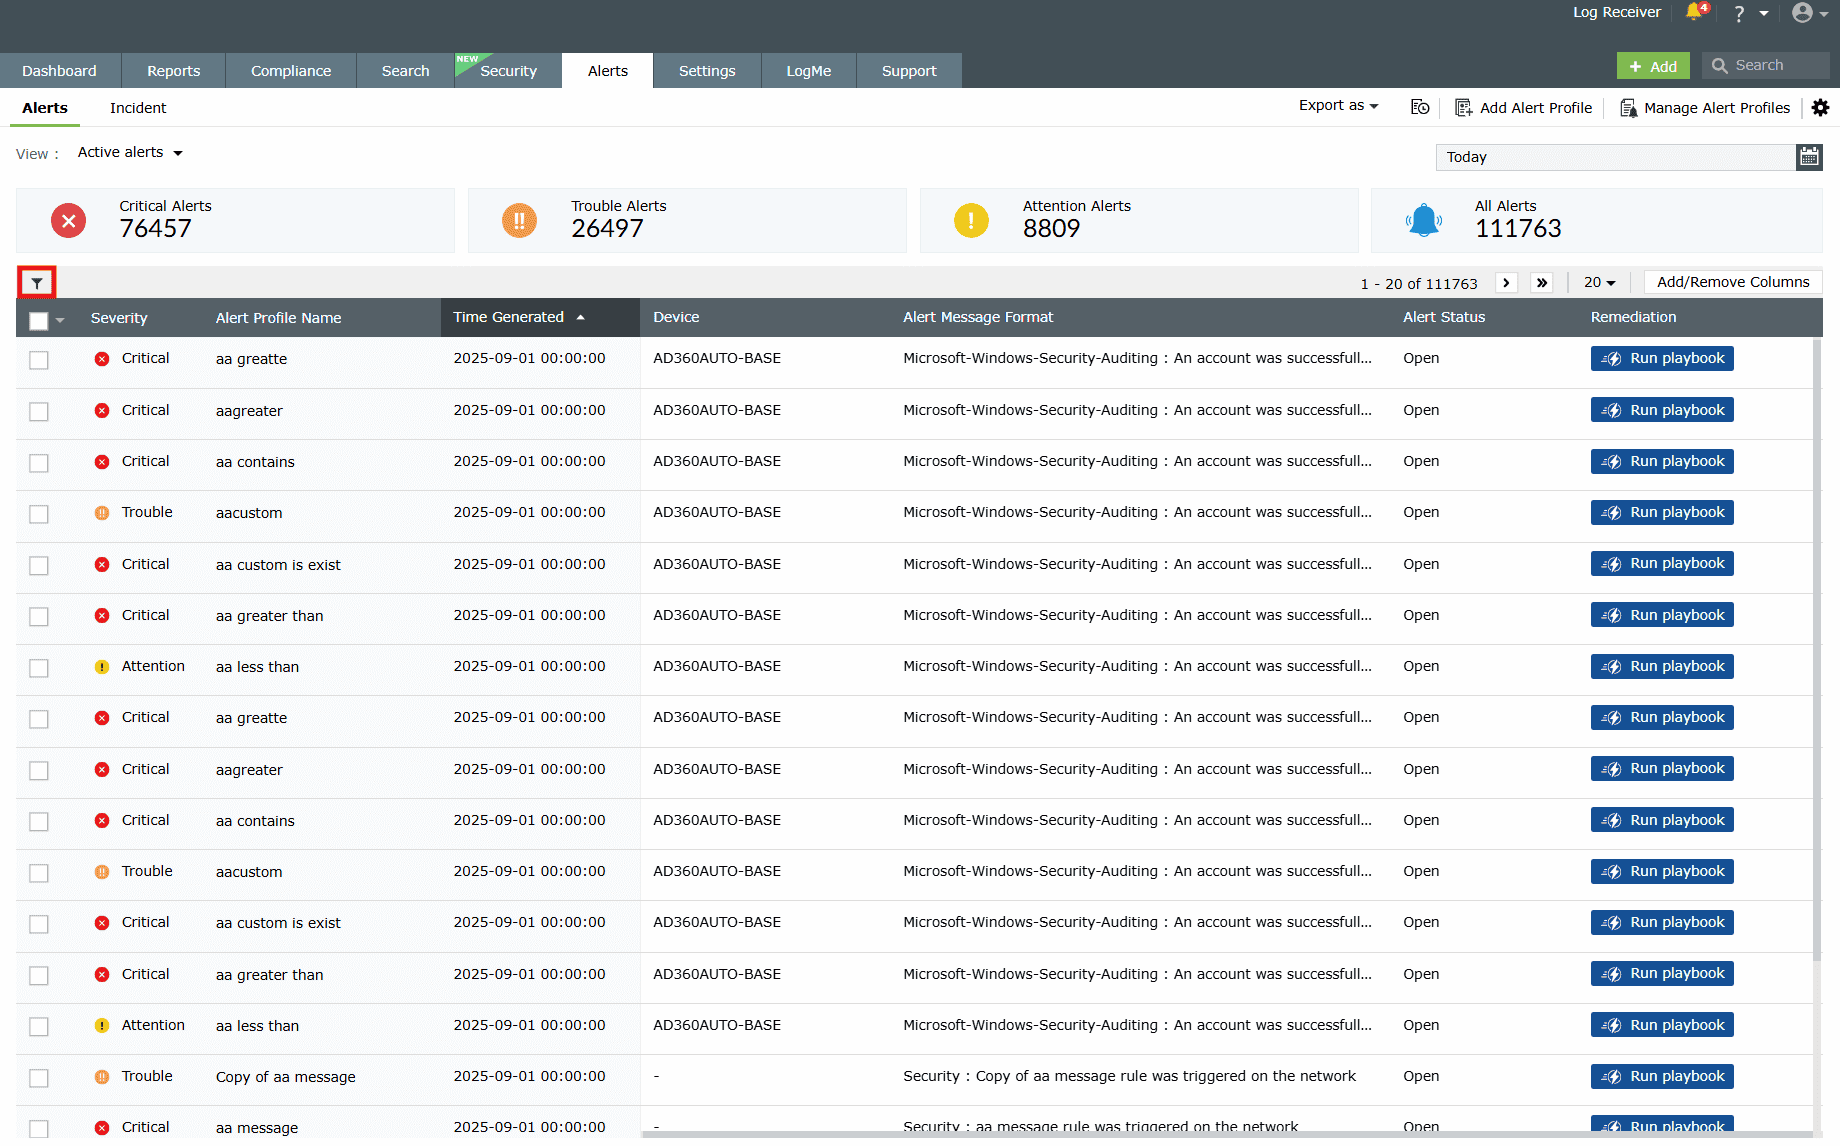
Image 2: Filter option in the alerts module - The Filter Alerts pop-up opens. Here, you can select the appropriate filter options based on the various Alert Parameters and Alert Criteria-Based fields available.
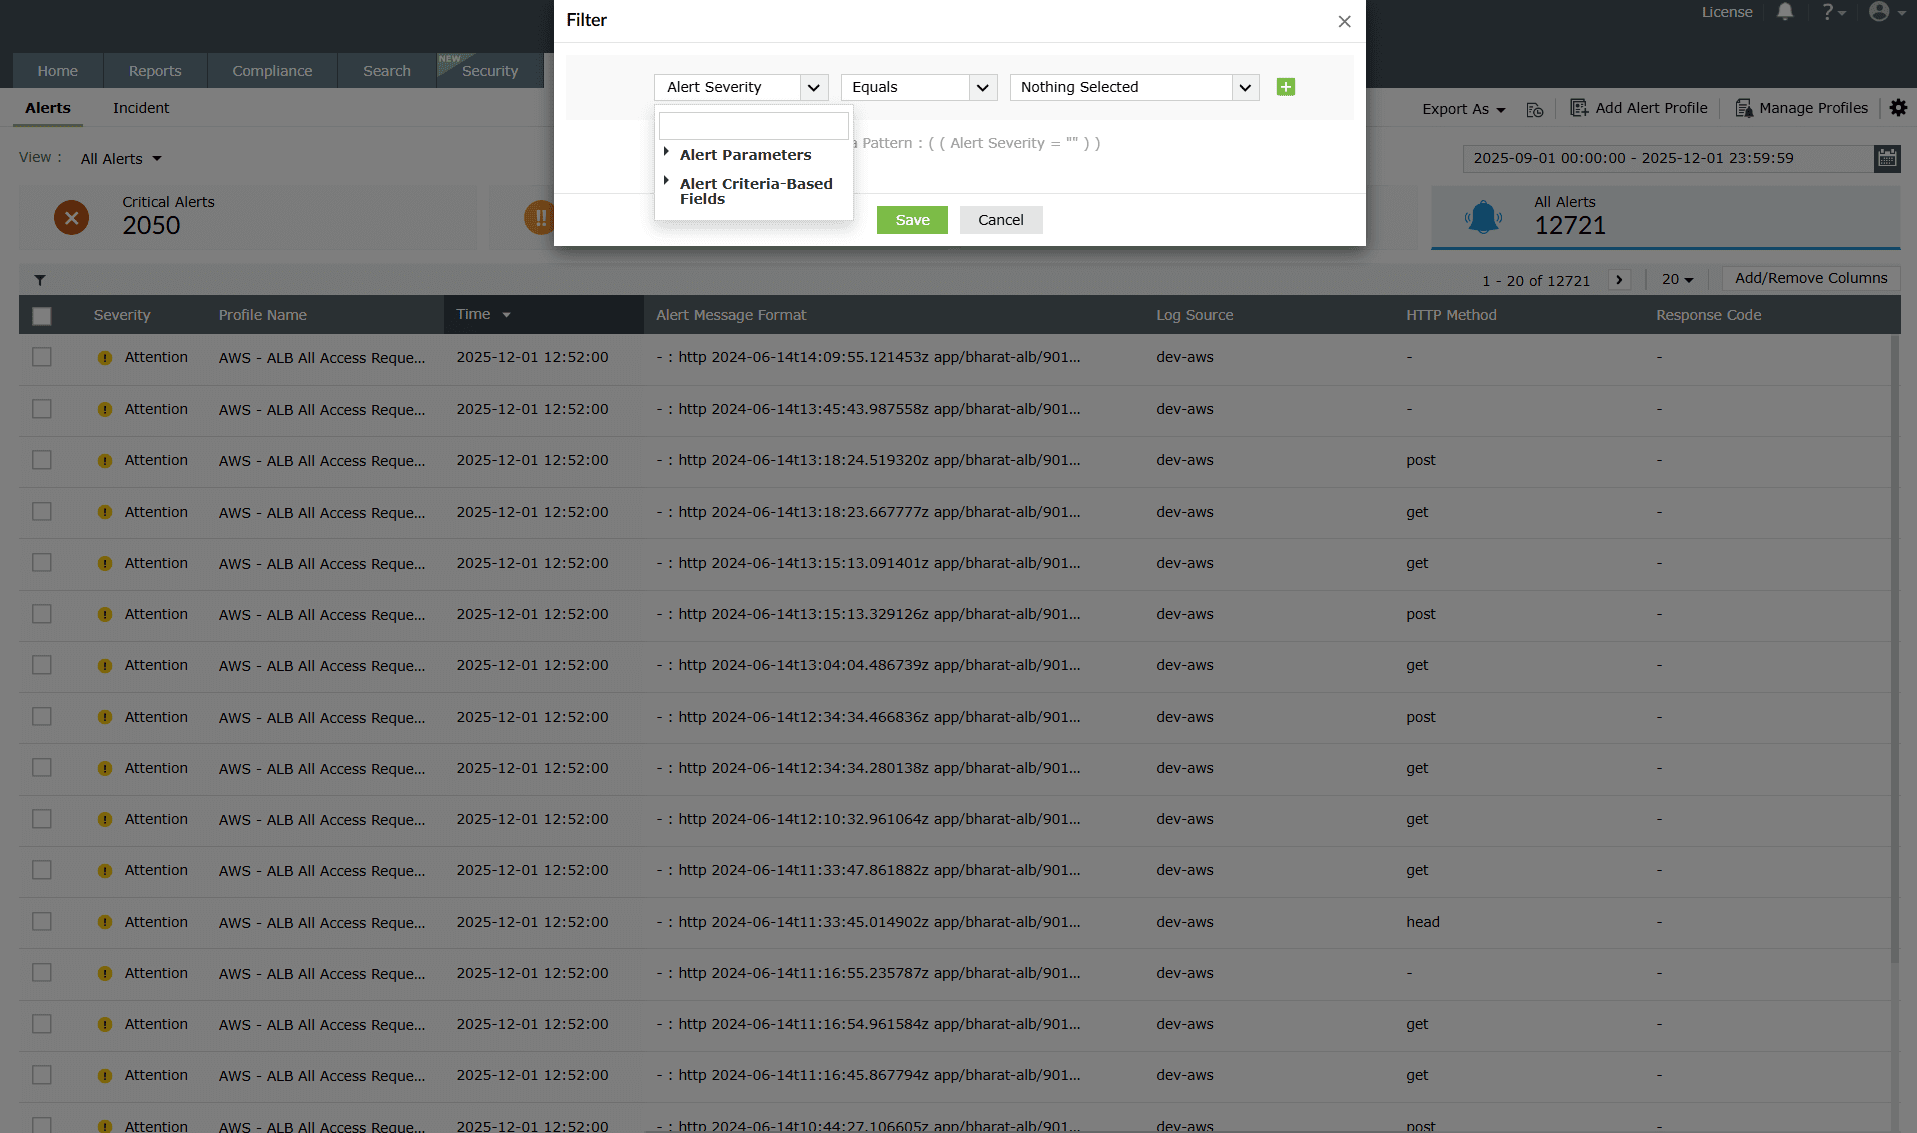
Image 3: Filtering alerts based on alert parameters and criteria - You can also select one or more filter options to customize your alerts view.
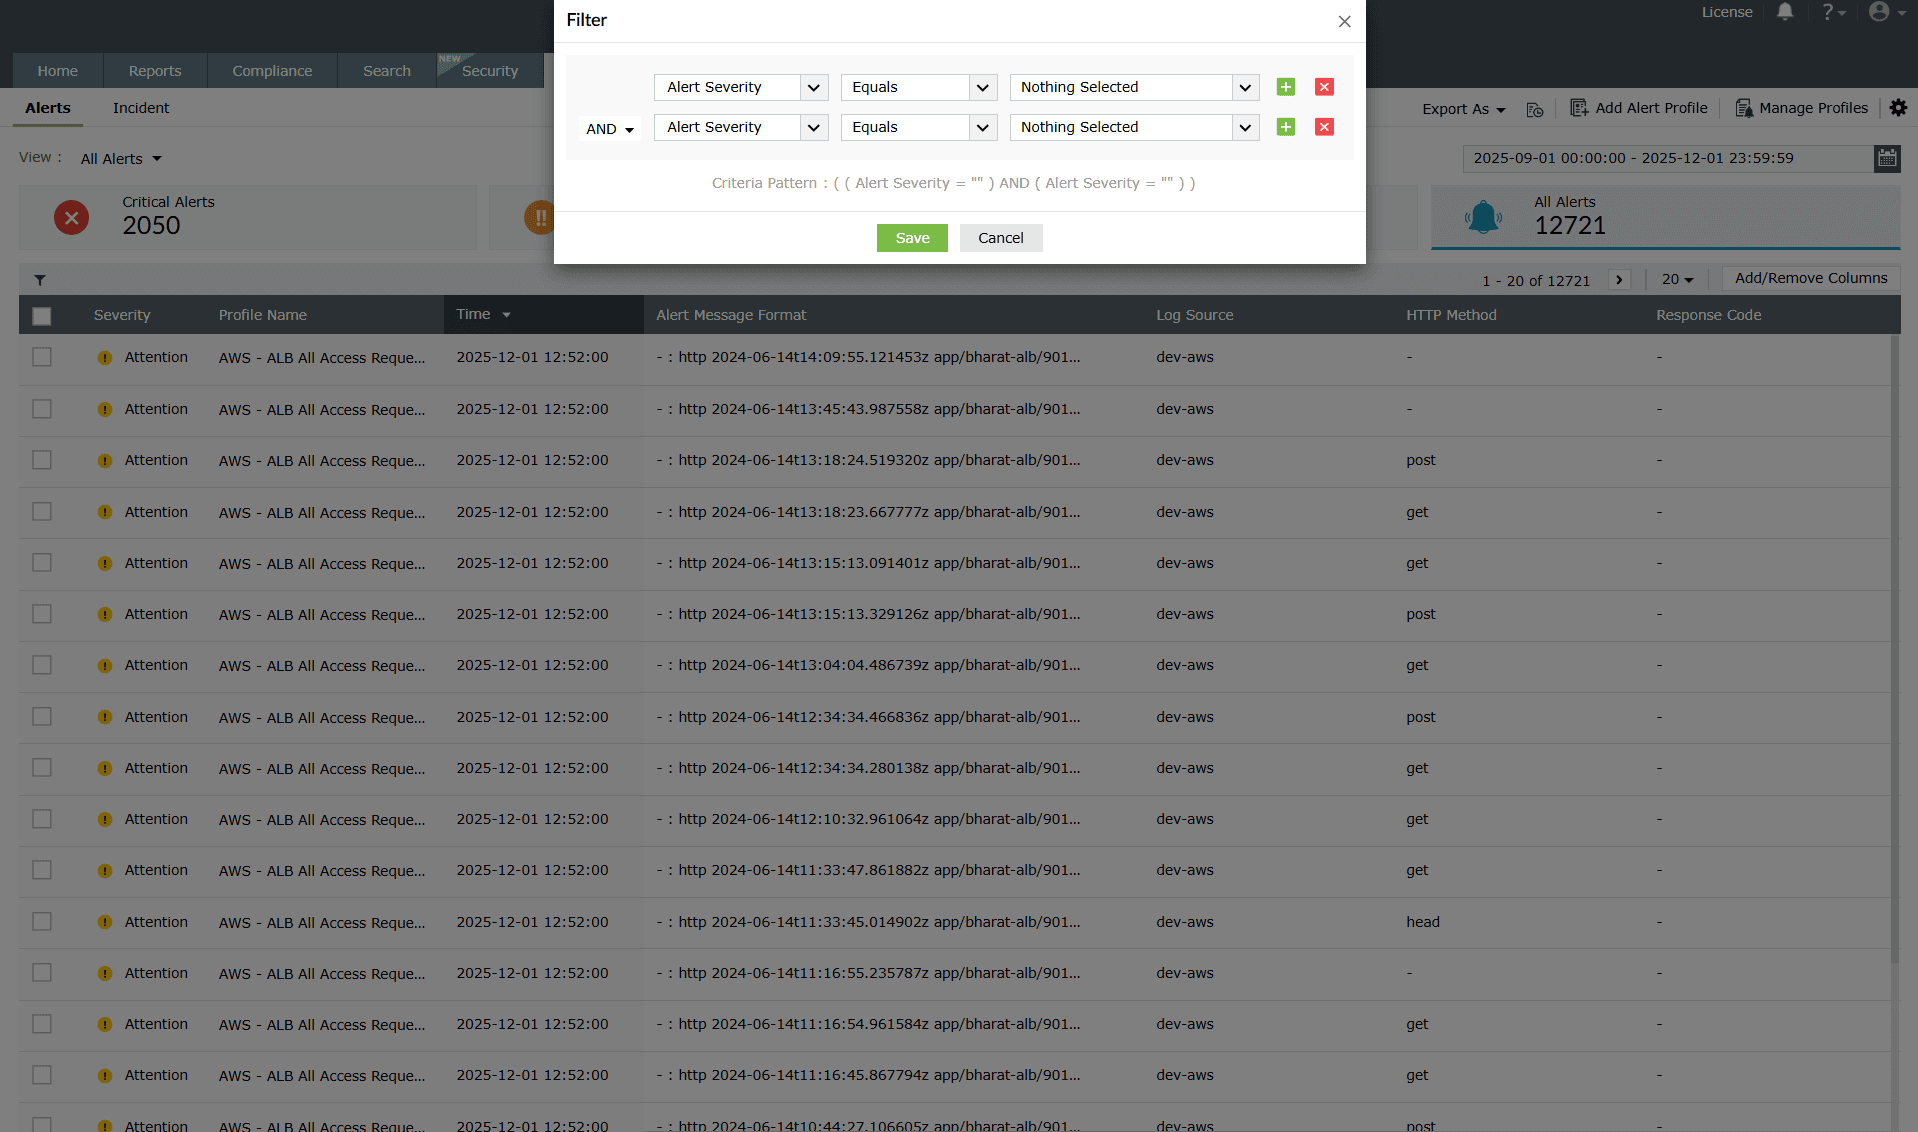
Image 4: Filter alerts to customize the alerts view
Creating alert views
- The product categorizes the alerts as Critical alerts, Trouble alerts, Attention alerts, and All alerts. You can select the required view from the Select view drop-down menu.
NOTE A view type called Active alerts denotes alerts that are in an open or in-progress status. This view is currently available only in the On-Premise version.
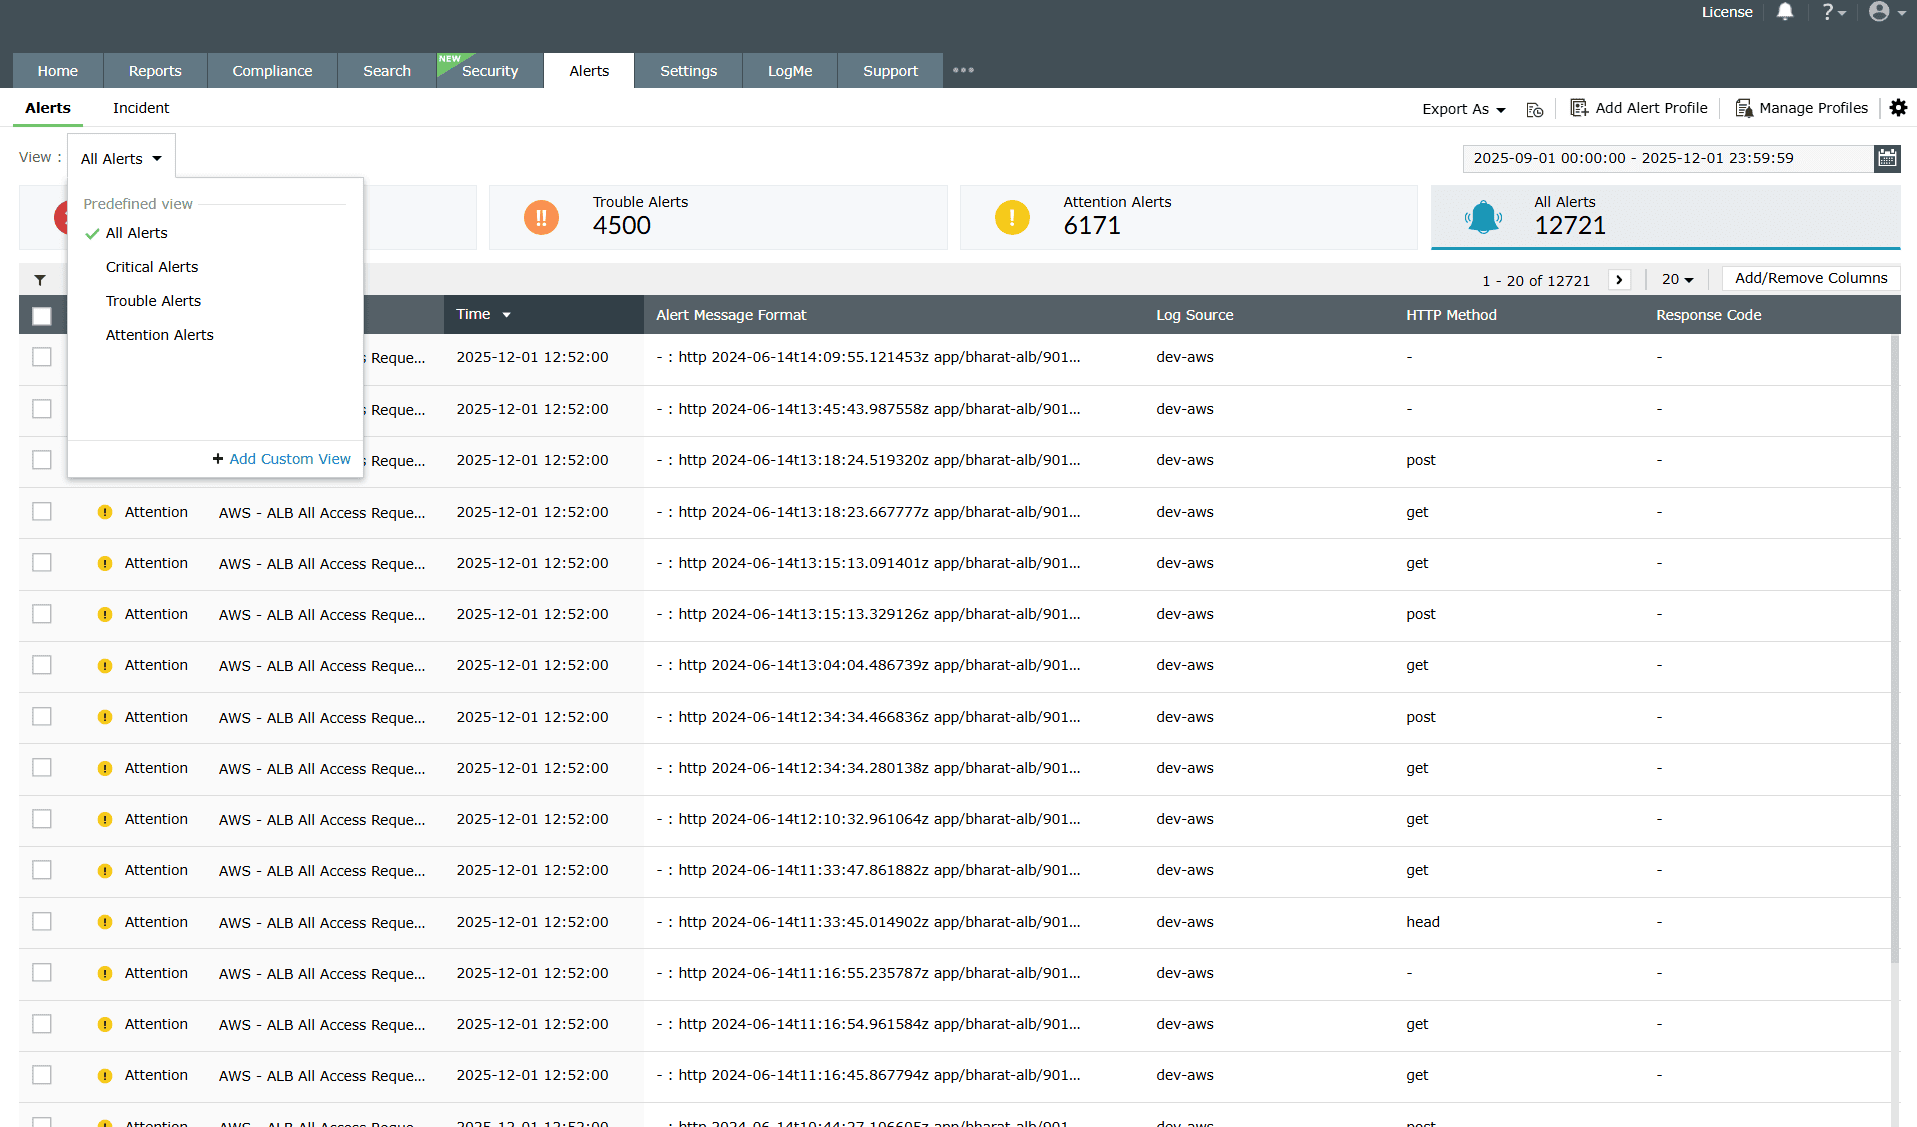
Image 5: Filtering alerts from all alert types - You can also create custom views for alerts by configuring a filter for the alert and clicking Apply. Click the Save As View link to enter a name for the view and click Save.
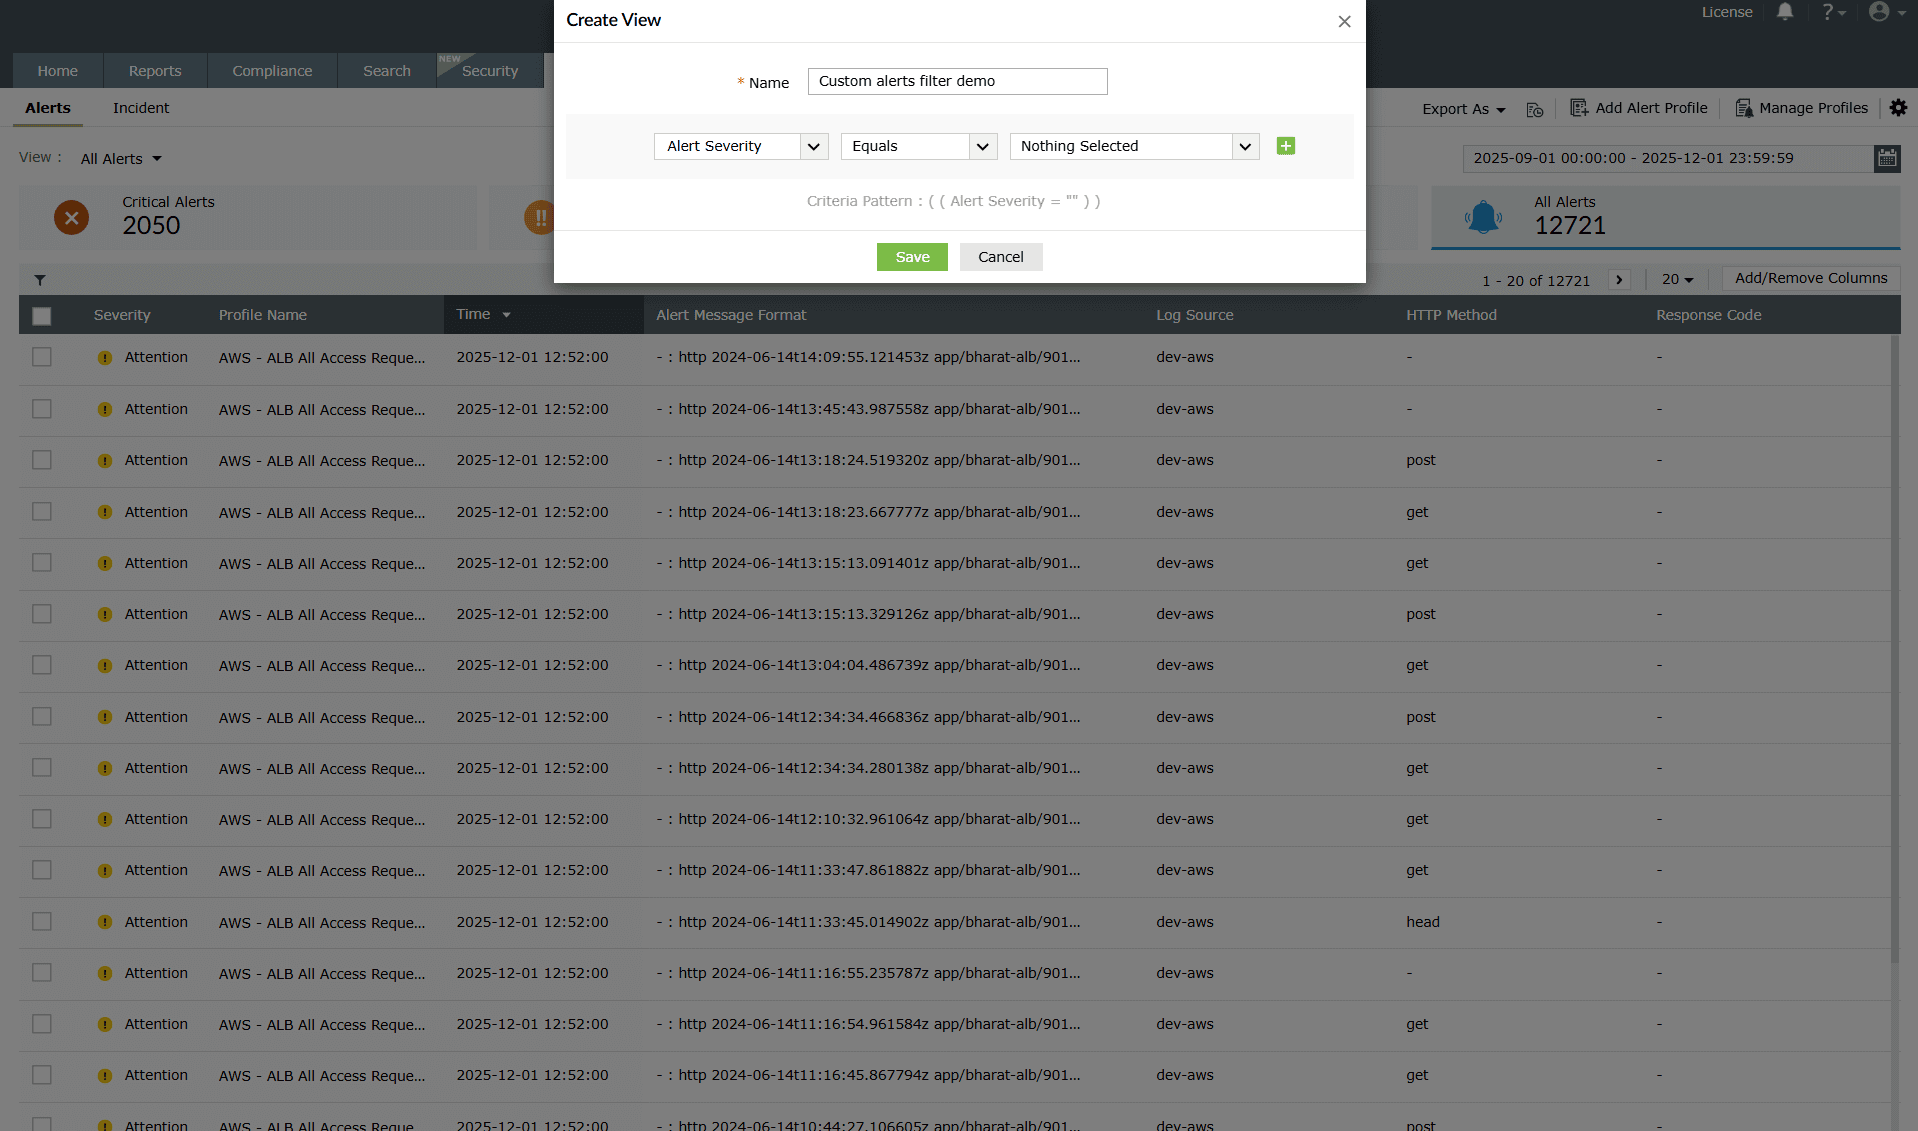
Image 6: Creating custom alert view - The custom views can only be viewed by the respective users who created the views. Hover your mouse pointer over the created view in the Select View drop-down menu to edit and delete the created views.
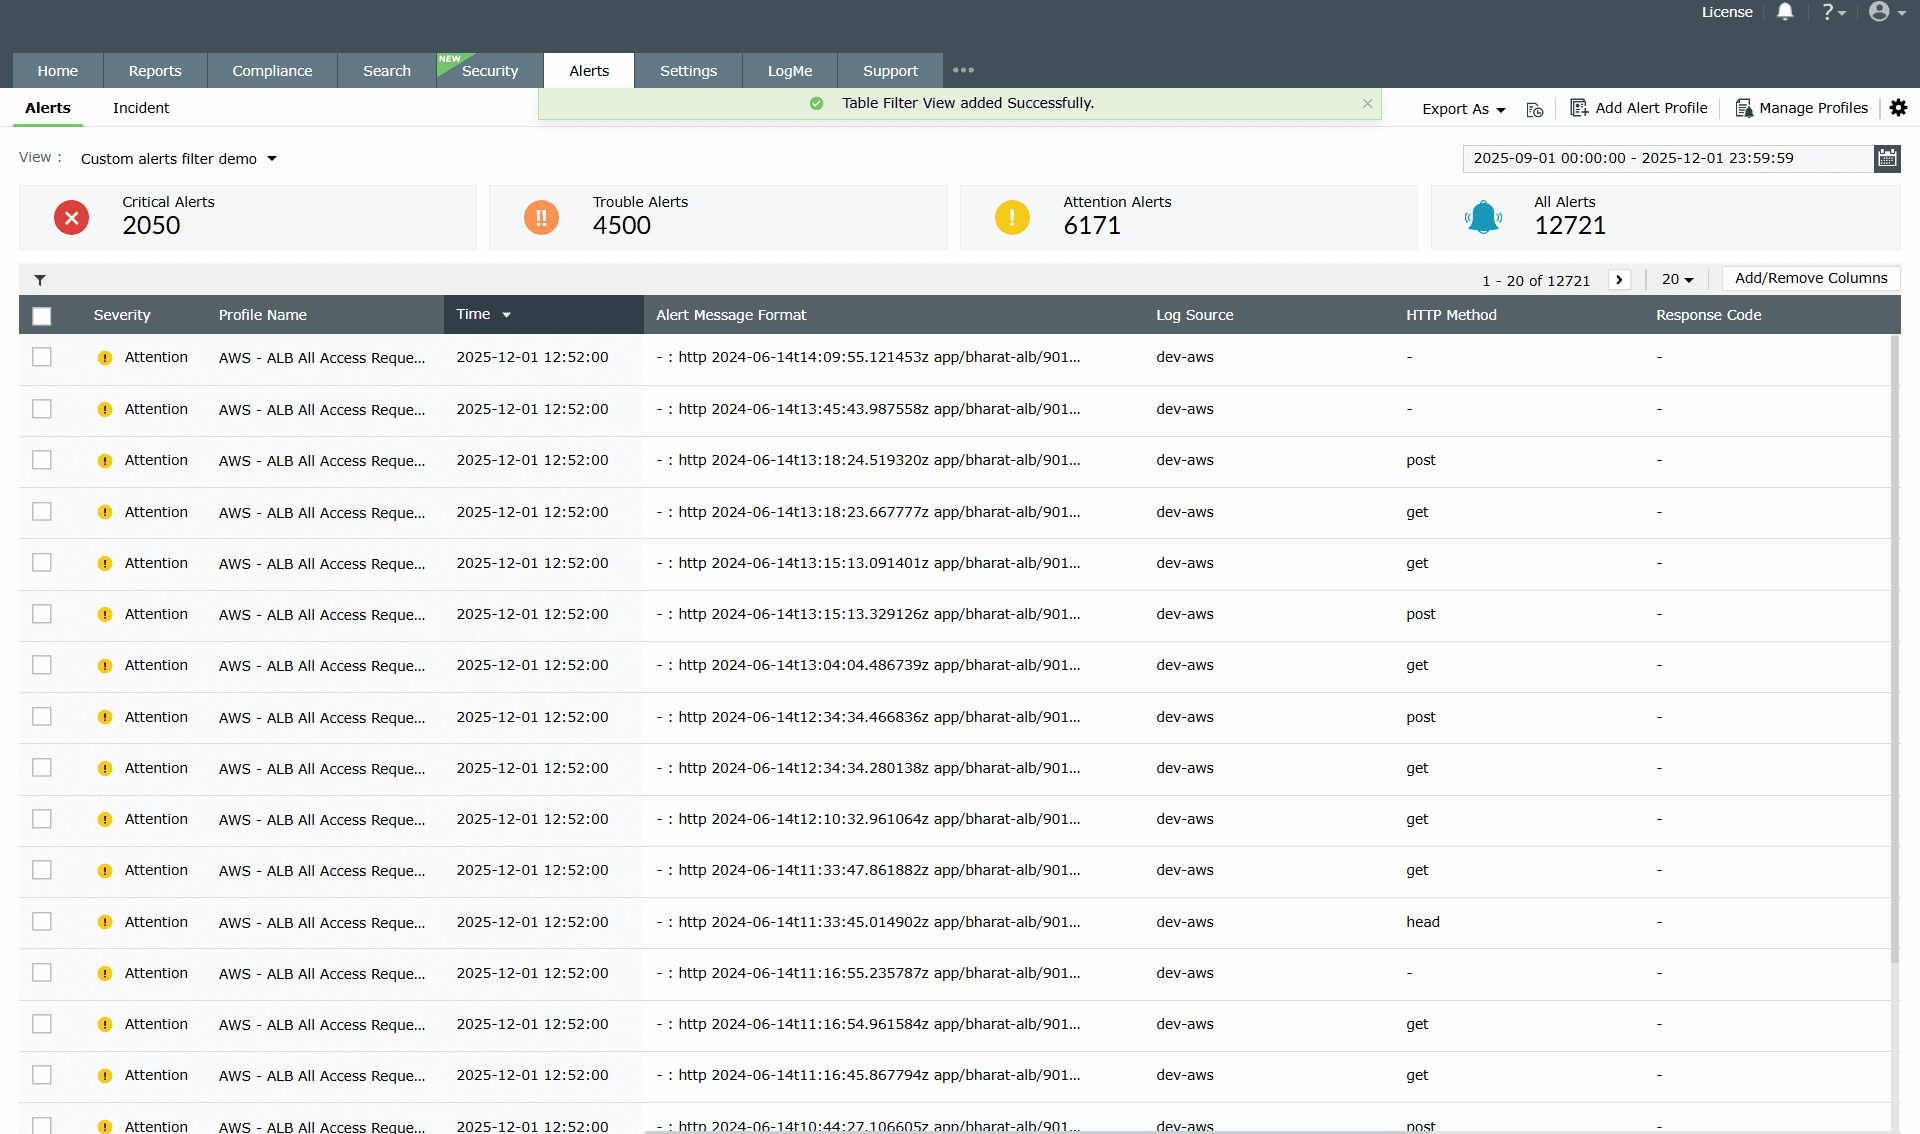
Image 7: Saving custom created alerts filter
Alert configurations
You can access the following options from the top right corner of the Alerts module:
- The Export As drop-down menu allows you to export alert messages in the CSV and PDF formats.
- The +Add Alert Profile link allows you to add a new alert profile.
Click the settings icon on the top right corner of the page to view the following options:
- Playbooks: This option allows you to assign playbooks to alert profiles to execute a logical action in your network when an adversity is detected.
NOTE The playbooks capability is currently available only in the On-Premise version.
- Ticketing Tool Integration: This option allows you to configure an external help desk software (ServiceDesk Plus, ServiceNow, Jira Service Desk, Zendesk, Kayako, and BMC Remedy Service Desk) to forward the alerts to.
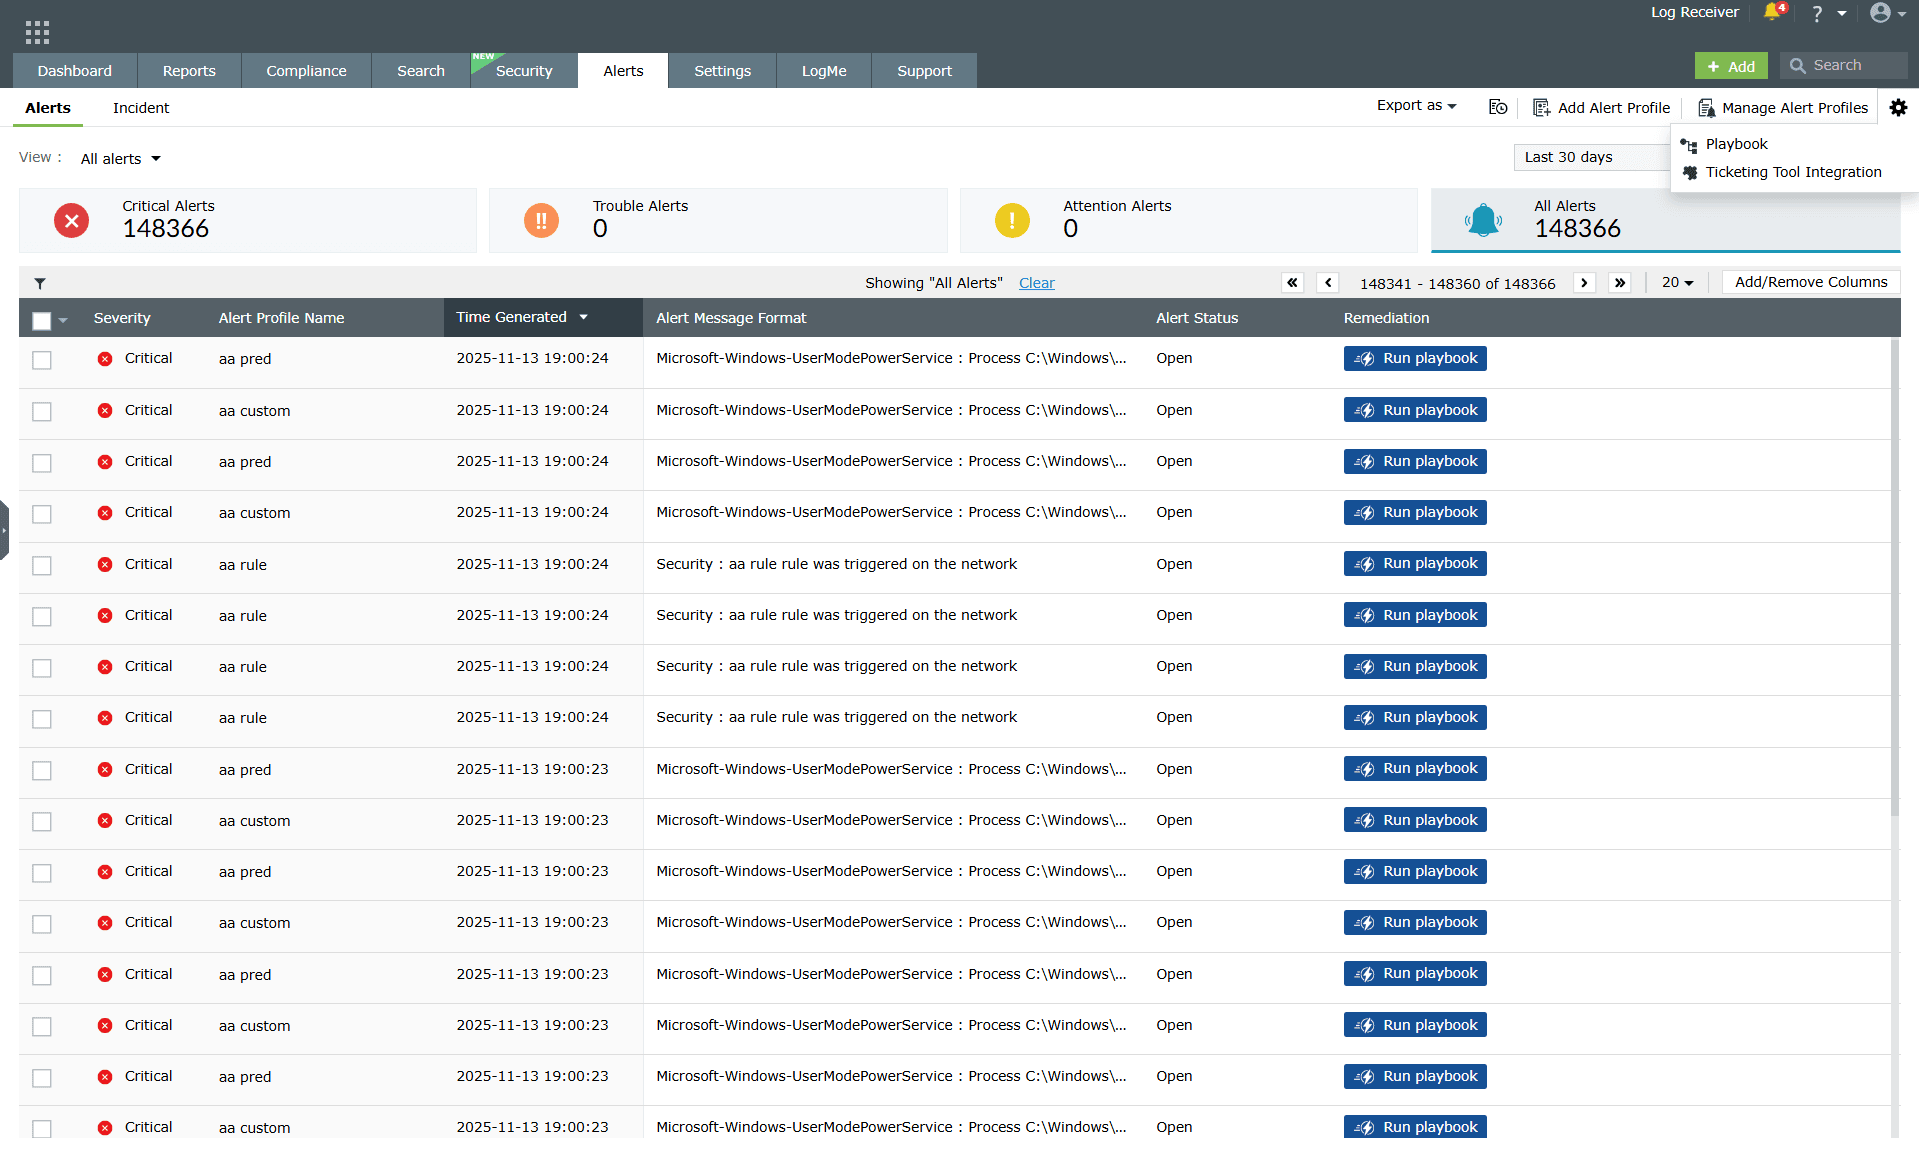
Image 8: Playbooks and Ticketing Tool Integration in the alerts module
Whitelisting threats
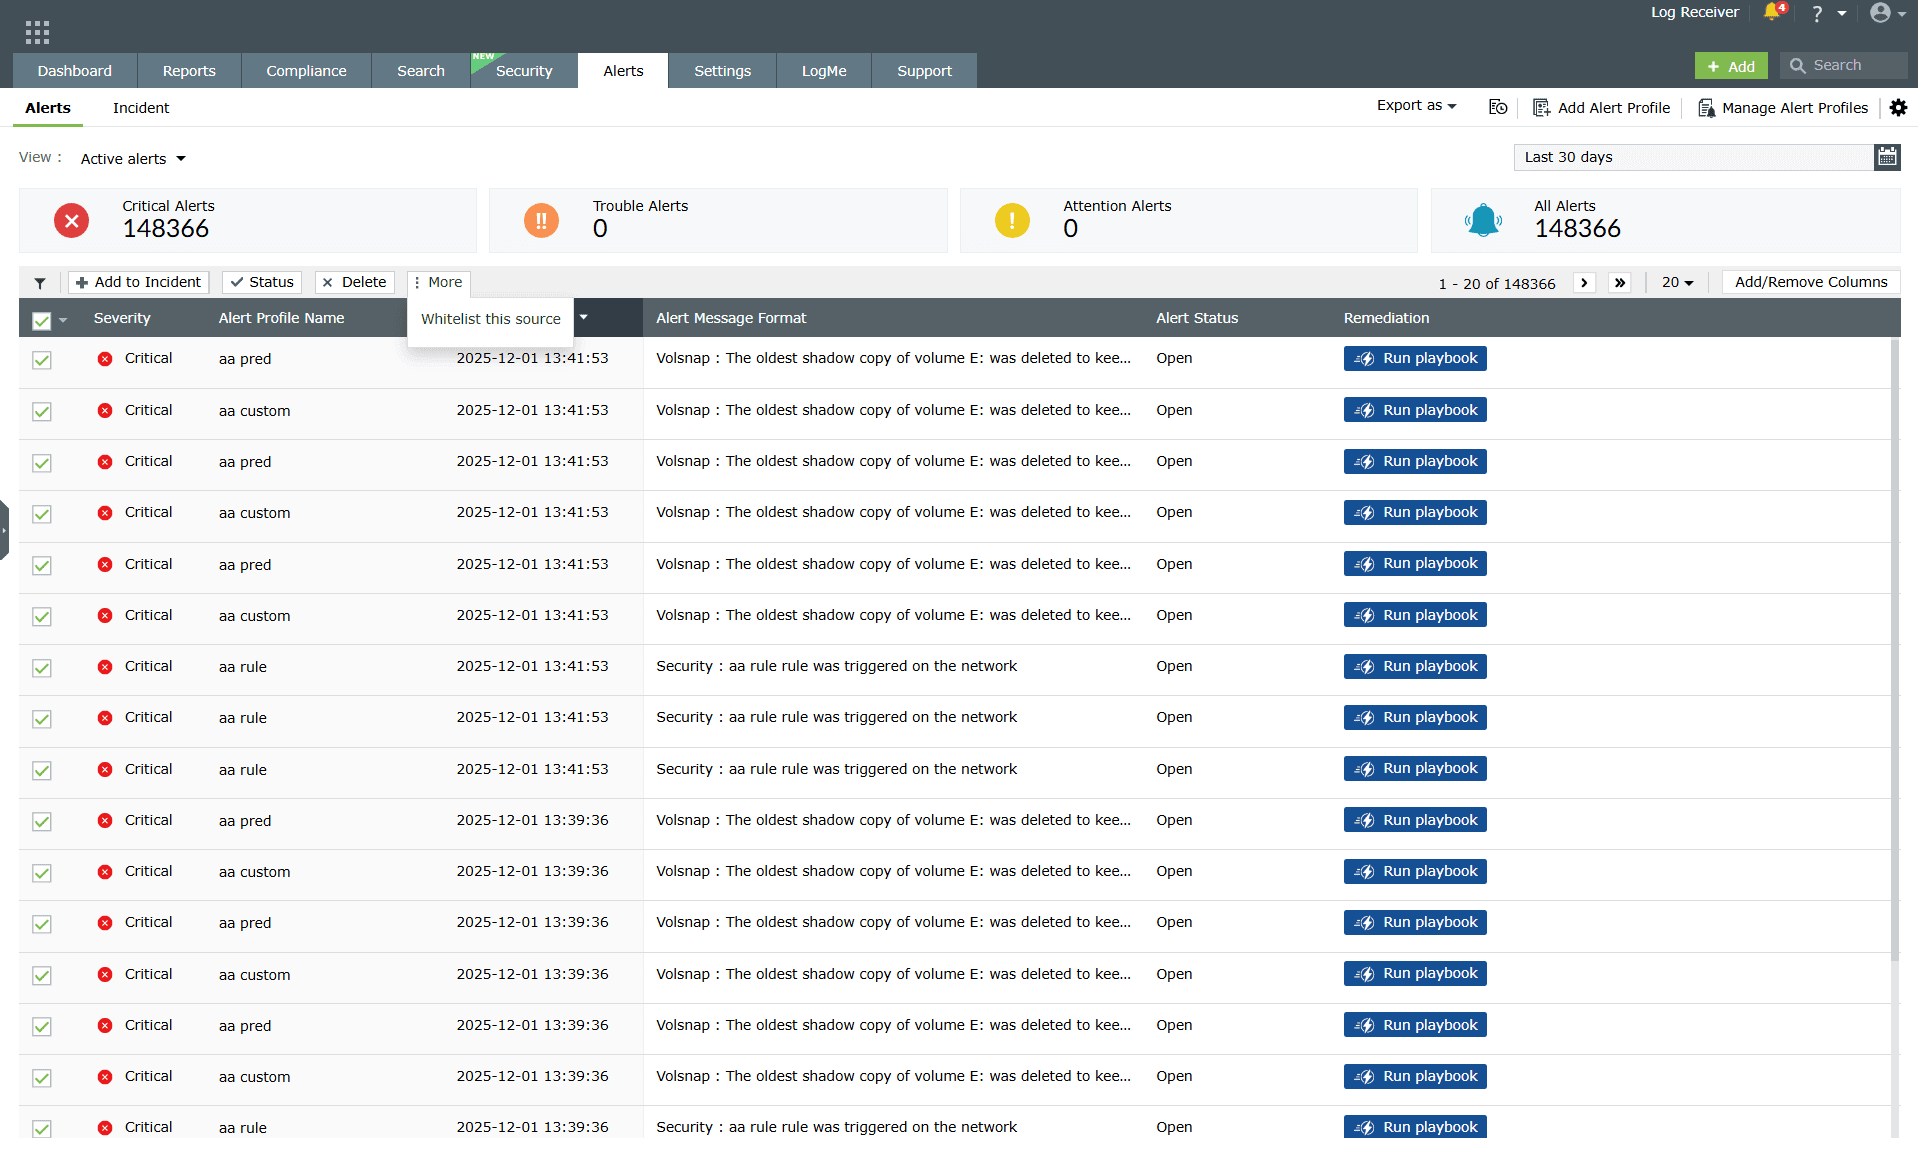
- Click on the check boxes to select the required alerts.
- Once the alerts are selected, the options Assign, Status, Delete, and More will appear. You can assign the alert to an administrator, change the status, or delete the alerts by choosing the appropriate options.
- Clicking on More will give you the option to Whitelist the Source.
- In case an alert is raised by Advanced Threat Analytics and you are convinced that the source is not malicious, you can whitelist it by choosing the option here.
Information on the alert
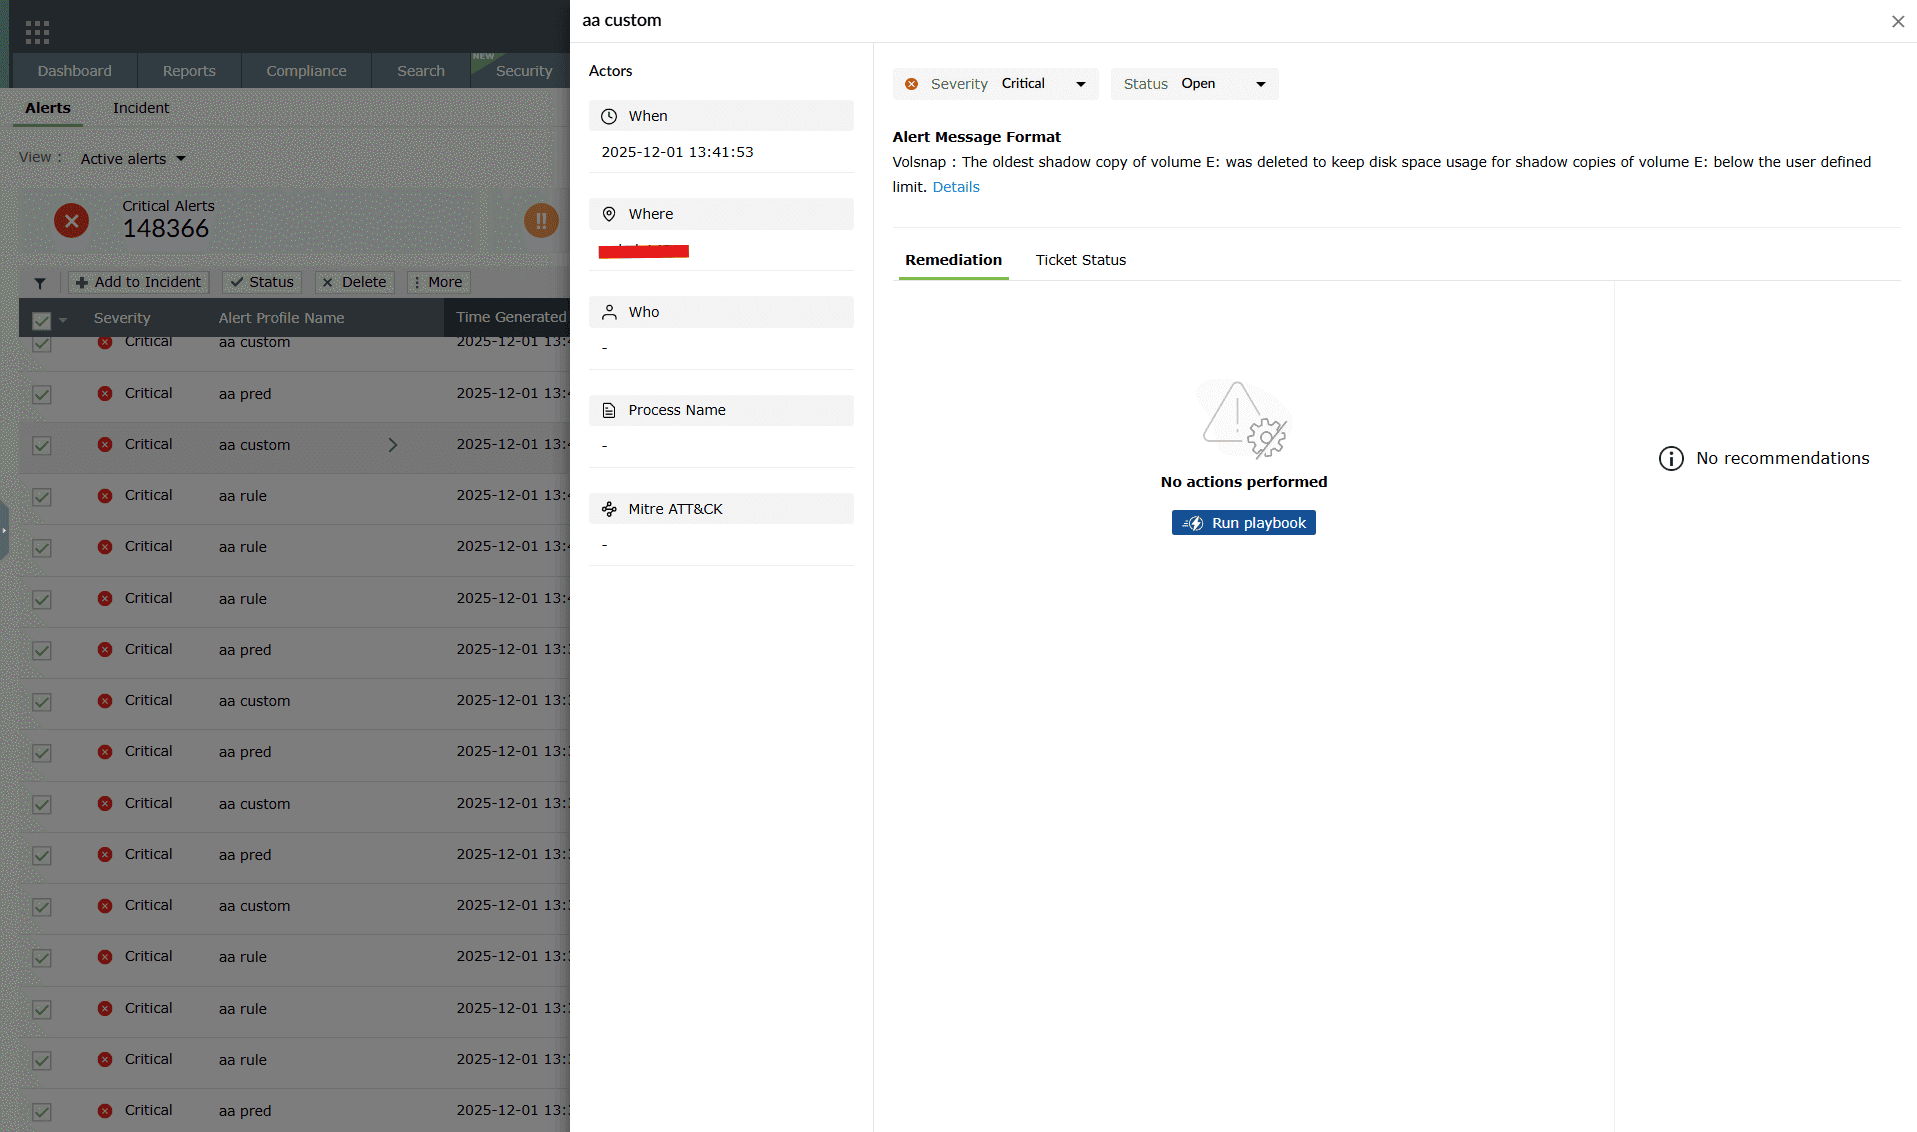
- Clicking anywhere on an alert prompts open a pane containing all the information such as When and Where the alert was triggered, the associated device, log details, MITRE mappings (if applicable), remediation steps, notification status, ticket configuration options, and controls to create or view support tickets.
- Clicking on the Details button opens a sub-pane that displays the complete alert log, including alert metadata and event-level information such as:
- Alert details: Alert severity and alert status
- Log details: Message, SL event ID, username, type, host type, and event ID
- Event attributes: Time of occurrence, source port number, device name, OS category, event source, and event severity
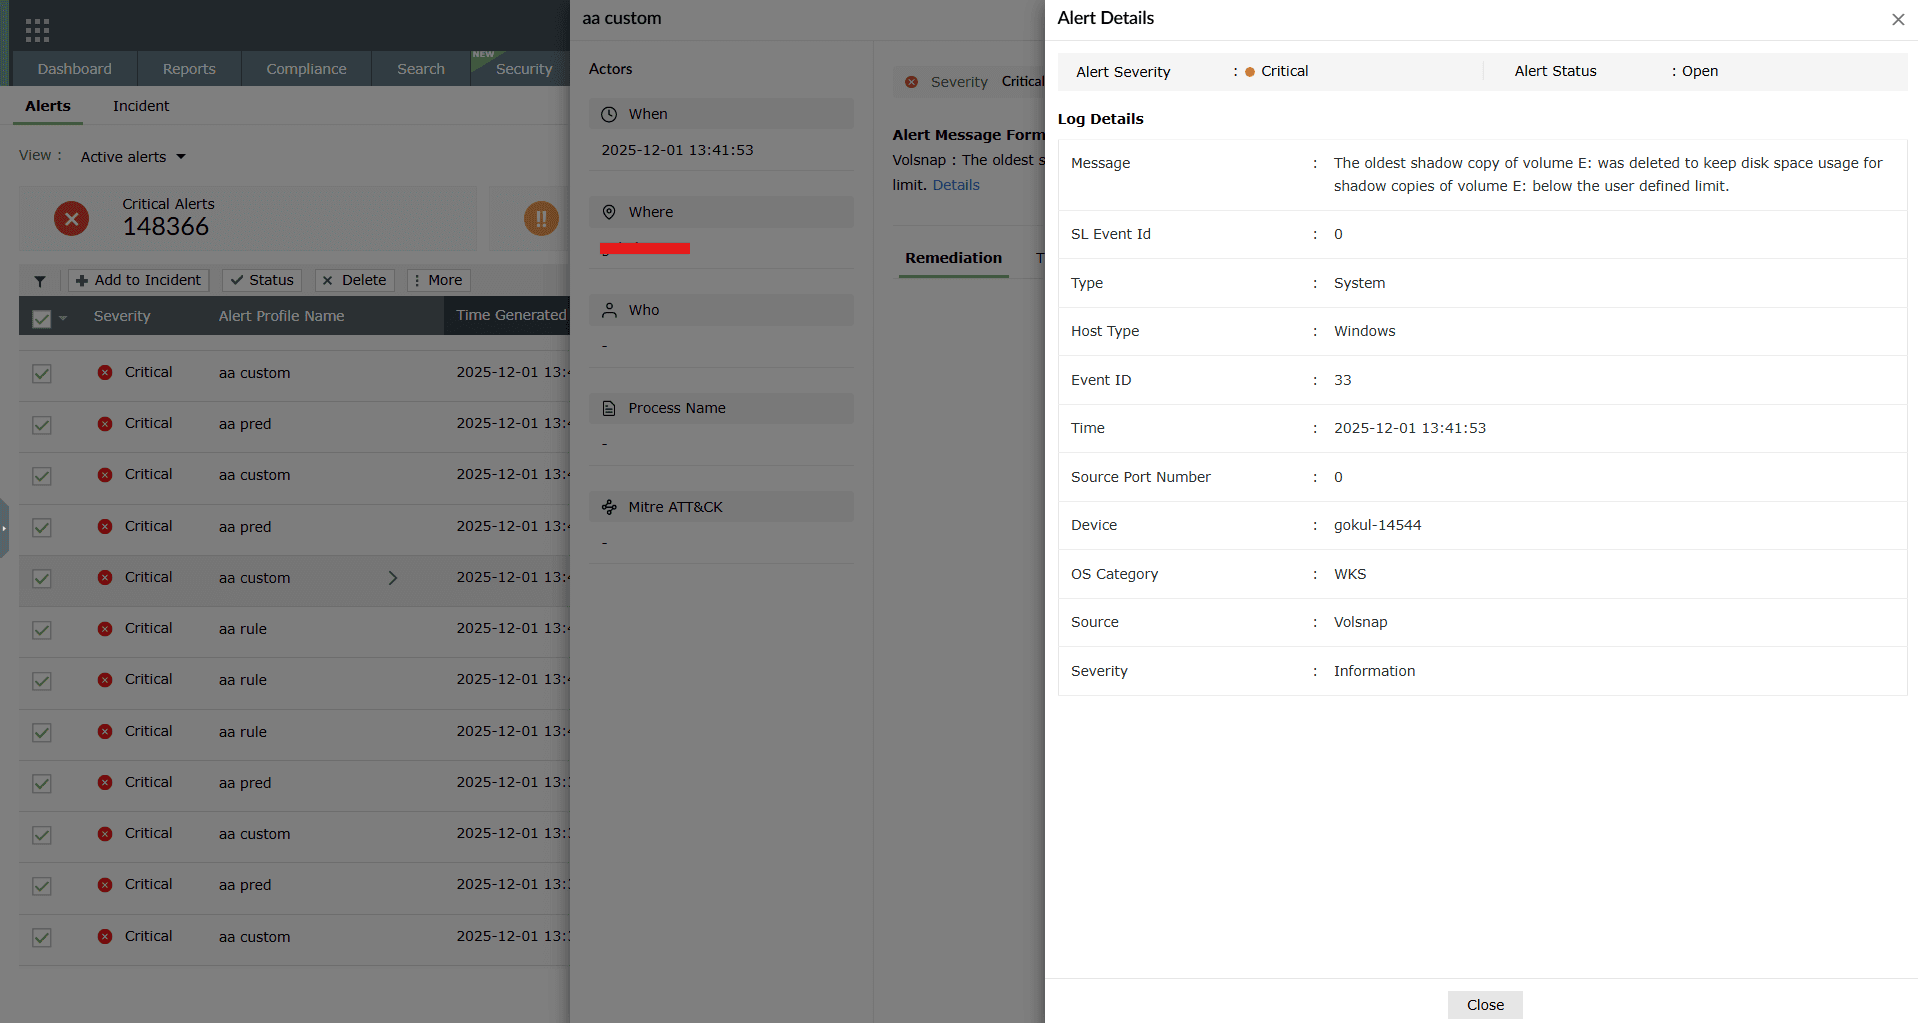
Image 11: Viewing the alert format message of an alert by clicking on it
Playbook status
- In case a playbook is configured for the alert, the status of the playbook can be viewed in the Alert Format Message pop-up.
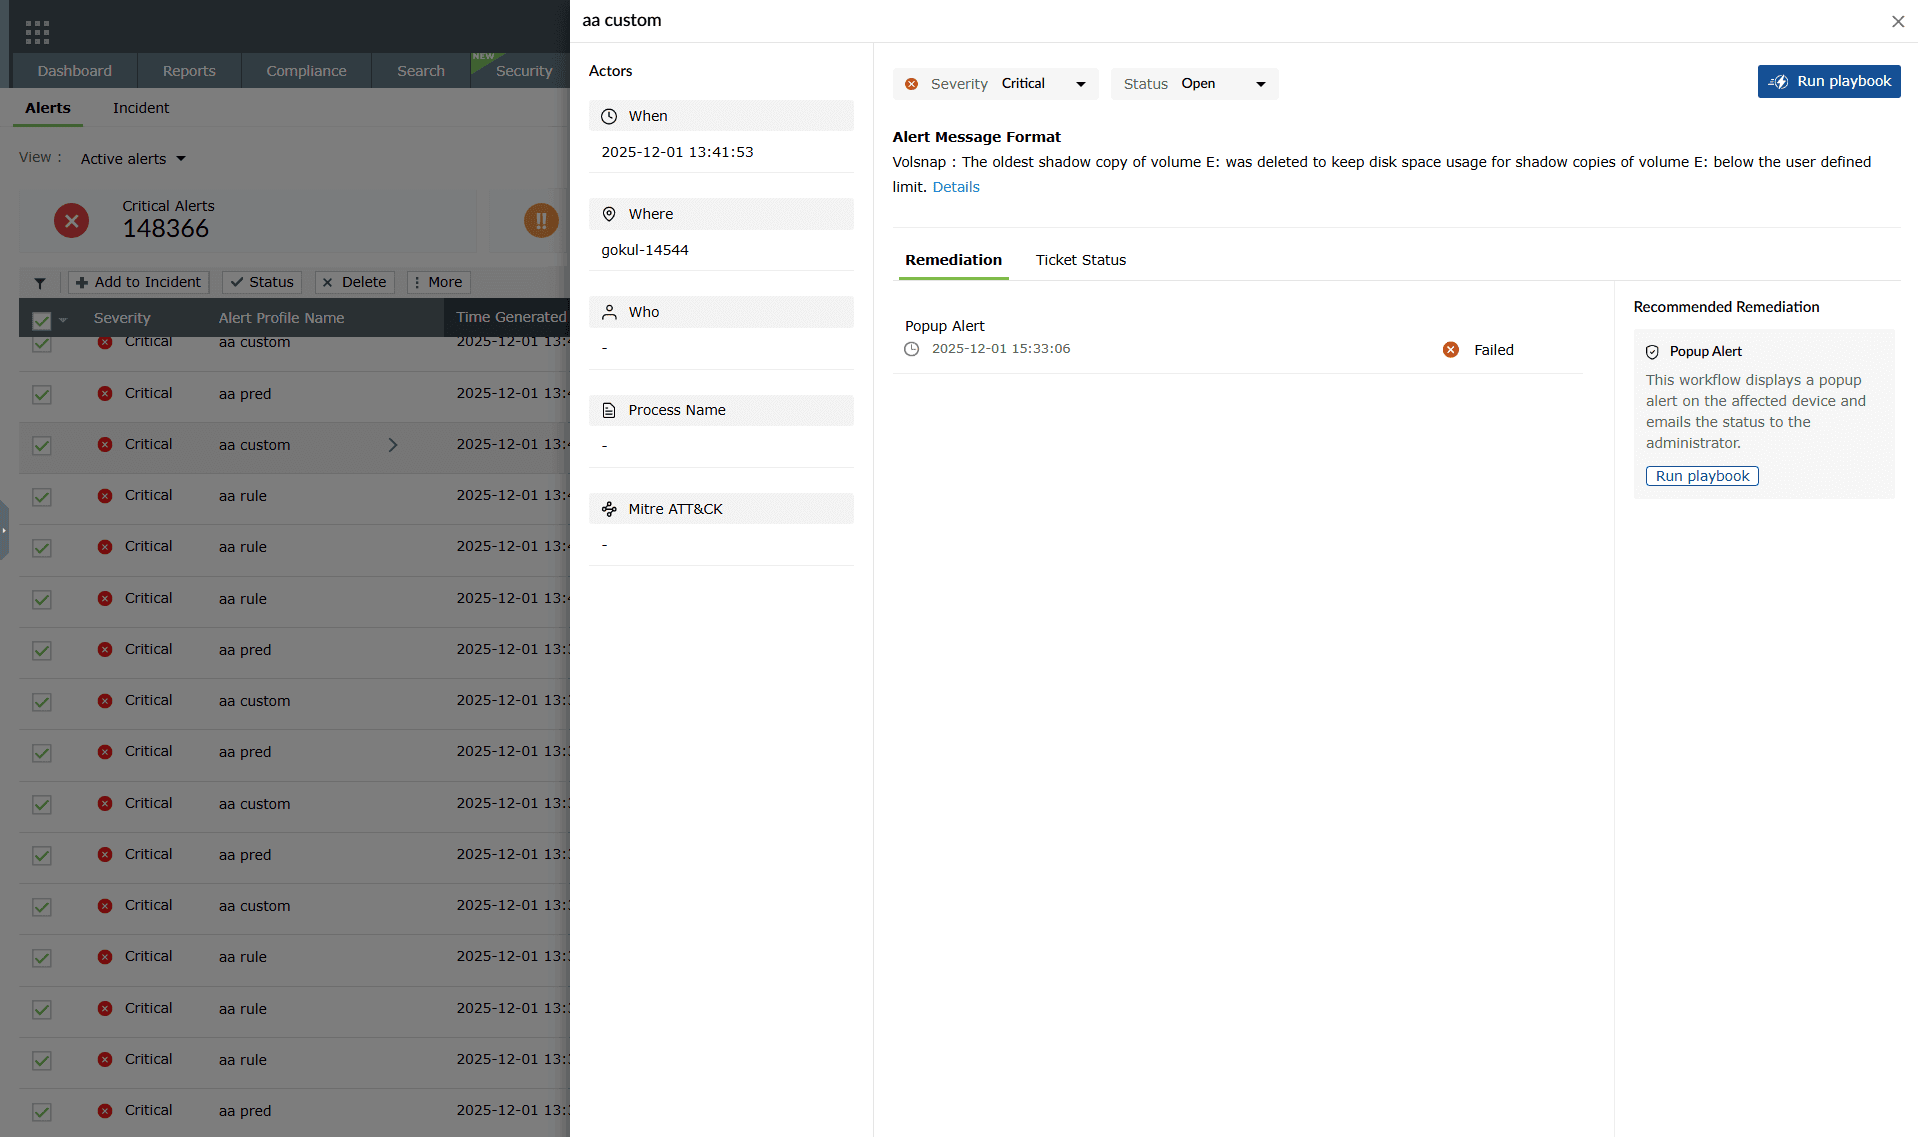
Image 12: Checking the playbook status configured to an alert profile NOTE Remediation and Recommended Remediation tabs, and the option for configuring the Severity and Status are available in the On-Premise version only and not in the On-Demand version. - Click on the status of the playbook for more information. Once clicked, the Playbook History pane slides open.
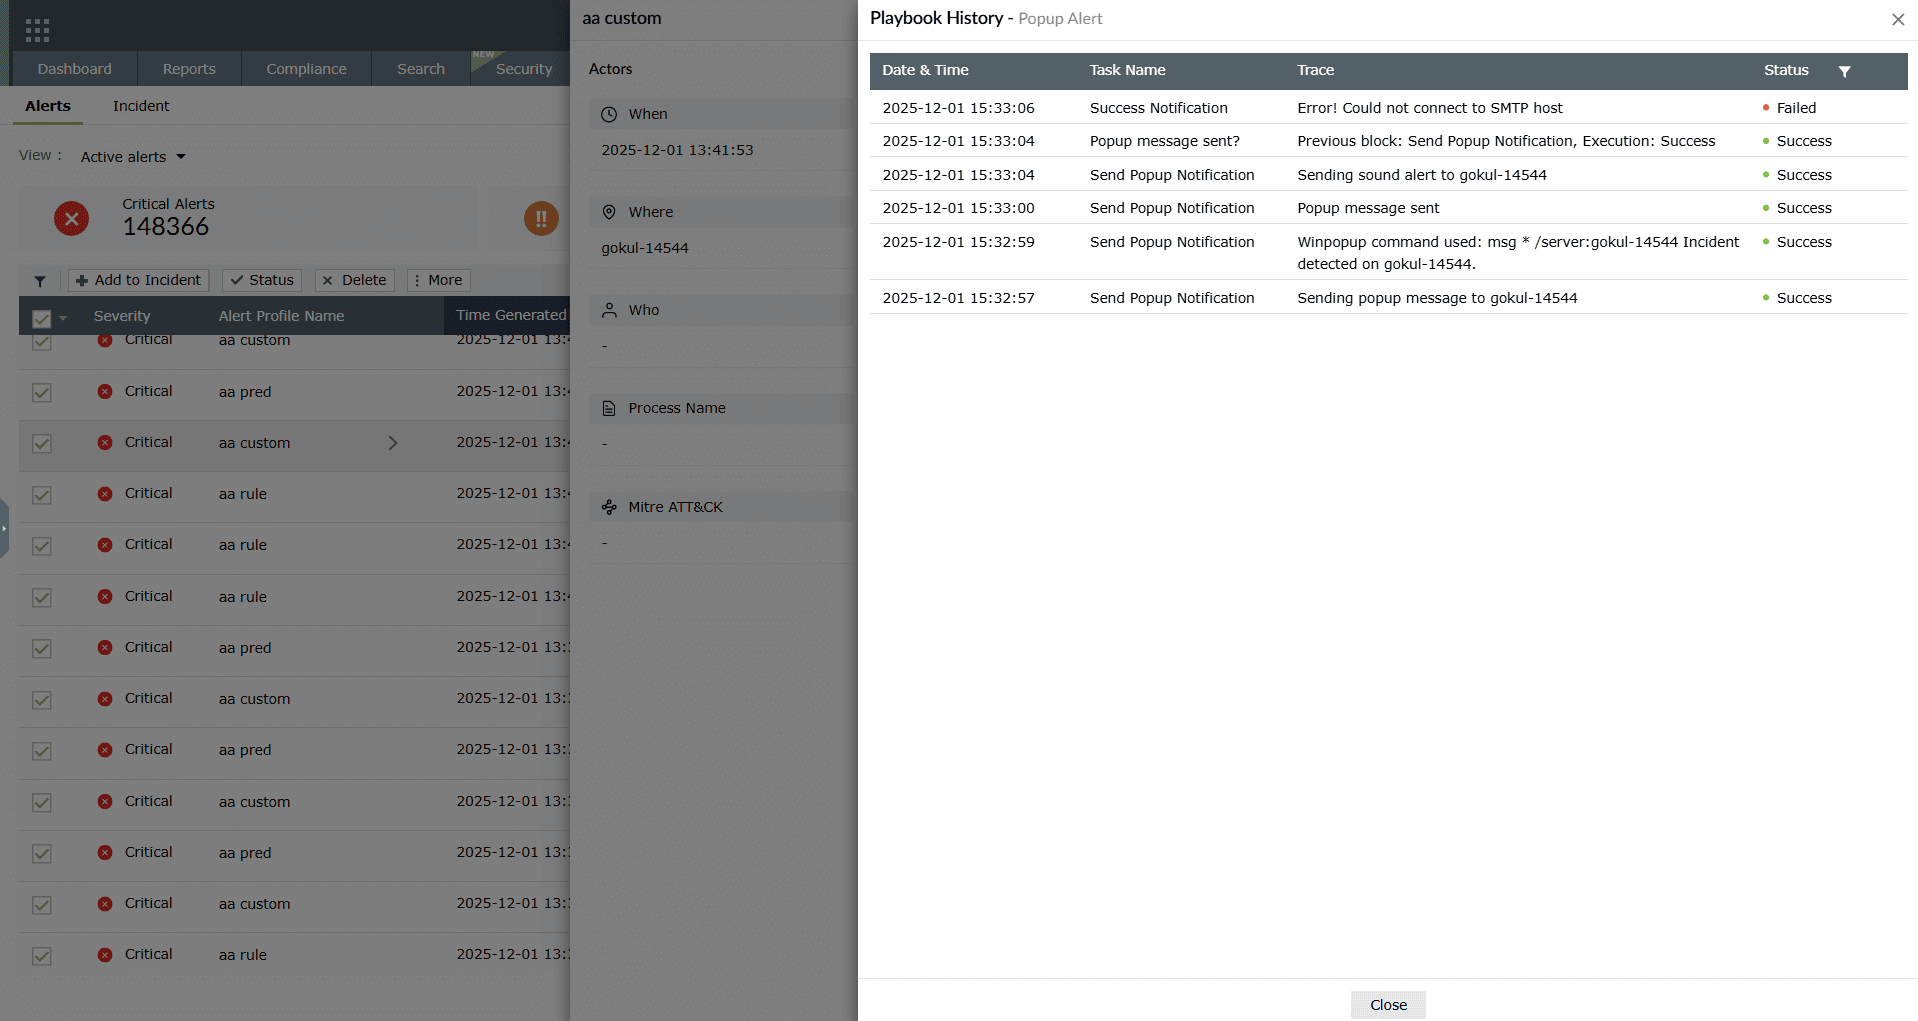
Image 13: Checking the playbook status configured to an alert profile
Threshold alerts
- For Threshold based alerts, you can now view each instance by clicking on the alert. There will be a section called Threshold.
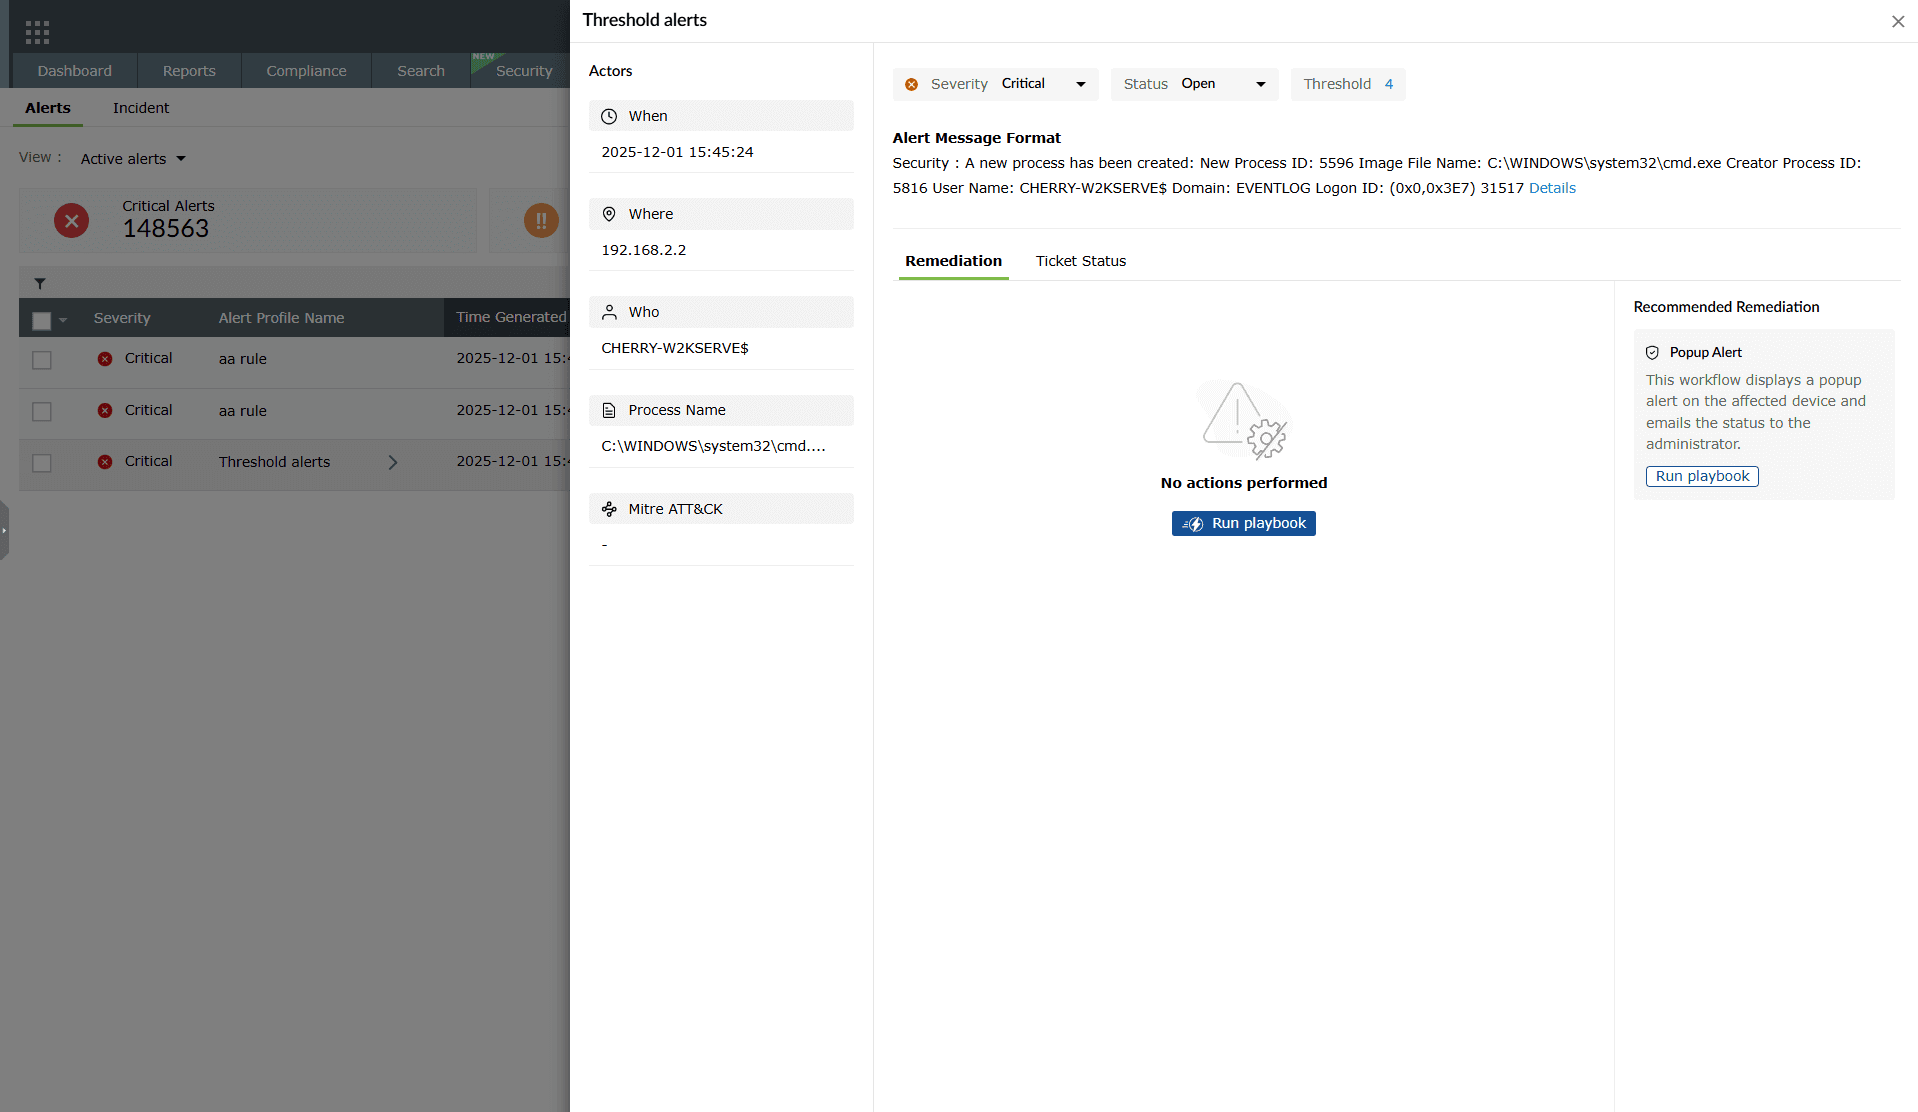
Image 14: Viewing threshold-based alerts - Clicking on the threshold number will give you a pop-up with more details.
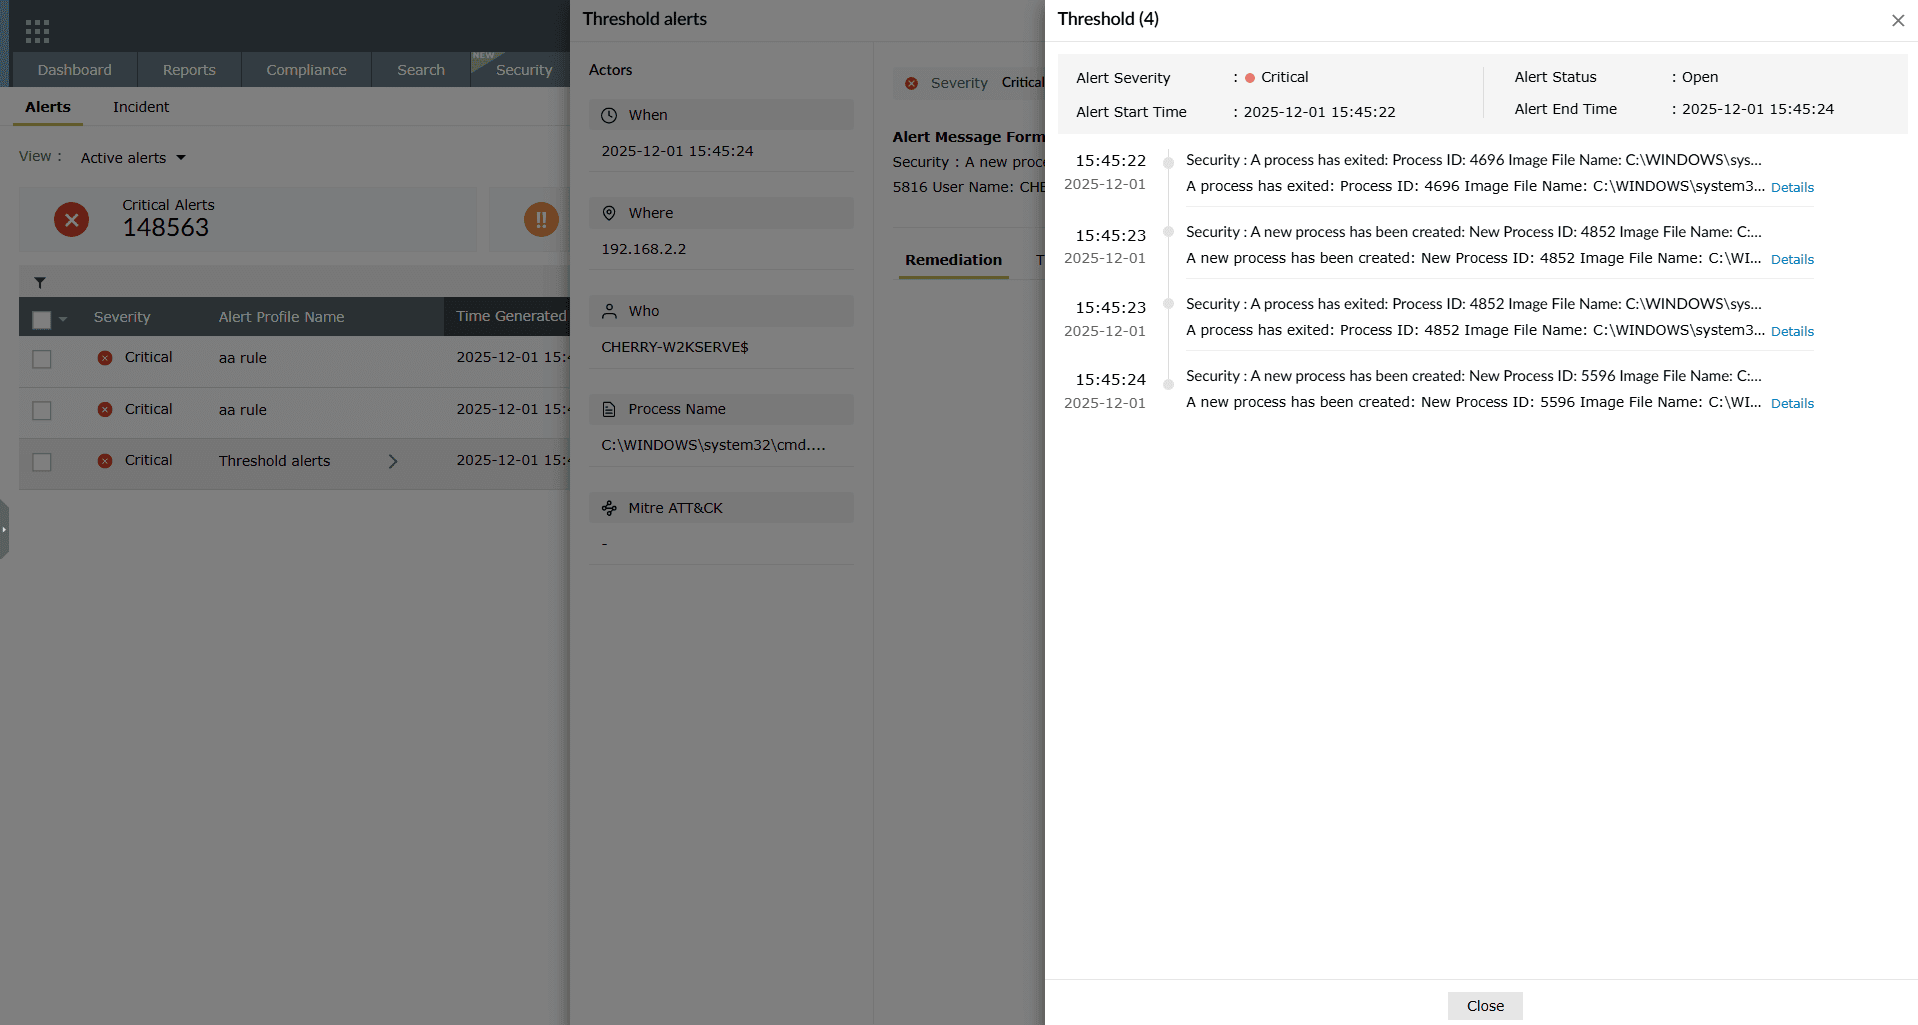
Image 15: Viewing threshold-based alerts
Add/Remove columns
- Cloumns can be added or removed by clicking on the Add/Remove option in the top right corner.
- You have the option to choose and rearrange the columns as needed.
- A minimum of 2 and a maximum of 10 can be selected.
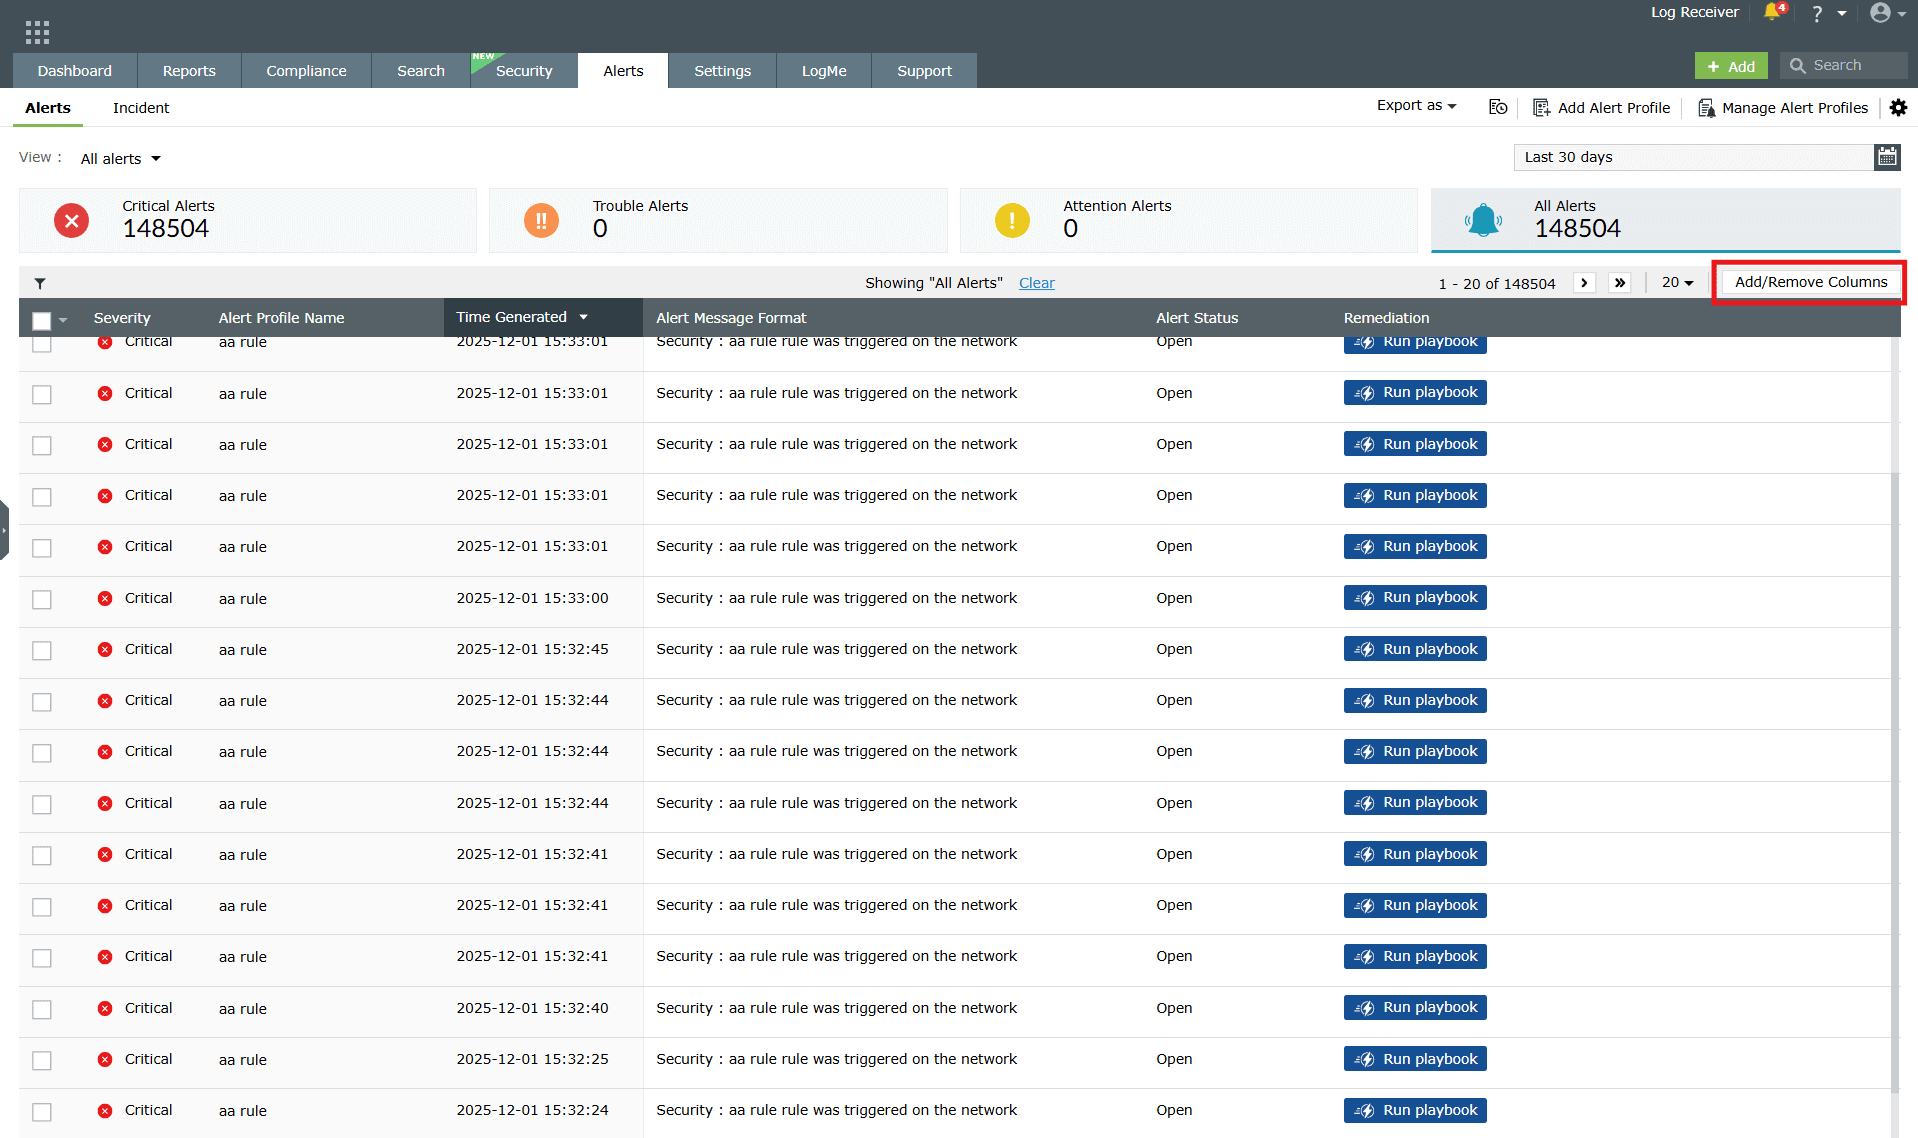
- Clicking on this will give you a pop-up. Choose the required options by clicking on the checkboxes.
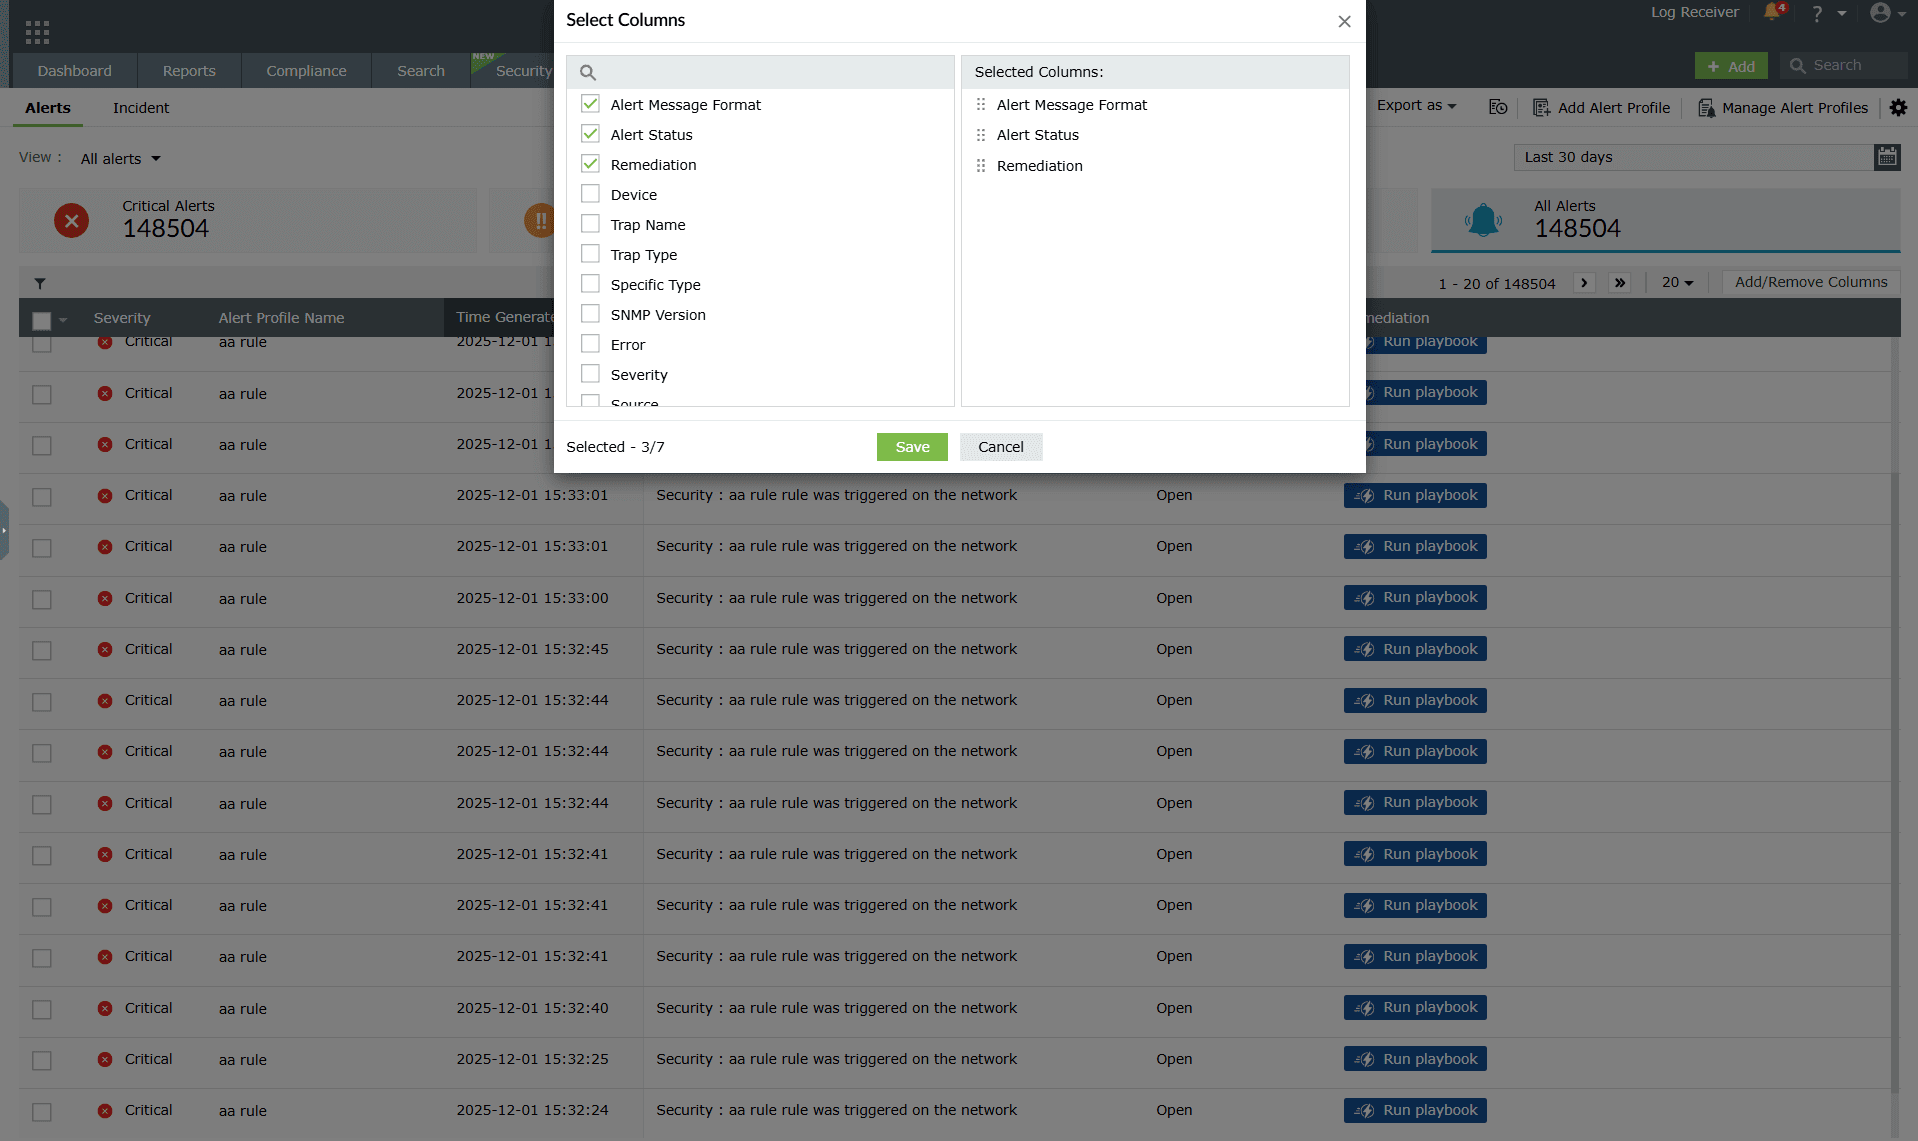
Image 17: Add/Remove columns in the alerts module as required
Advanced Threat Analytics alerts
- These alerts are raised when malicious domains, URLs, and IPs intrude into your network.
- Clicking on the Threat Analytics icon
 of this alert will give you a reputation score, the number of times it had appeared on a threat list and more.
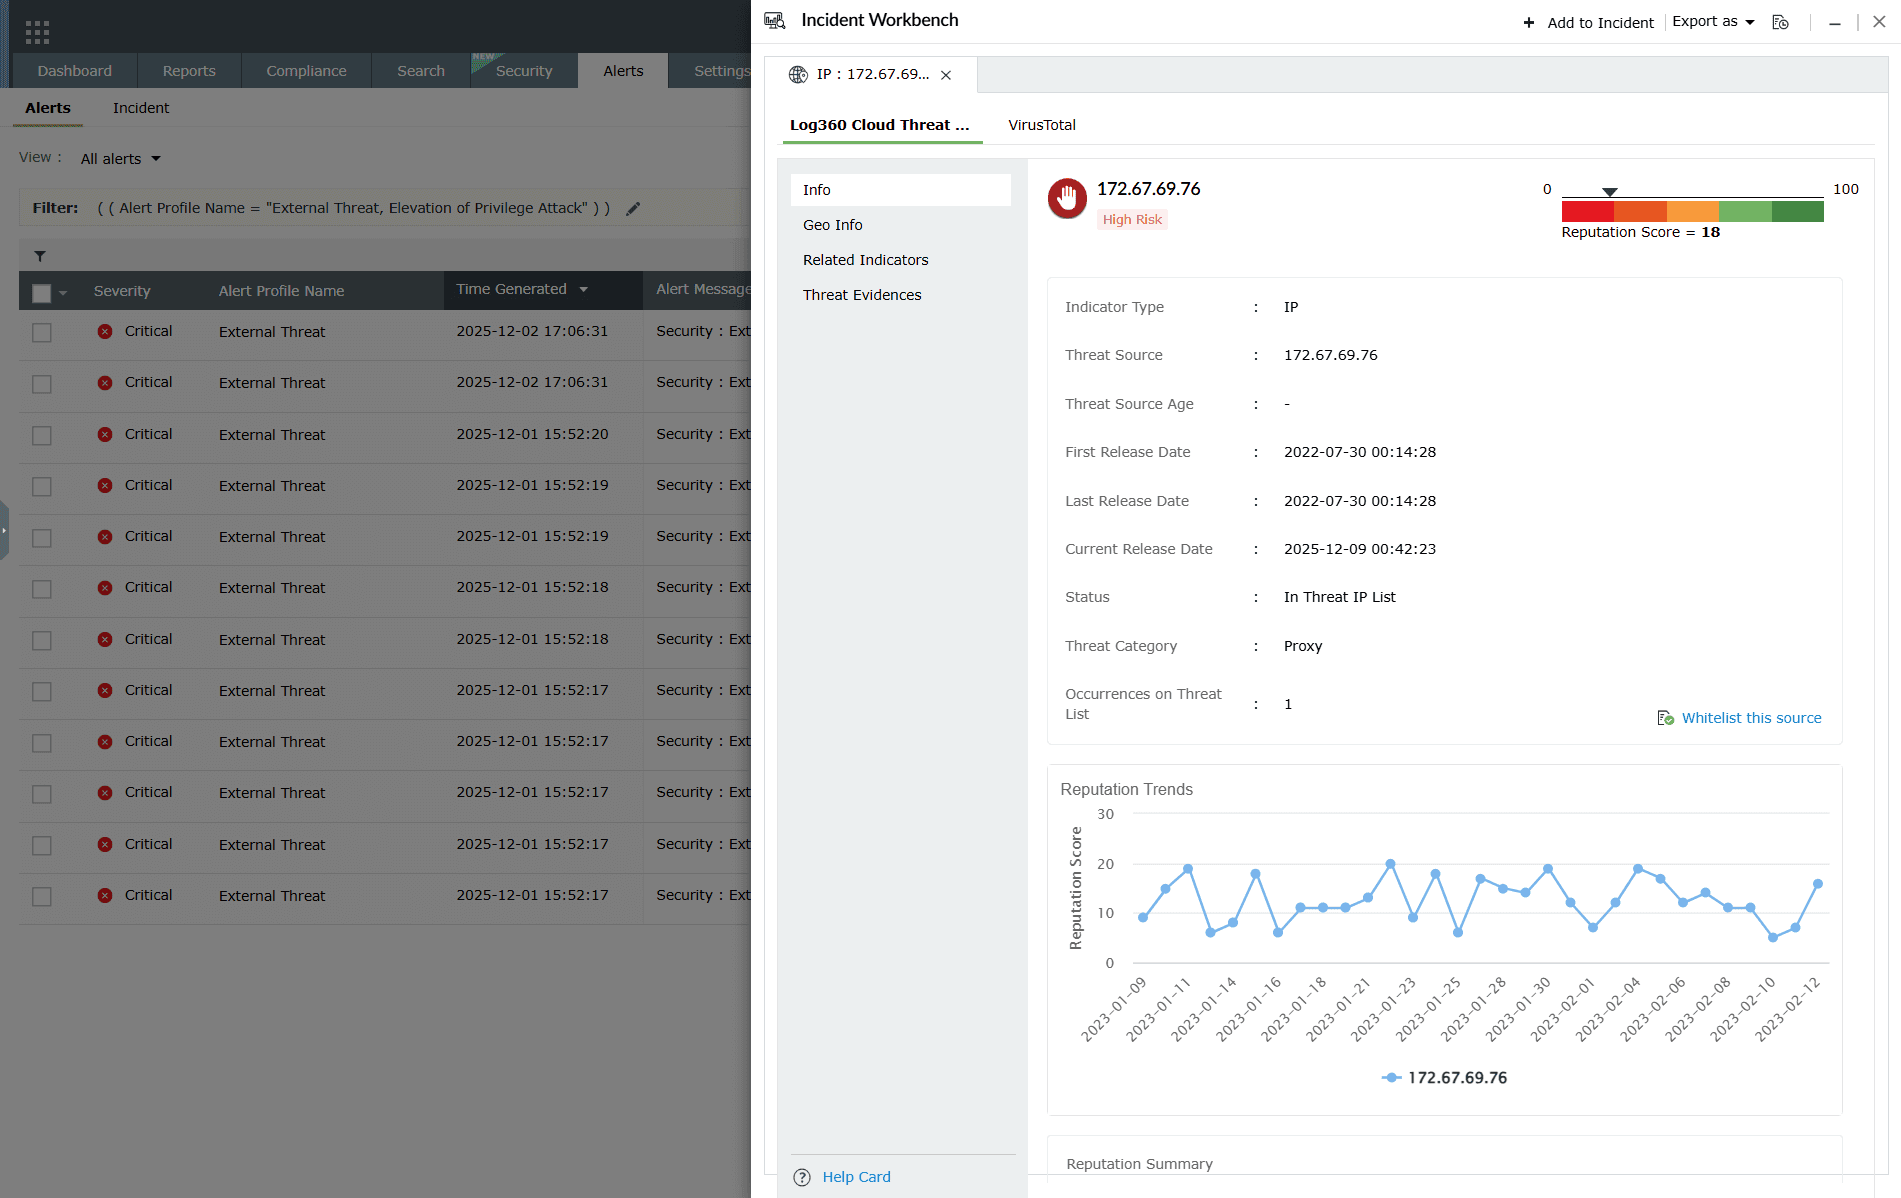
Image 18: Viewing the Threat Analytics of alerts
Read also
This page covered how to view and manage log alerts in Log360. To explore related alerting and analysis features, refer to the following documents: