Deploy in minutes
Install, deploy, and start monitoring your network in minutes across Windows and Linux environments.

OpManager is recognized as a frontrunner by Software Advice in the network monitoring tools category with a rating of 4.7 out of 5
OpManager is shortlisted by Capterra for the top network monitoring software of 2024 with an overall score of 75 out of 100
Install, deploy, and start monitoring your network in minutes across Windows and Linux environments.
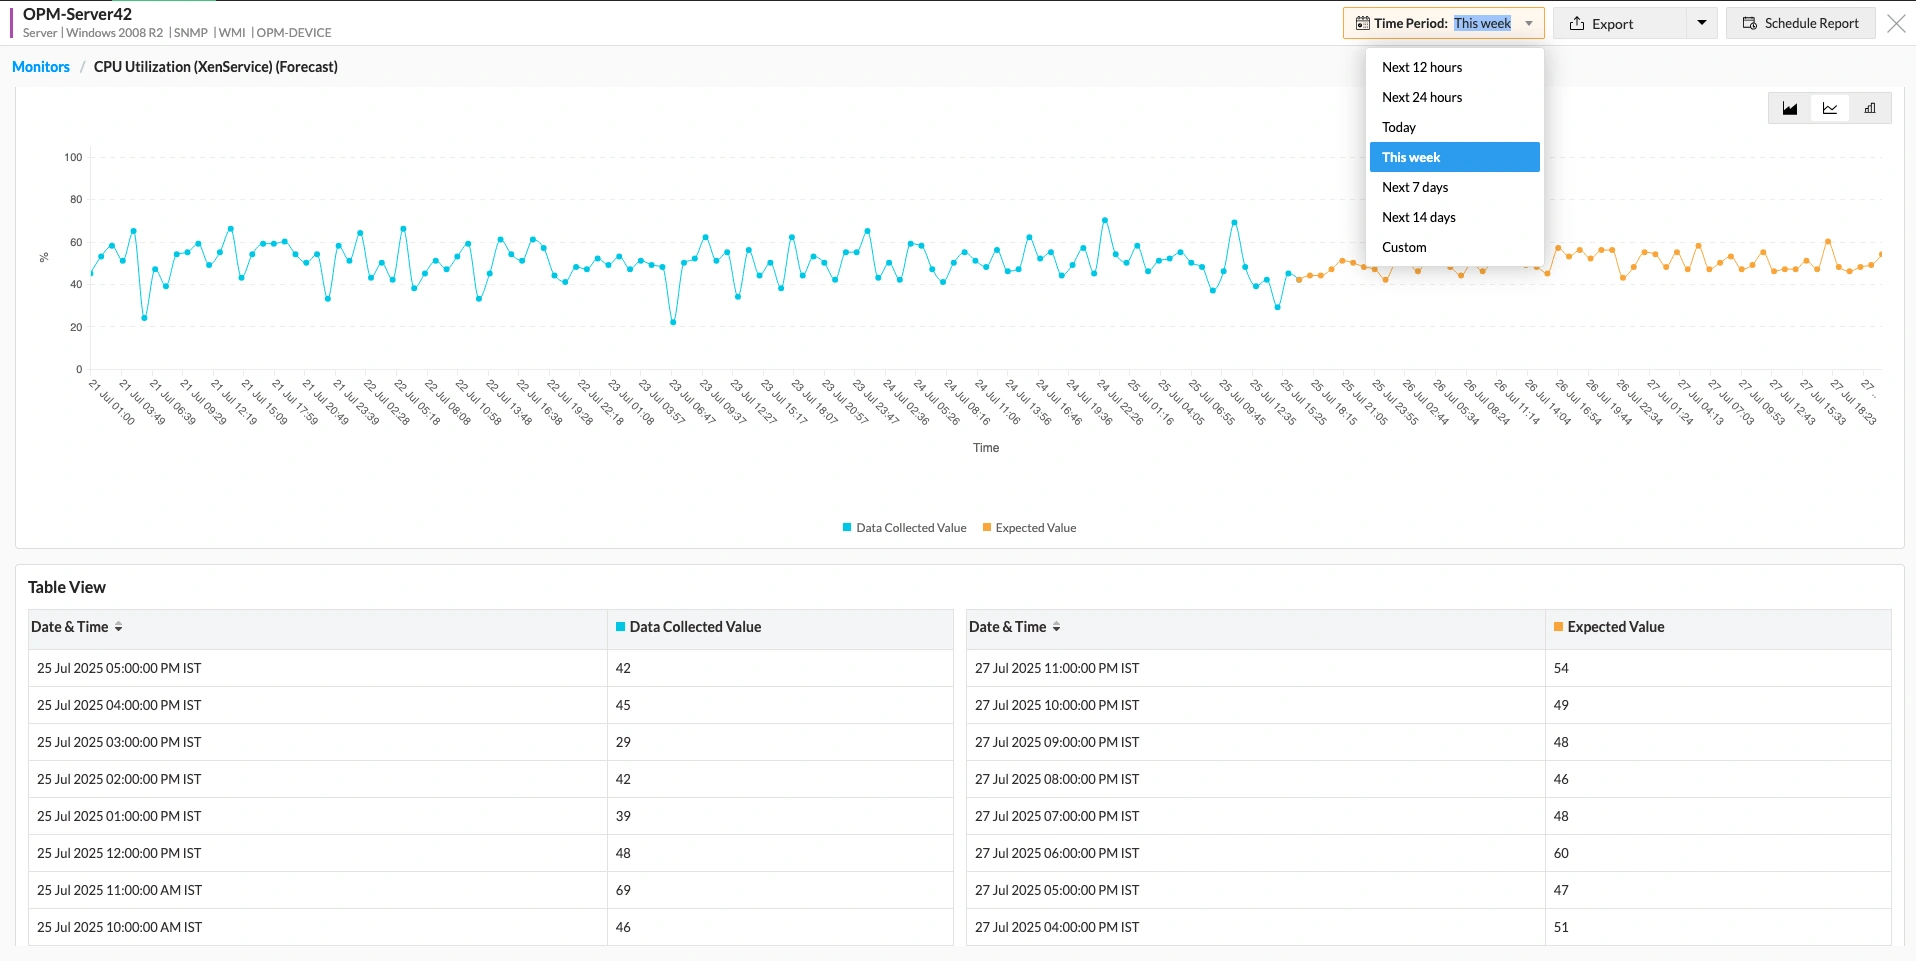
OpManager's machine learning engine ingests monitored data and predicts all monitored metrics across all devices always
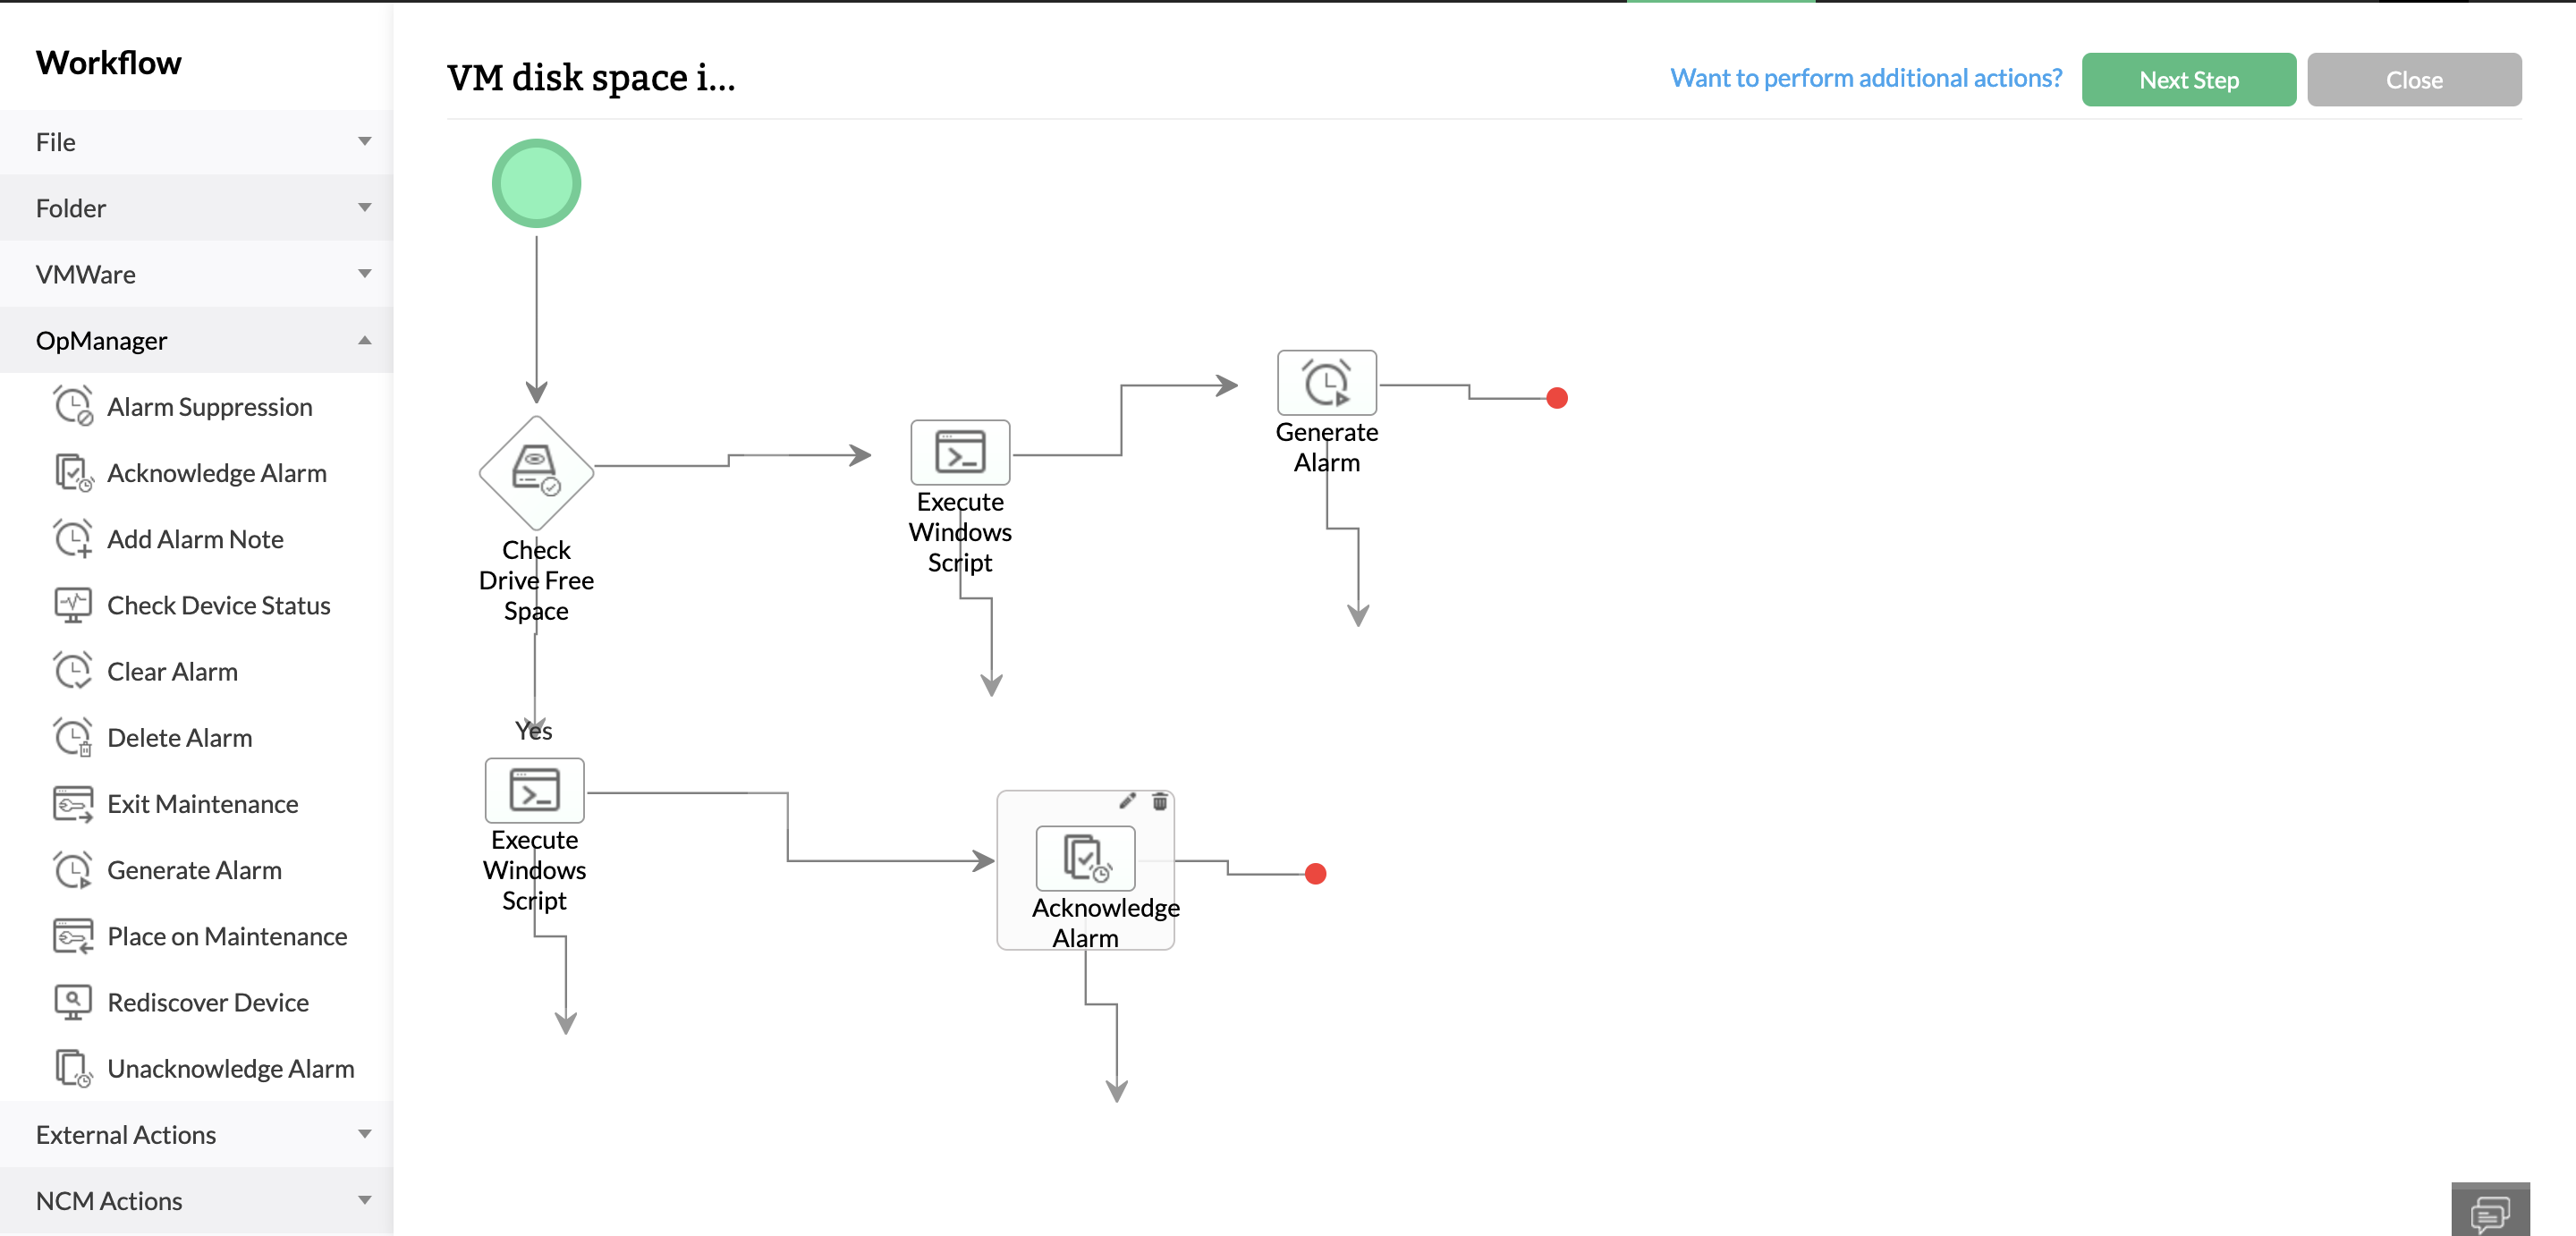
OpManager's automation features help you detect, escalate, respond, and manage incidents automatically
Manage large enterprise networks and networks distributed over multiple sites seamlessly by deploying probe servers
OpManager costs nearly half of Checkmk's enterprise pricing while offering a broader set of features
Monitor and manage configs, bandwidth, applications, firewall poliicies, compliance, and IP addresses from a single console
Although Checkmk has a free-to-use open-source version, you need to license their enterprise edition to enjoy most of the advanced features and product support. OpManager delivers better ROI and functionalities at close to 50% lesser prices!
| Number of devices/hosts | OpManager | Checkmk | ||
|---|---|---|---|---|
| One-time price (Perpetual license) | Yearly price (Subscription license) | Yearly price (Subscription license) | ||
| 100 | $2,845 | $1,145 | $2,464 | |
| 250 | $6,595 | $2,645 | $4,155 | |
| 500 | $9,595 | $3,845 | $7,041 | |
| 1000 | $14,995 | $5,995 | $11,613 | |
OpManager provides visibility into the network, server, and storage systems and uses AI-powered monitoring and automated workflows to improve service quality and incident response. This is not limited to the network and infrastructure layers, IT teams can also leverage OpManager's in-product add-ons to gain full-stack observability and unify IT management from a single console.
| Functionality | OpManager | Checkmk |
|---|---|---|
| Templates for automated device classfication | 11,000+ | 2,000+ |
| Network & IT infrastructure monitoring | Agentless/agent-based | Relies on agents for advanced monitoring |
| Automated IT incident response | Script-less | Script-based |
| Network configuration management | In-product add-on | Not available |
| Compliance monitoring | In-product add-on | Not available |
| Firewall rule & log analysis | In-product add-on | Not available |
| Network traffic & flow analysis | In-product add-on | Third party add-on |
| IPAM & switch port management | In-product add-on | Not available |
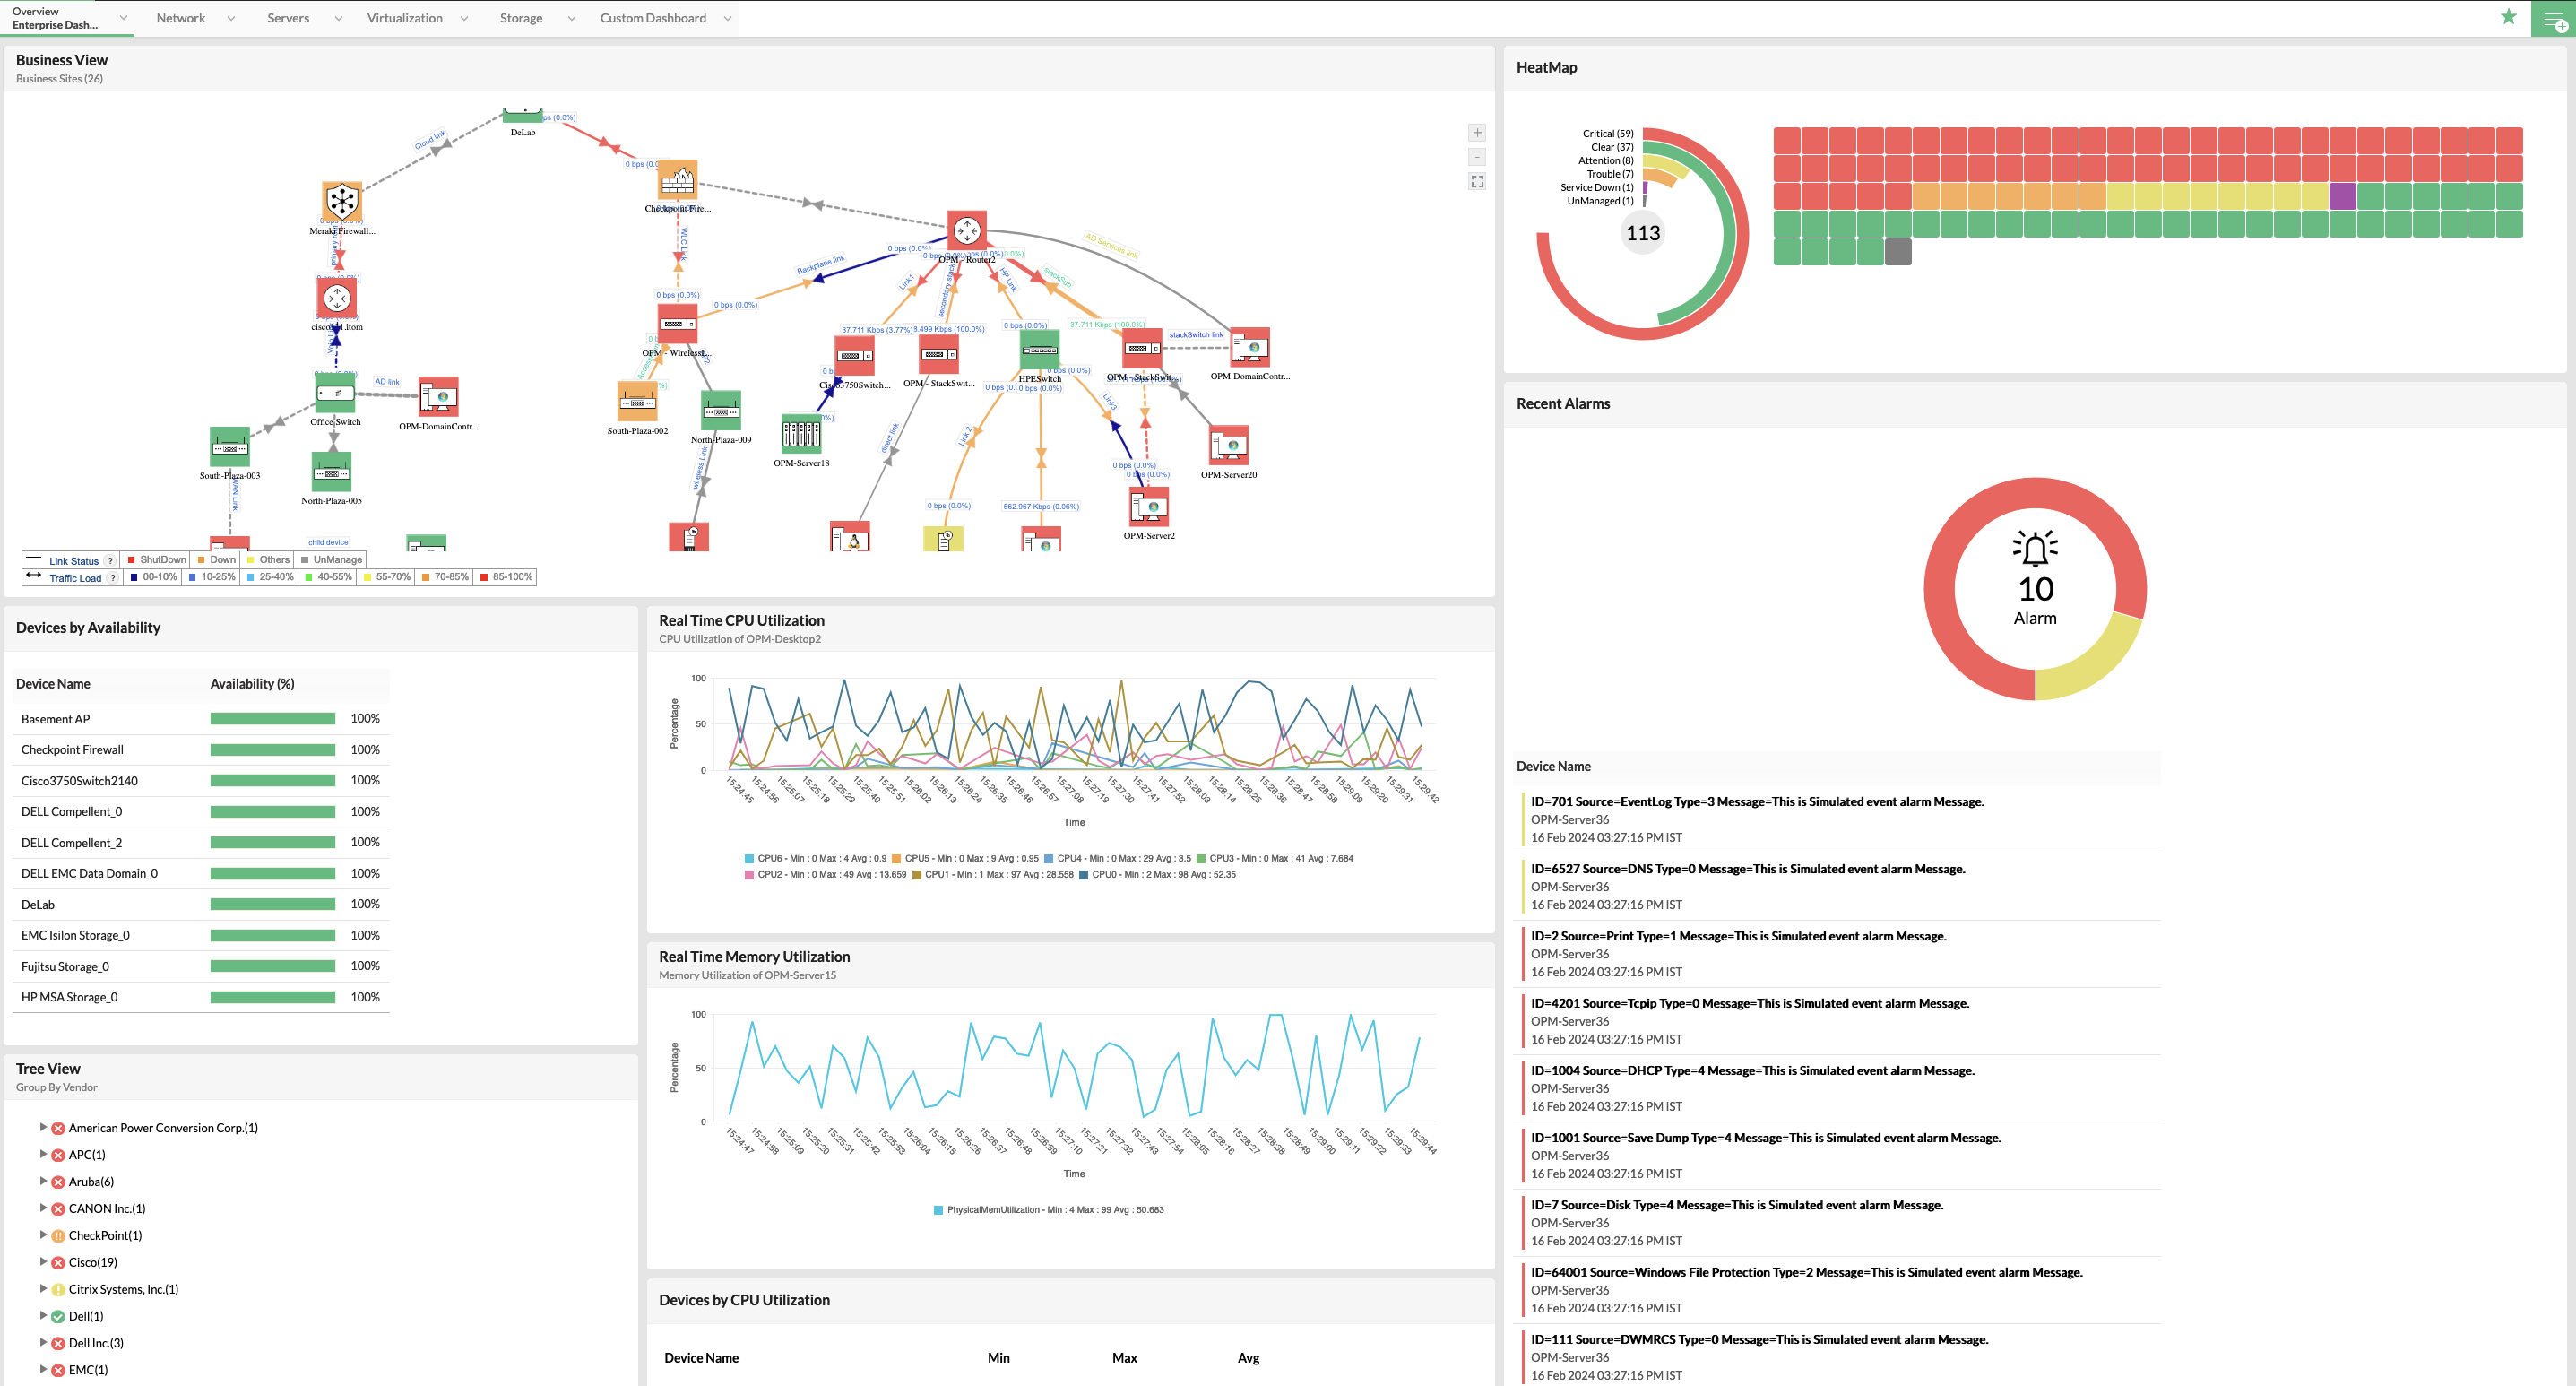
Monitor network devices, interfaces, and traffic across the LAN, WAN, wireless, virtual, and storage networks.
Monitor physical and virtual servers across your infrastructure with dedicated performance metrics. Track active processes, services, free space, files, folders, and URLs.
Monitor RAIDs, tape libraries and FC switch devices used in your storage area networks with in-depth insights into metrics like disk space, LUN space, Input and Output operations.
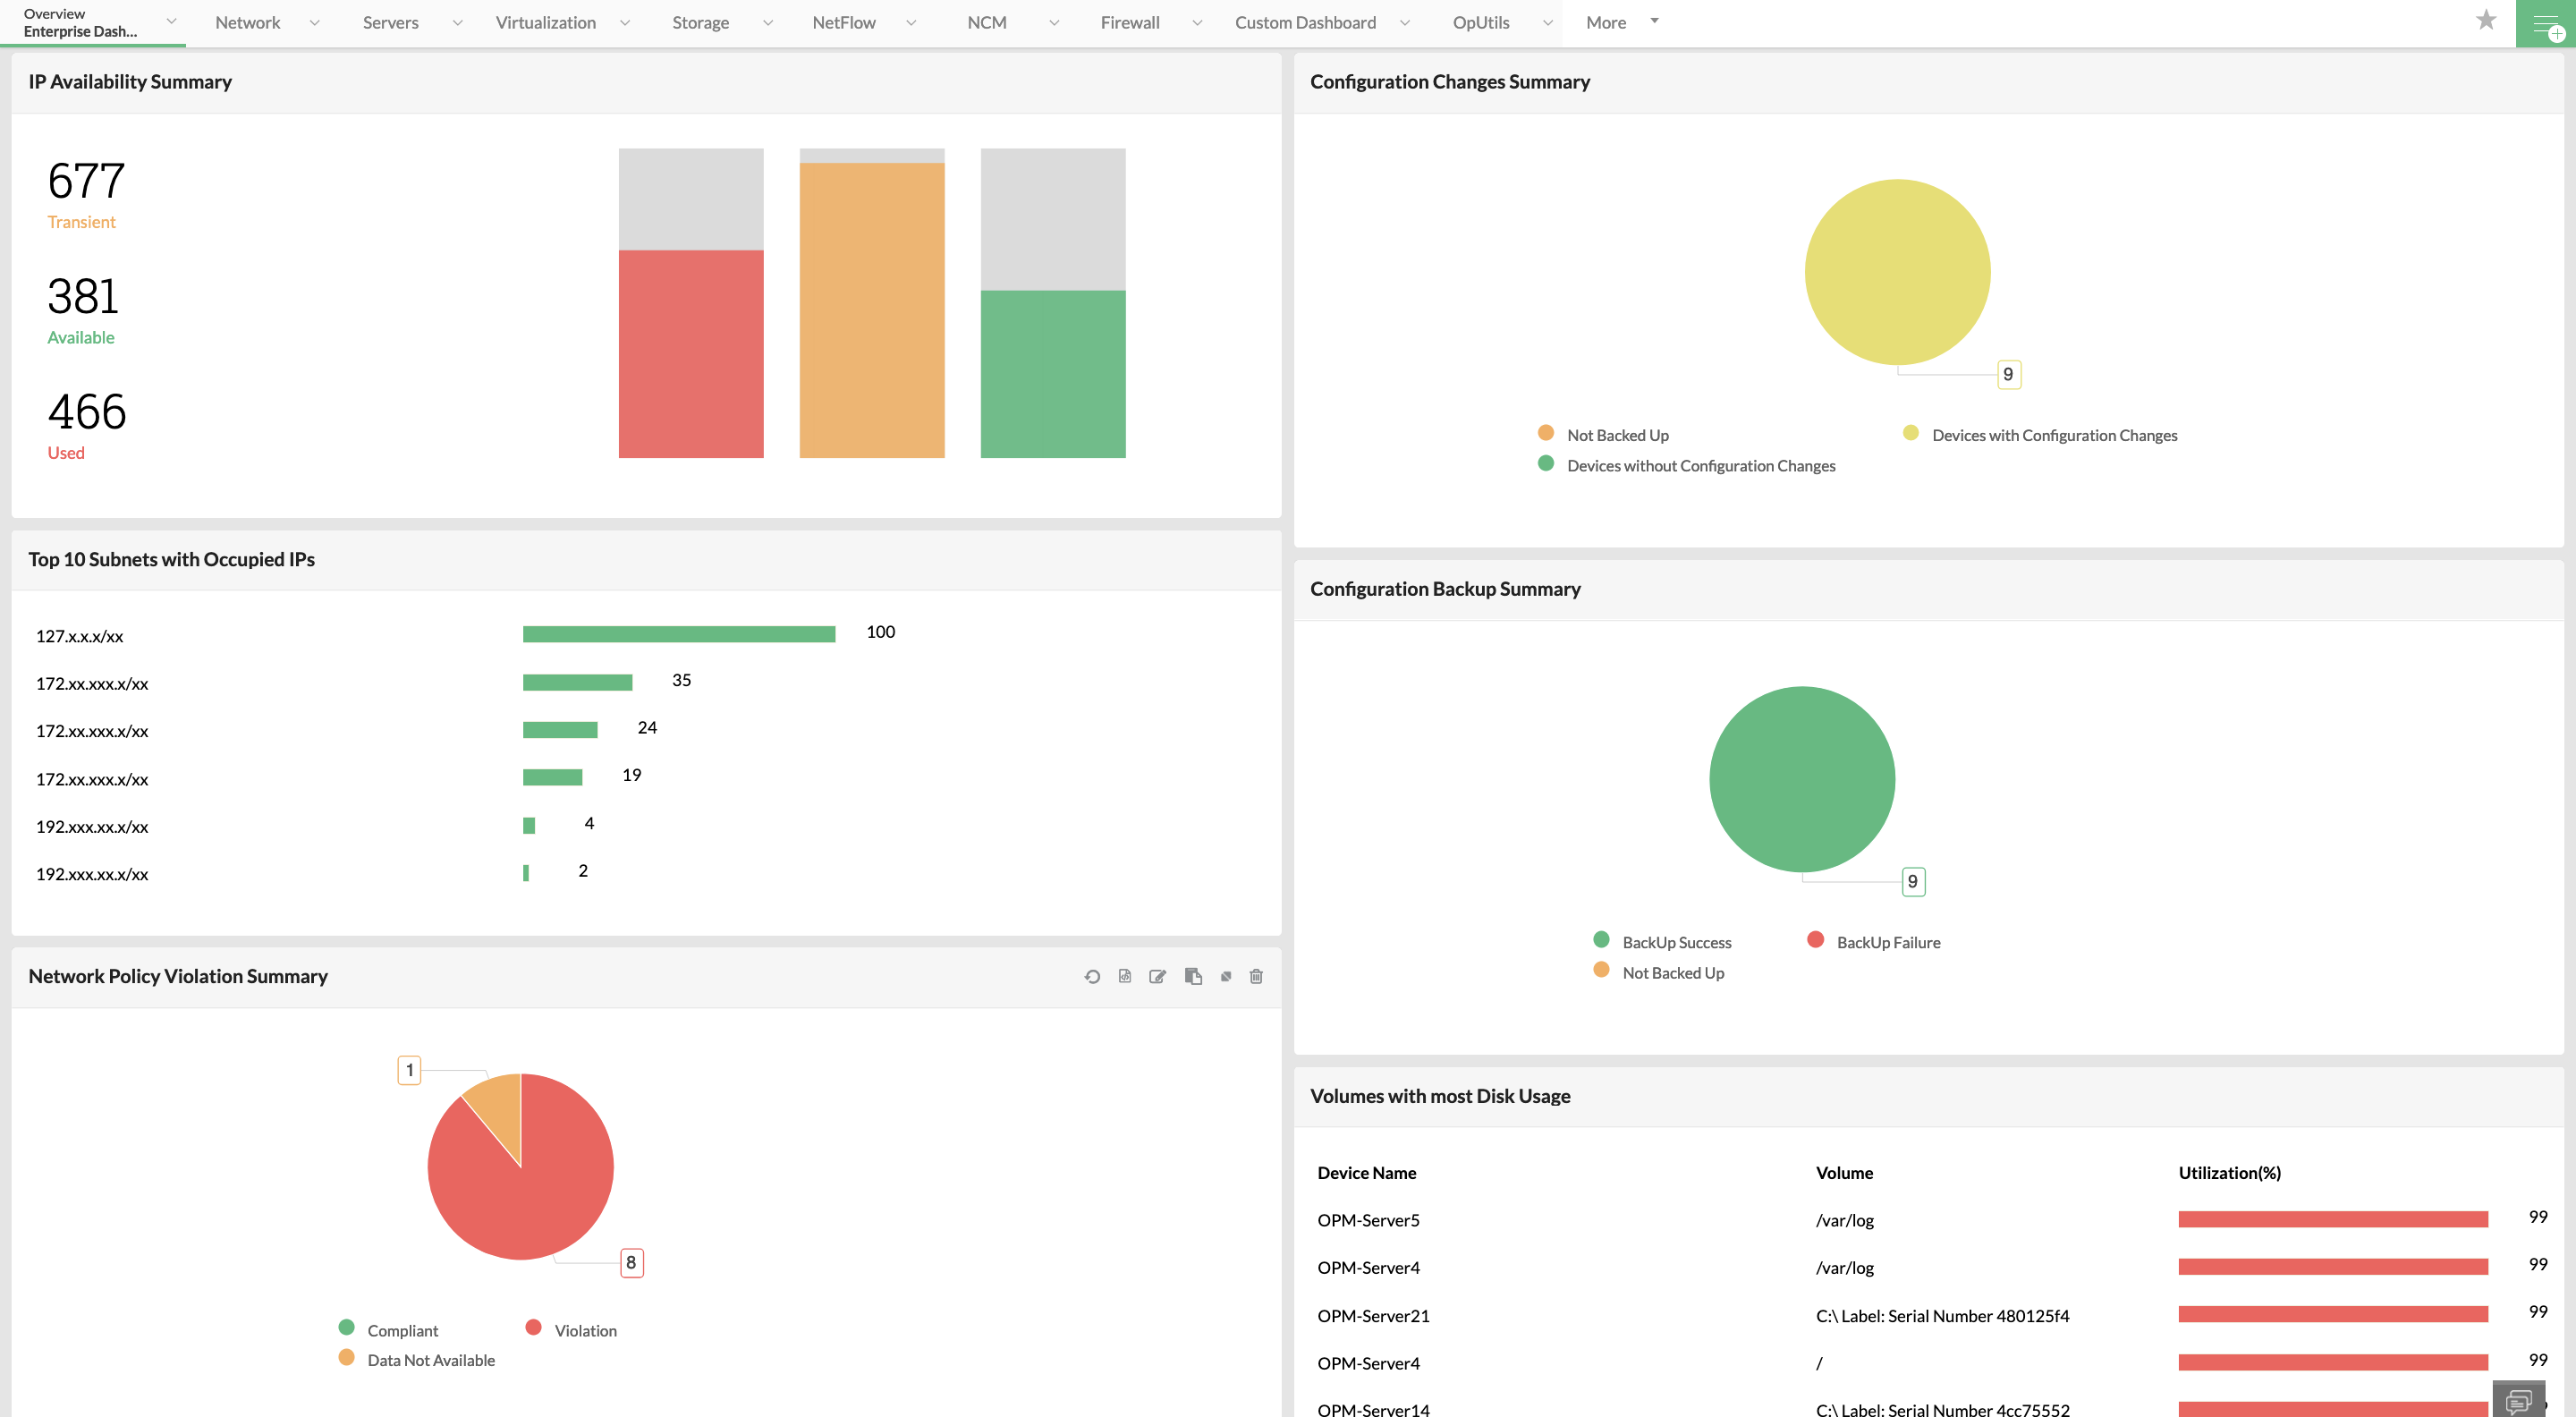
Schedule backups, track config changes, set baselines, review config changes and perform quick rollbacks for your network devices to ensure business continuity.
Manage network access by monitoring and optimizing firewall policies. Get insights into firewall rules, anomalies, fine-tune rules, and review rule impact.
Manage IP subnets and addresses across your organization. Review IP address allocation, review IP conflicts, monitor DHCP servers, and map switch-ports.
OpManager automatically discovers and classifies your devices and auto-curates performance monitors for them.
Fine-tune alarms and alarm management to enrich fault identification. OpManager sets alarms, escalates, correlates, and notifies alarms automatically based on pre-set rules and criteria.
Initiate incident response by automatically raising tickets on your helpdesk tools or by notifying group chats using seamless integrations.
Execute multi-step, outcome-based, code-free automation workflows to automate troubleshooting and fault remediation.
Predict, calculate, set, and update multi-level alarm thresholds with an in-built adaptive ML engine. Minimize alarm floods and improve anomaly detection.
Leverage ML driven data analytics to forecast monitored performance metrics. Predict performance metrics hours, days, and weeks into the future.
Perform informed capacity planning by tracking the number of days left till critical system resources like CPU, memory, or disk space runs out.
Map service-delivery from the device level to the application level. Troubleshoot service outages by narrowing down whether the fault originated in app, database, server, network, or infrastructure level.
Leverage integrations with Google and Zoho maps to track your distributed infrastructure from an interactive global map.
Create rack views of servers and add the racks to a 3D or 2D representation of your datacenter floors.
Drag and drop devices to a customizable interface to map business critical devices, data flow, and distributed sites.
Senior network admin, Manufacturing industry, US

This page highlights ManageEngine OpManager as an alternative to Checkmk. This page is compiled from the information available on Checkmk's website. We have made every attempt to ensure the accuracy and reliability of the information provided. However, the information is provided "as is" without warranty of any kind. ManageEngine is not liable for any inaccuracies in the page due to changes made on Checkmk's website or any development made to Checkmk's product subsequent to the date of publication of this page. Please refer Checkmk's website for more information.
Reviewer Role: Infrastructure and Operations
Company size: 500M - 1B USD
We have been using OpManager since 2011 and our overall experience has been excellent. The tool plays a vital role in providing the value to our organization and to the customers we are supporting. The support is excellent and staff takes full responsibilities in resolving the issues. Innovation is never stopping and clearly visible with newer versions.
Reviewer Role: Infrastructure and Operations
Company size: 5,000 - 50,000 Employees
I have a long standing relationship with ManageEngine. OpManager has always missed one or two features that would make it truly the best tool on the market, but over it is the most comprehensive and easy to use the product on the market.
Reviewer Role: Program and Portfolio Management
Company size: 500M - 1B USD
The vendor has been supportive during the implementation & POC phases providing trial licenses. Feature requests and feedbacks is usually acted upon swiftly. There was sufficient vendor support during the implementation phase. After deployment, the support is more than adequate, where the vendor could make some improvements.
Reviewer Role: CIO
Company size: 1B - 3B USD
ManageEngine provides a suite of tools that have made improvements to the availability of our internal applications. From monitoring, management and alerting, we have been able to peak performance within our data center.
Reviewer Role: Enterprise Architecture and Technology Innovation
Company size: 250M - 500M USD
ManageEngine support was responsive to all our queries.

“OpManager helps me monitor all aspects of the data-center and equipment like servers, switches and routers. It is fast, intuitive and centralized and you do not need to be an expert to deal with OpManager.”
NGHA

“Donald Stewart, IT Manager of Crest Industries is happy with ManageEngine OpManager for its end-to-end network monitoring software. It is easy-to-use and offers fault and performance management for router.”
IT Manager, Crest Industries

“John Rosser, MIS Manager of Yale Chase talks about the proactive nature of ManageEngine OpManager & how his organisation gained value from it.”
MIS Manager