WAN Monitoring Software
Monitor WAN link availability, latency, traffic, and service level agreement (SLA) compliance with ManageEngine OpManager.
- WAN ISP SLA monitoring
- Multi-channel WAN alerts
- Comprehensive SD-WAN monitoring
What is WAN monitoring?
WAN monitoring is the process of monitoring and optimizing wide area network (WAN) connections between remote offices, datacenters, and cloud services. WAN monitoring tools provide real-time visibility into round-trip time (RTT), packet loss, and bandwidth usage, helping IT teams identify and resolve performance issues before they impact business-critical applications. ManageEngine OpManager is a network monitoring software with enterprise-grade WAN monitoring capabilities.
OpManager's WAN monitoring capabilities
Monitor multi WAN links and distributed sites
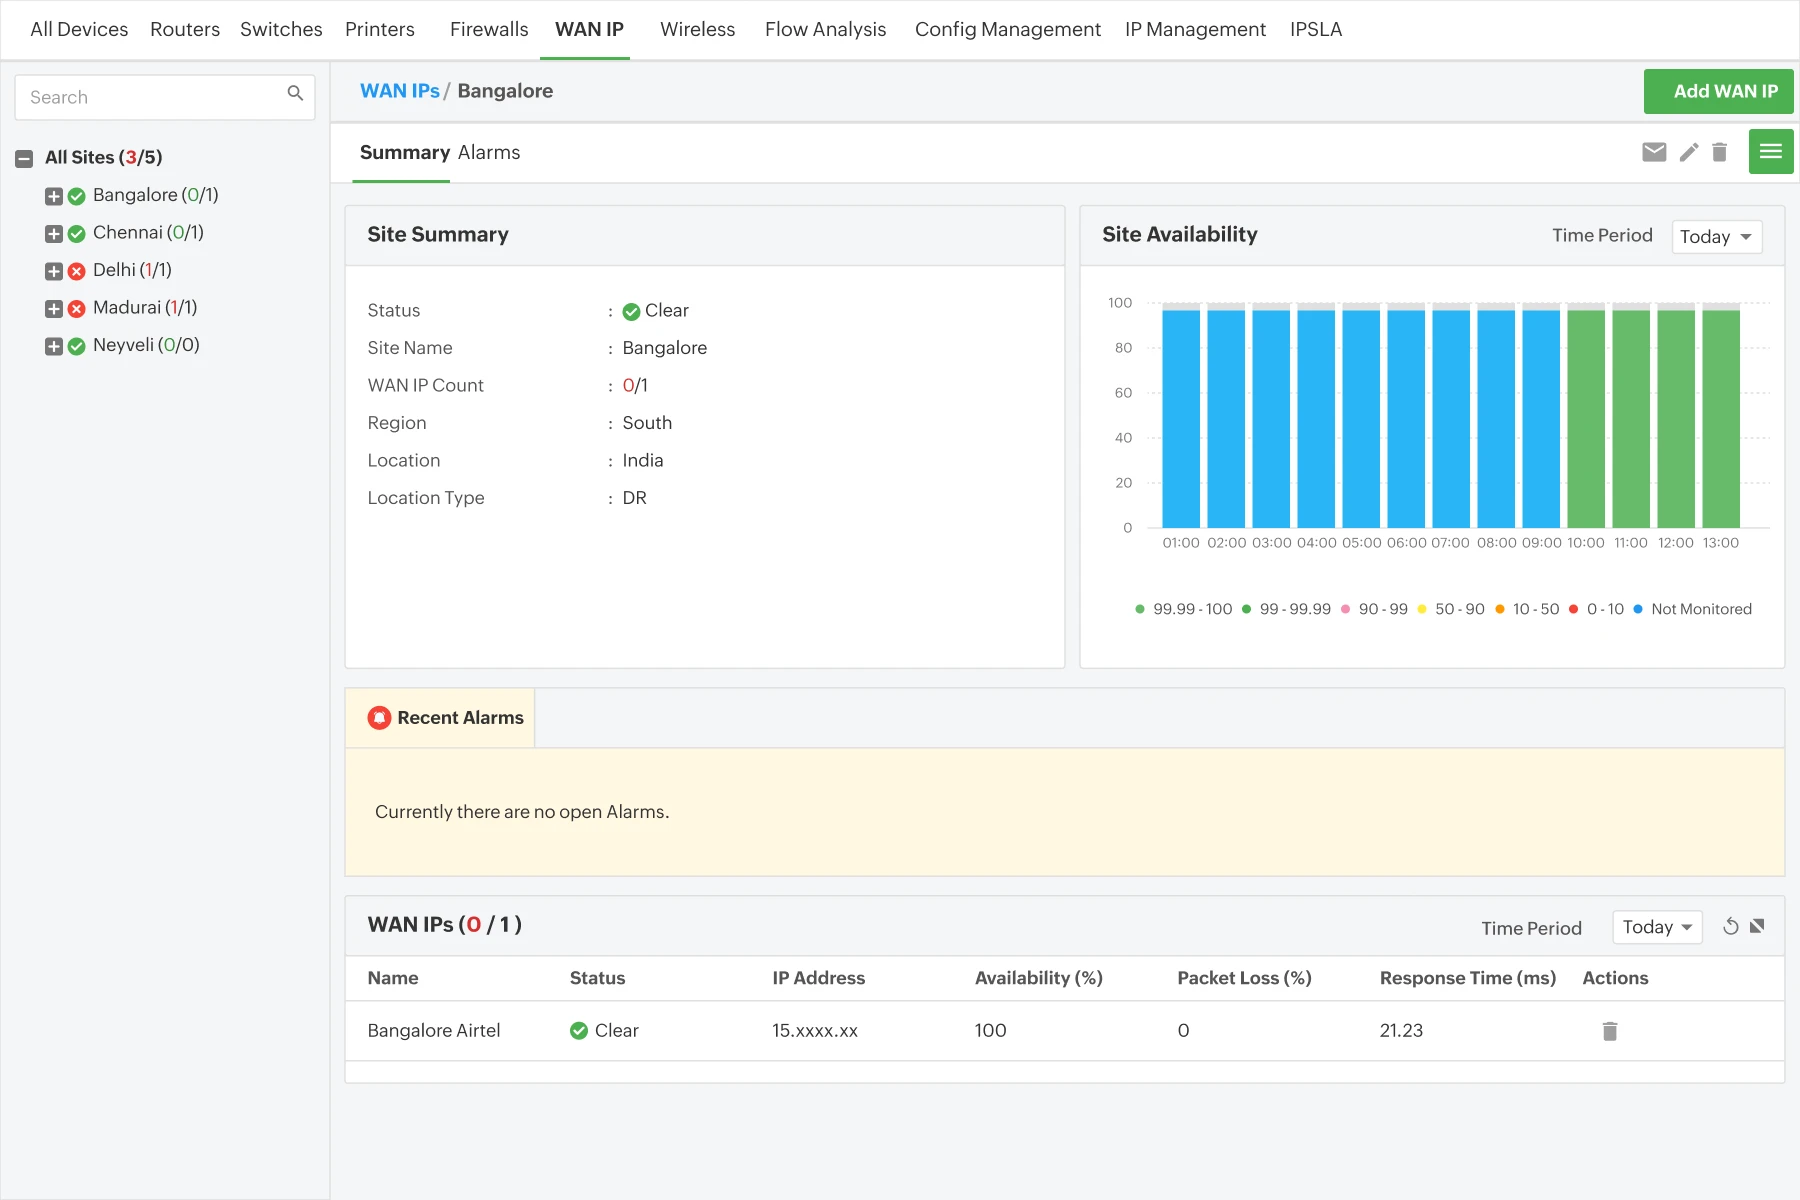
- Discover WAN IPs and classify them based on site location and ISP types to keep tabs on your organizational WAN architecture.
- Track WAN IPs, ISP types, link technologies (MPLS, leased line, NLD, etc.), bandwidth, and SLA limits in a single pane of glass.
- Configure severity-specific WAN alarms to warn you when a single or multiple WAN IPs in your organization fails.
Track ISP SLAs with WAN RTT monitoring
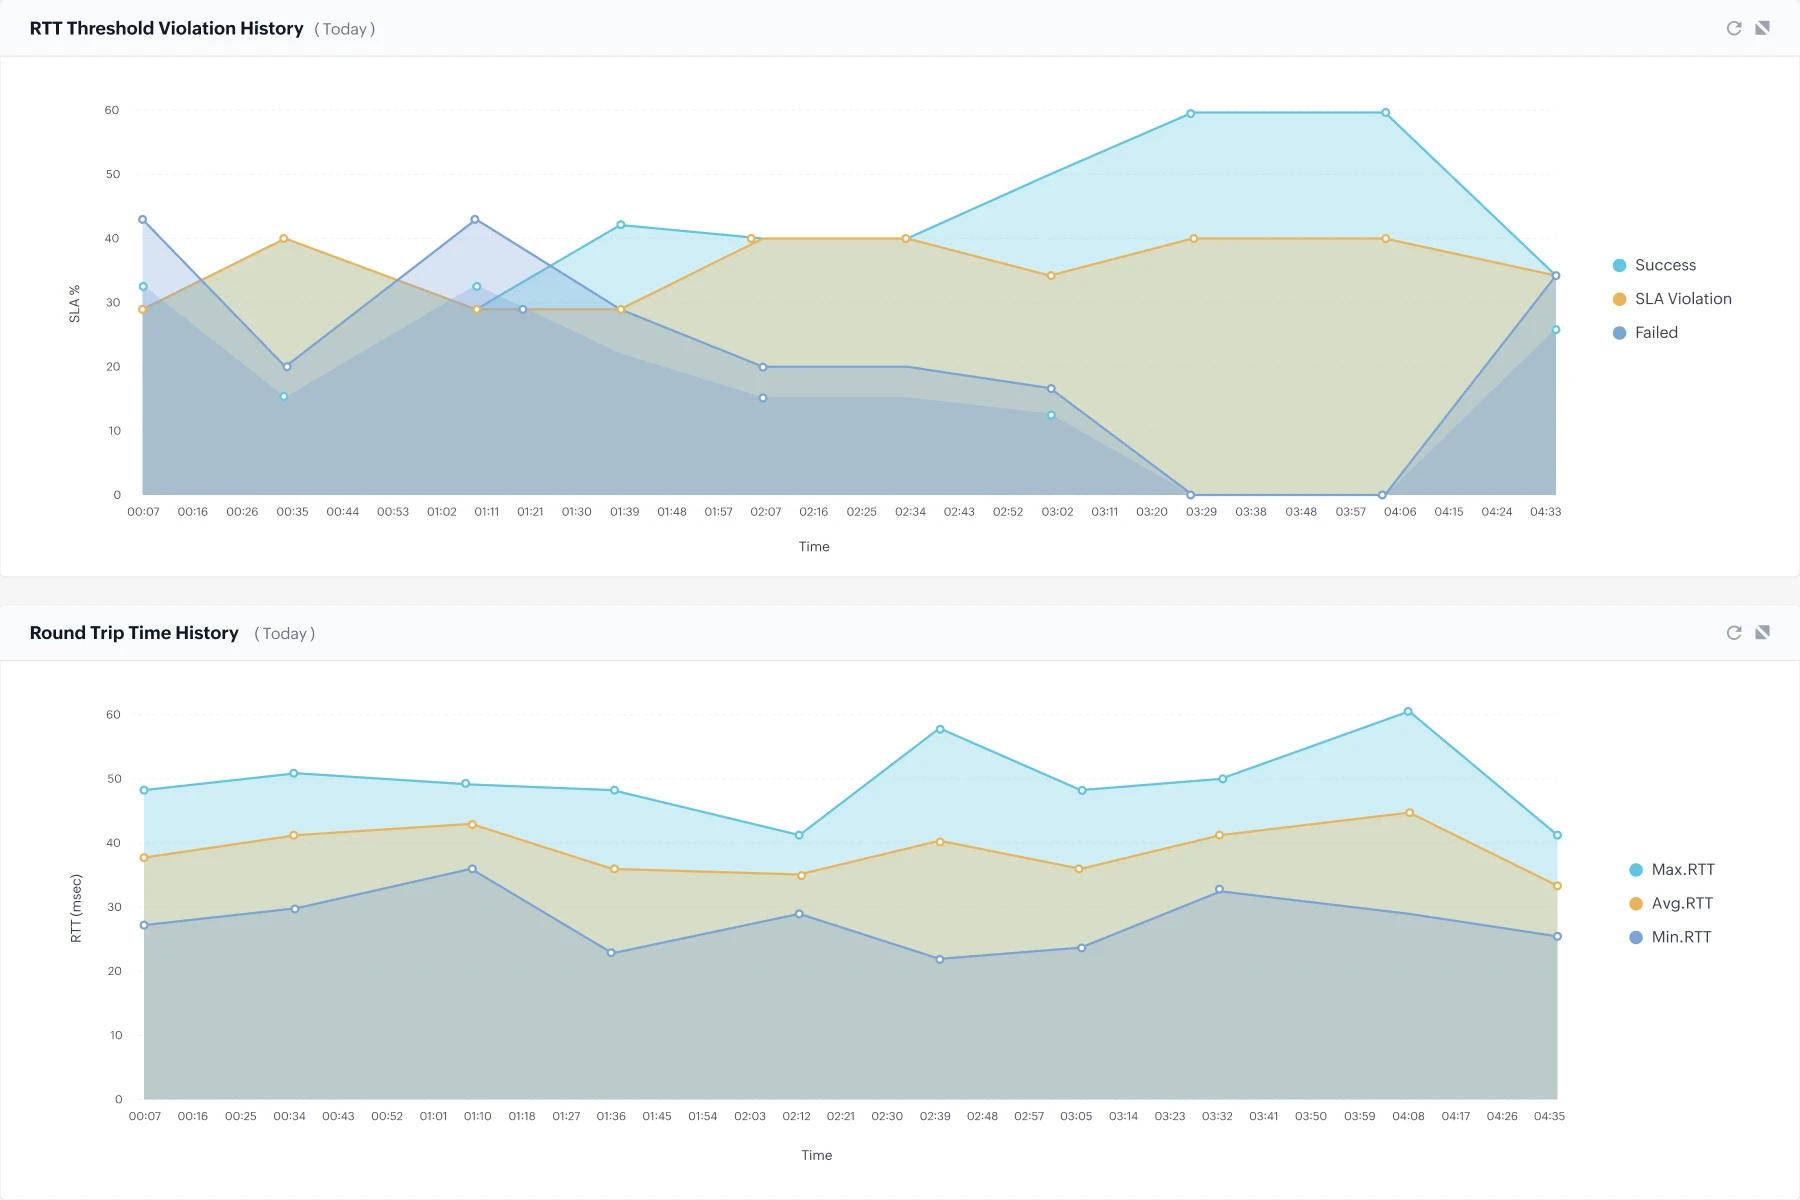
- Specify ISP-level WAN RTT SLAs to get notified when SLA violations occur.
- Track RTT statistics and with colour-coded graphs and dedicated reports to analyze SLA violation history.
- Get alerted for SLA violations with multi-channel notifications like SMS, email, Slack, Help desk tools, etc.
Pinpoint WAN issues with network path analysis
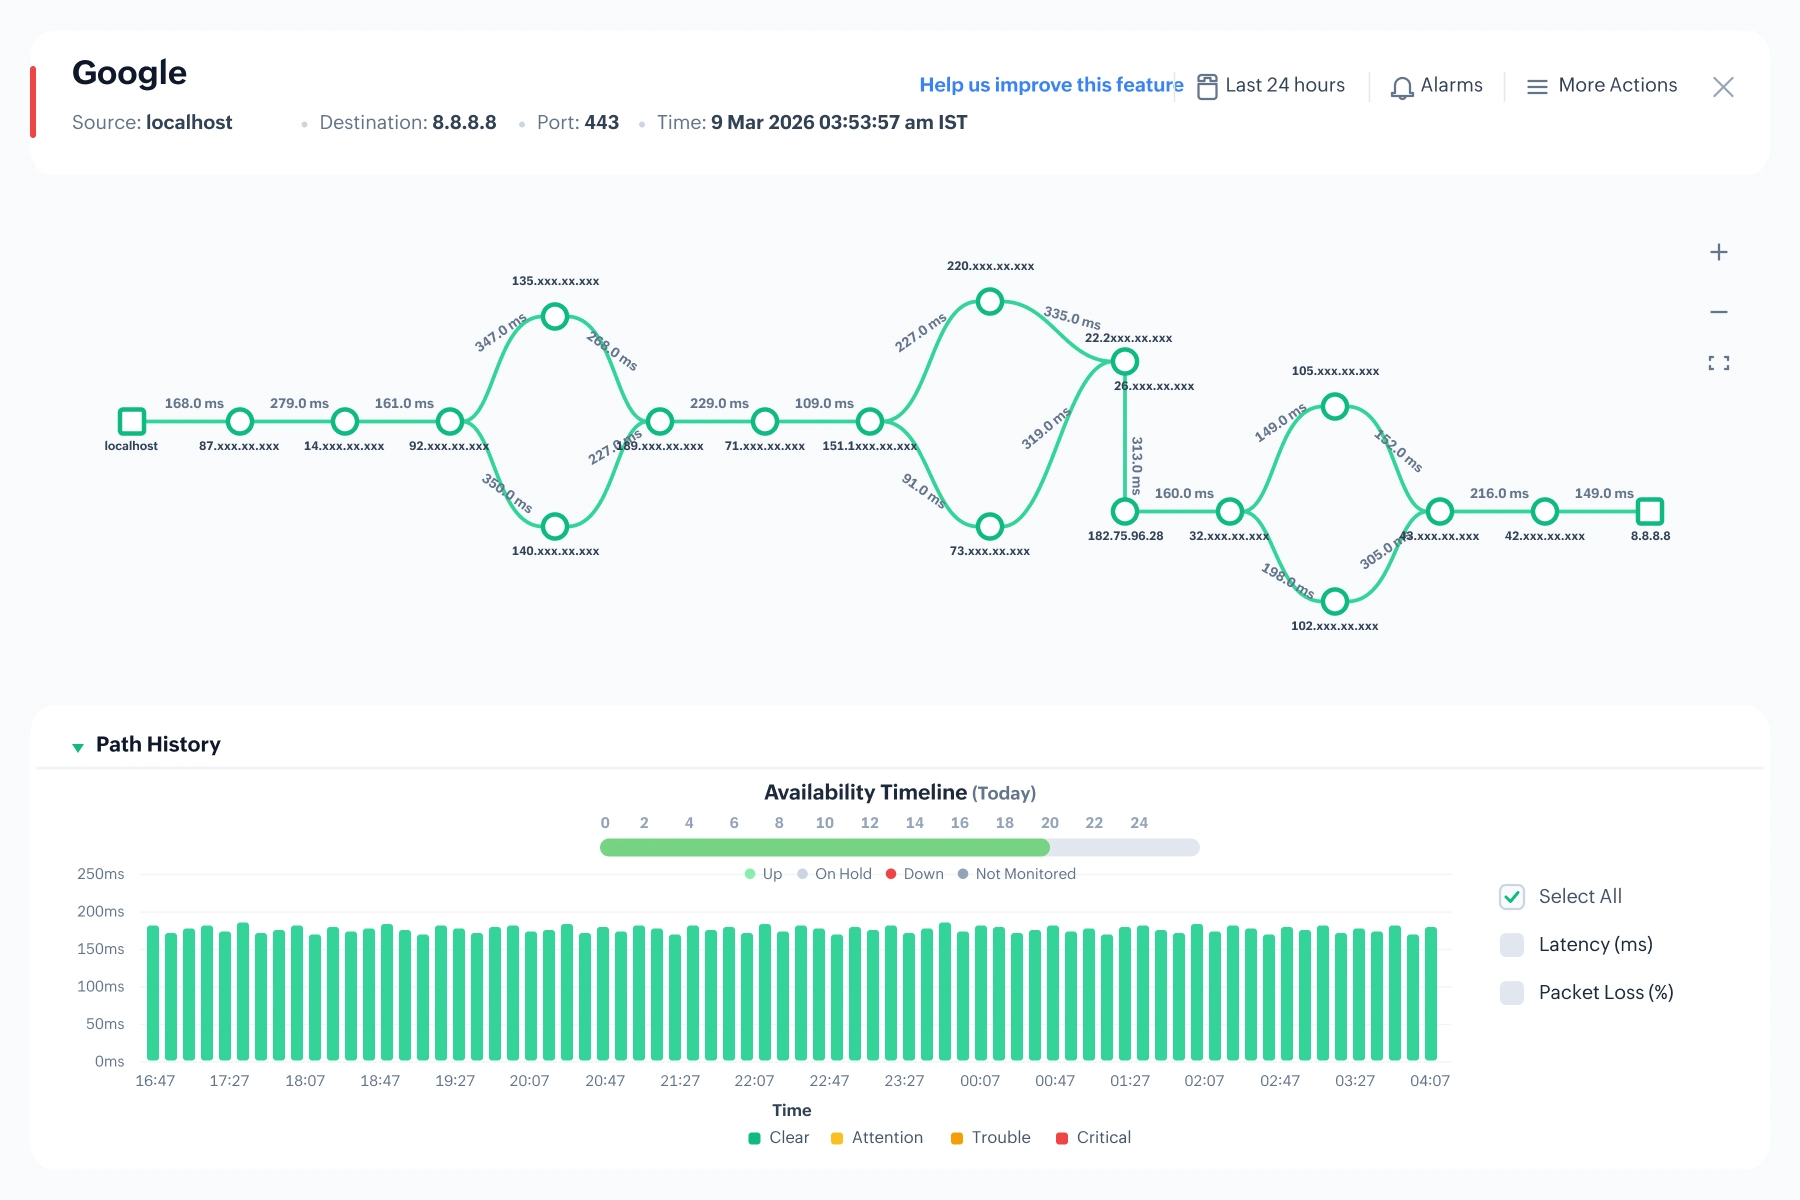
- Analyze WAN links visually on a hop-by-hop basis with network path analysis profiles.
- Monitor packet loss and response time for each hop in a WAN link to narrow down the exact cause of network issues.
- Set up alerts to warn you of abnormal spike in packet loss and response times.
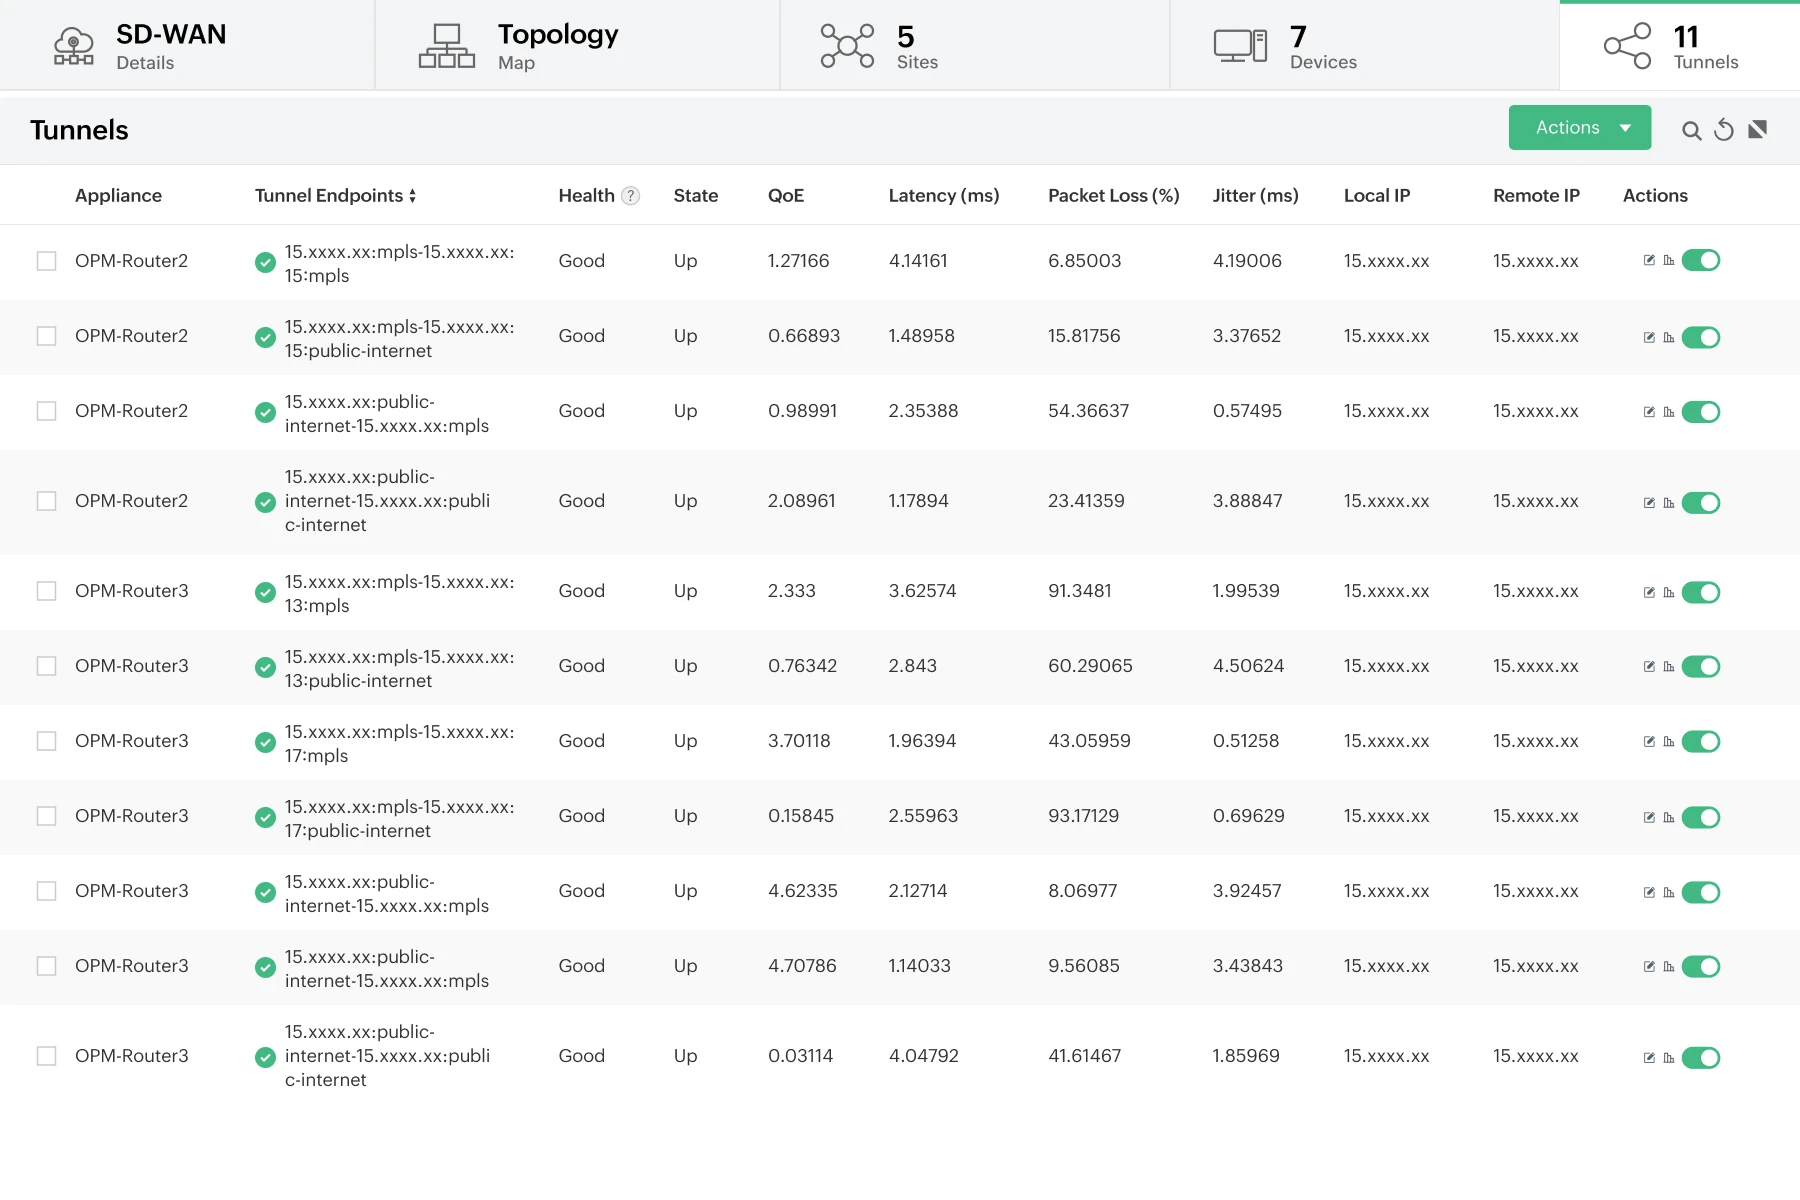
Manage SD-WAN overlays and underlays
- Gain visibility into SD-WAN controllers, sites, and edge devices with interactive topology maps.
- View SD-WAN sites and monitor the devices deployed within by monitoring their state and health.
- Monitor SD-WAN tunnels by tracking tunnel endpoints, state, quality of experience (QoE), latency, packet loss, jitter, health status, and more.
Optimize WAN uplinks with bandwidth management
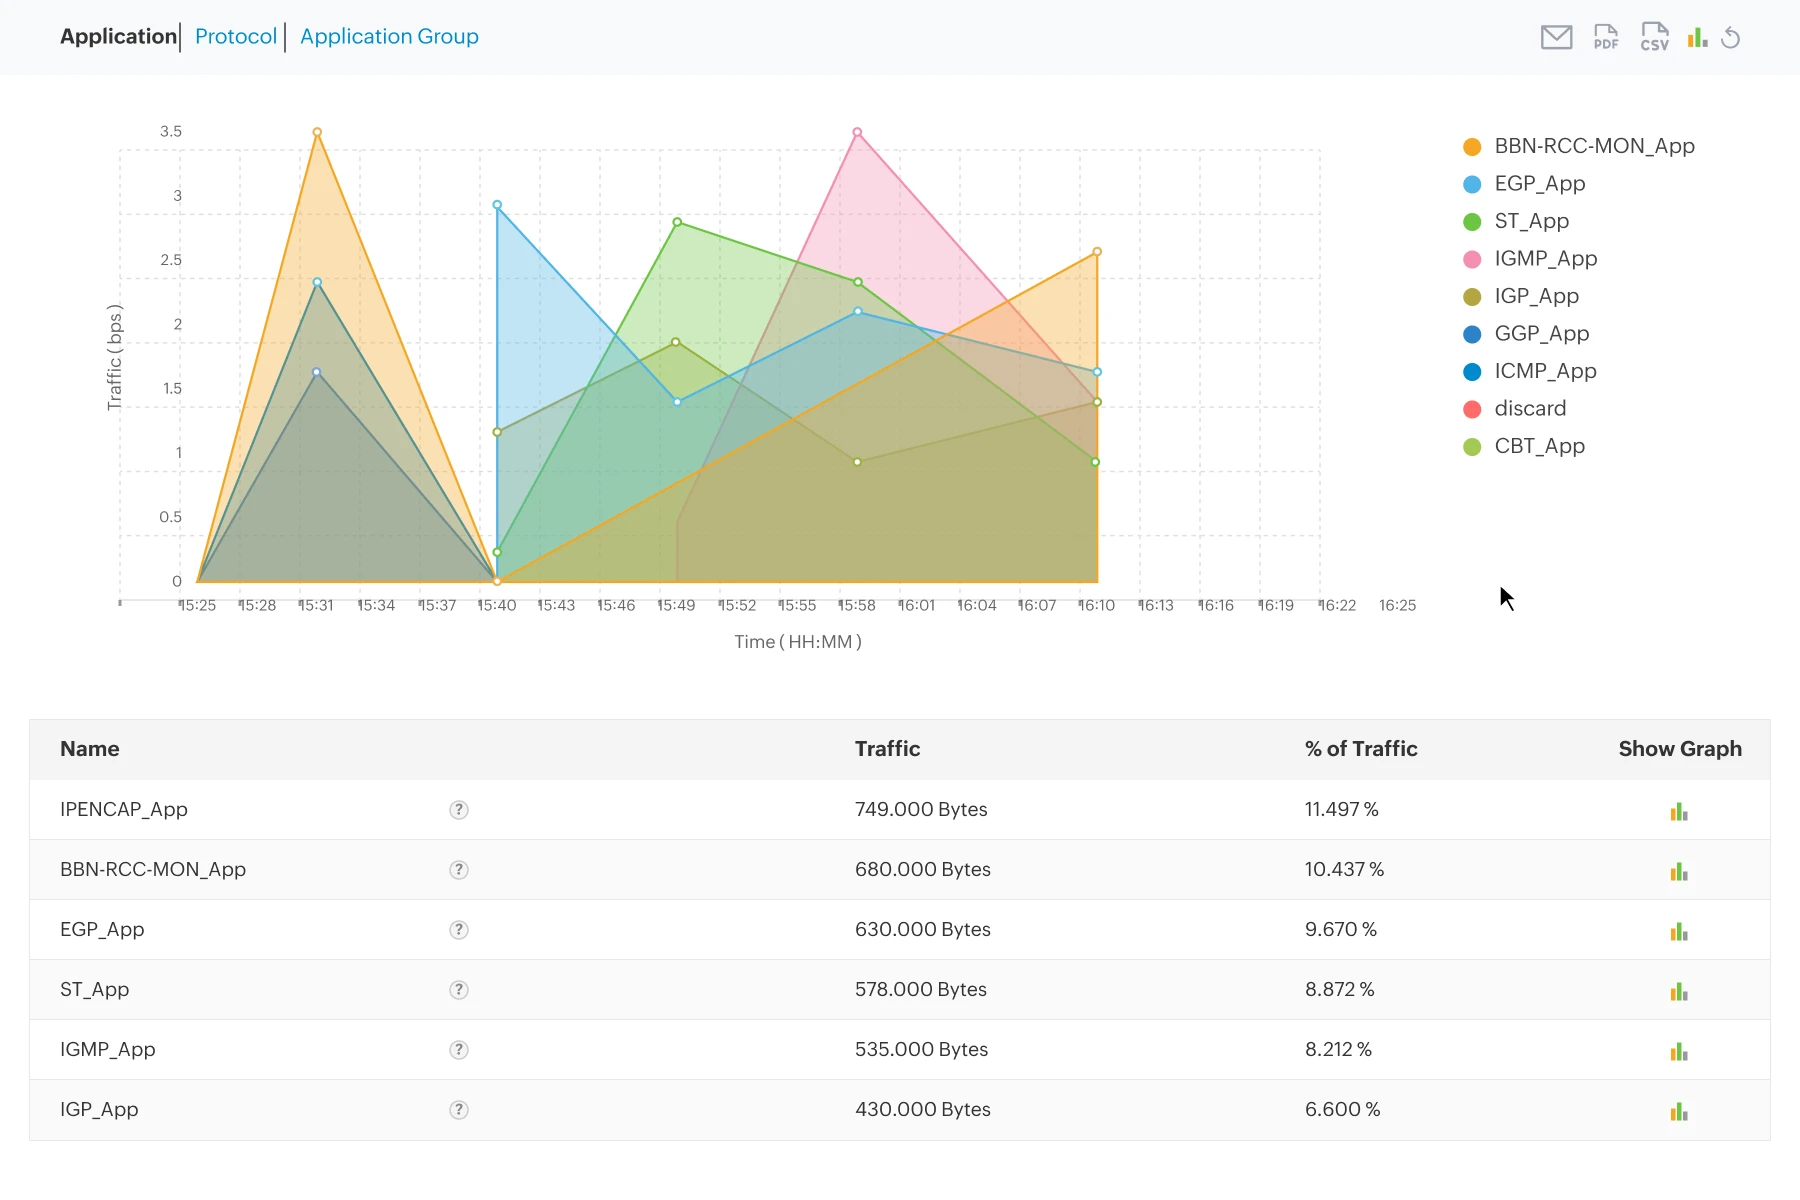
- Identify top bandwidth consumers, applications, and conversations utilizing your links with OpManager's NetFlow Analyzer add-on.
- Capture real-time traffic data with protocols like: NetFlow, sFlow, IPFIX, Netstream, J-Flow, and AppFlow.
- Prevent network congestion by implementing strict Quality of Service (QoS) monitoring policies.
Visualize WAN infrastructure with custom network maps
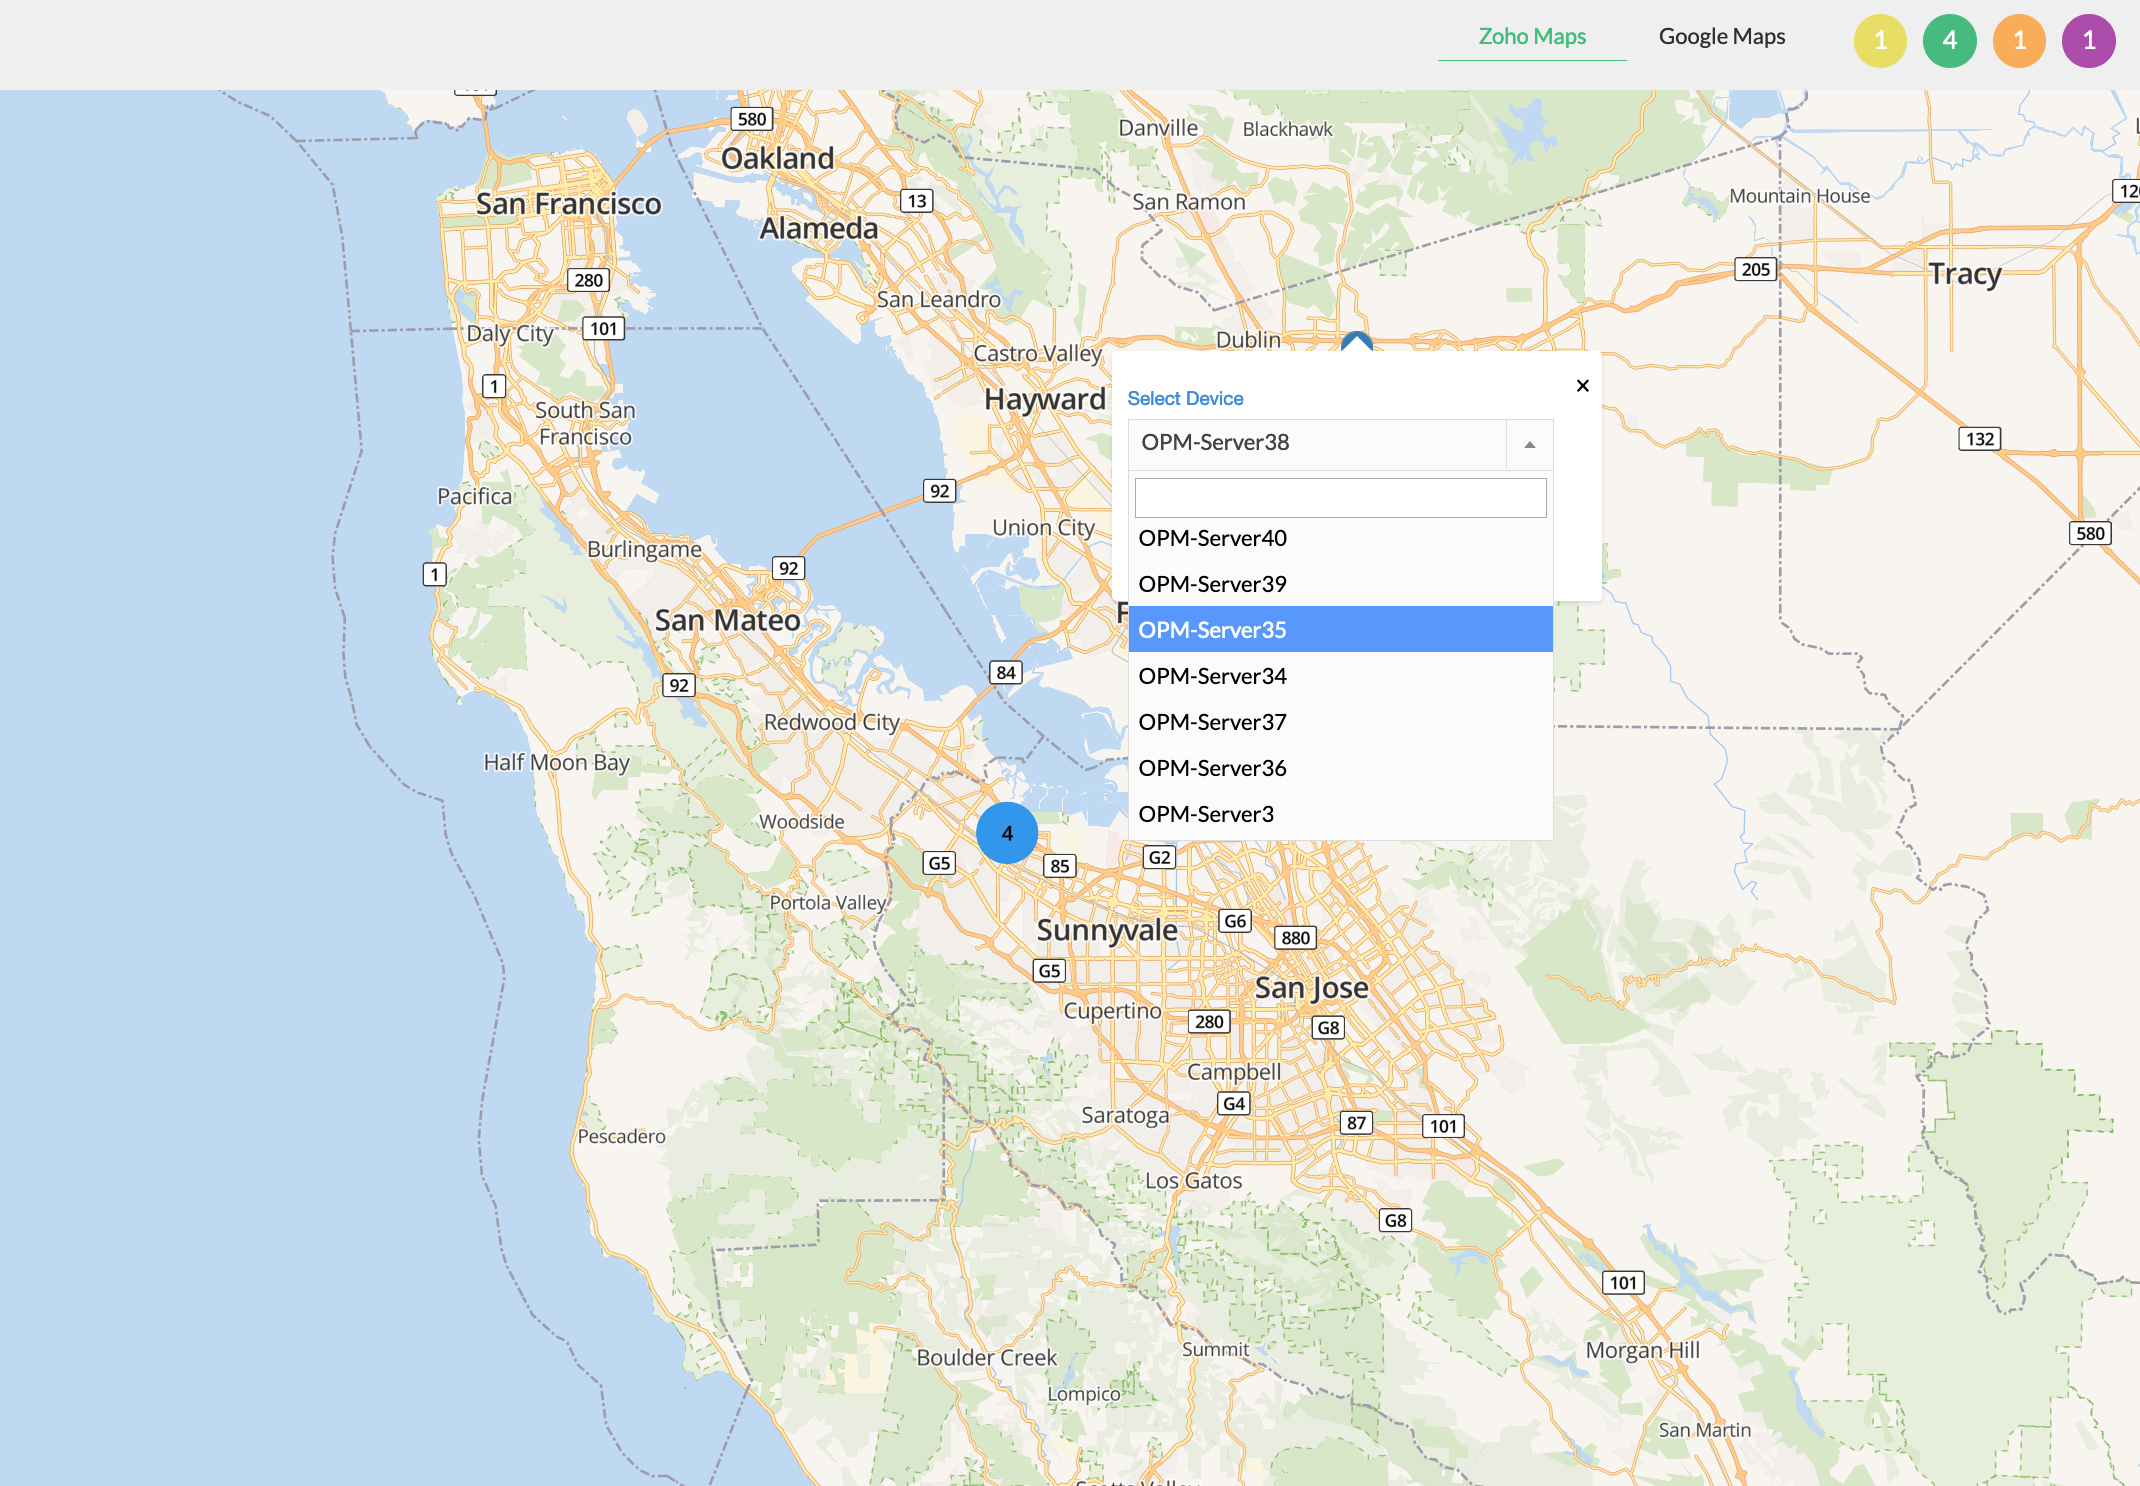
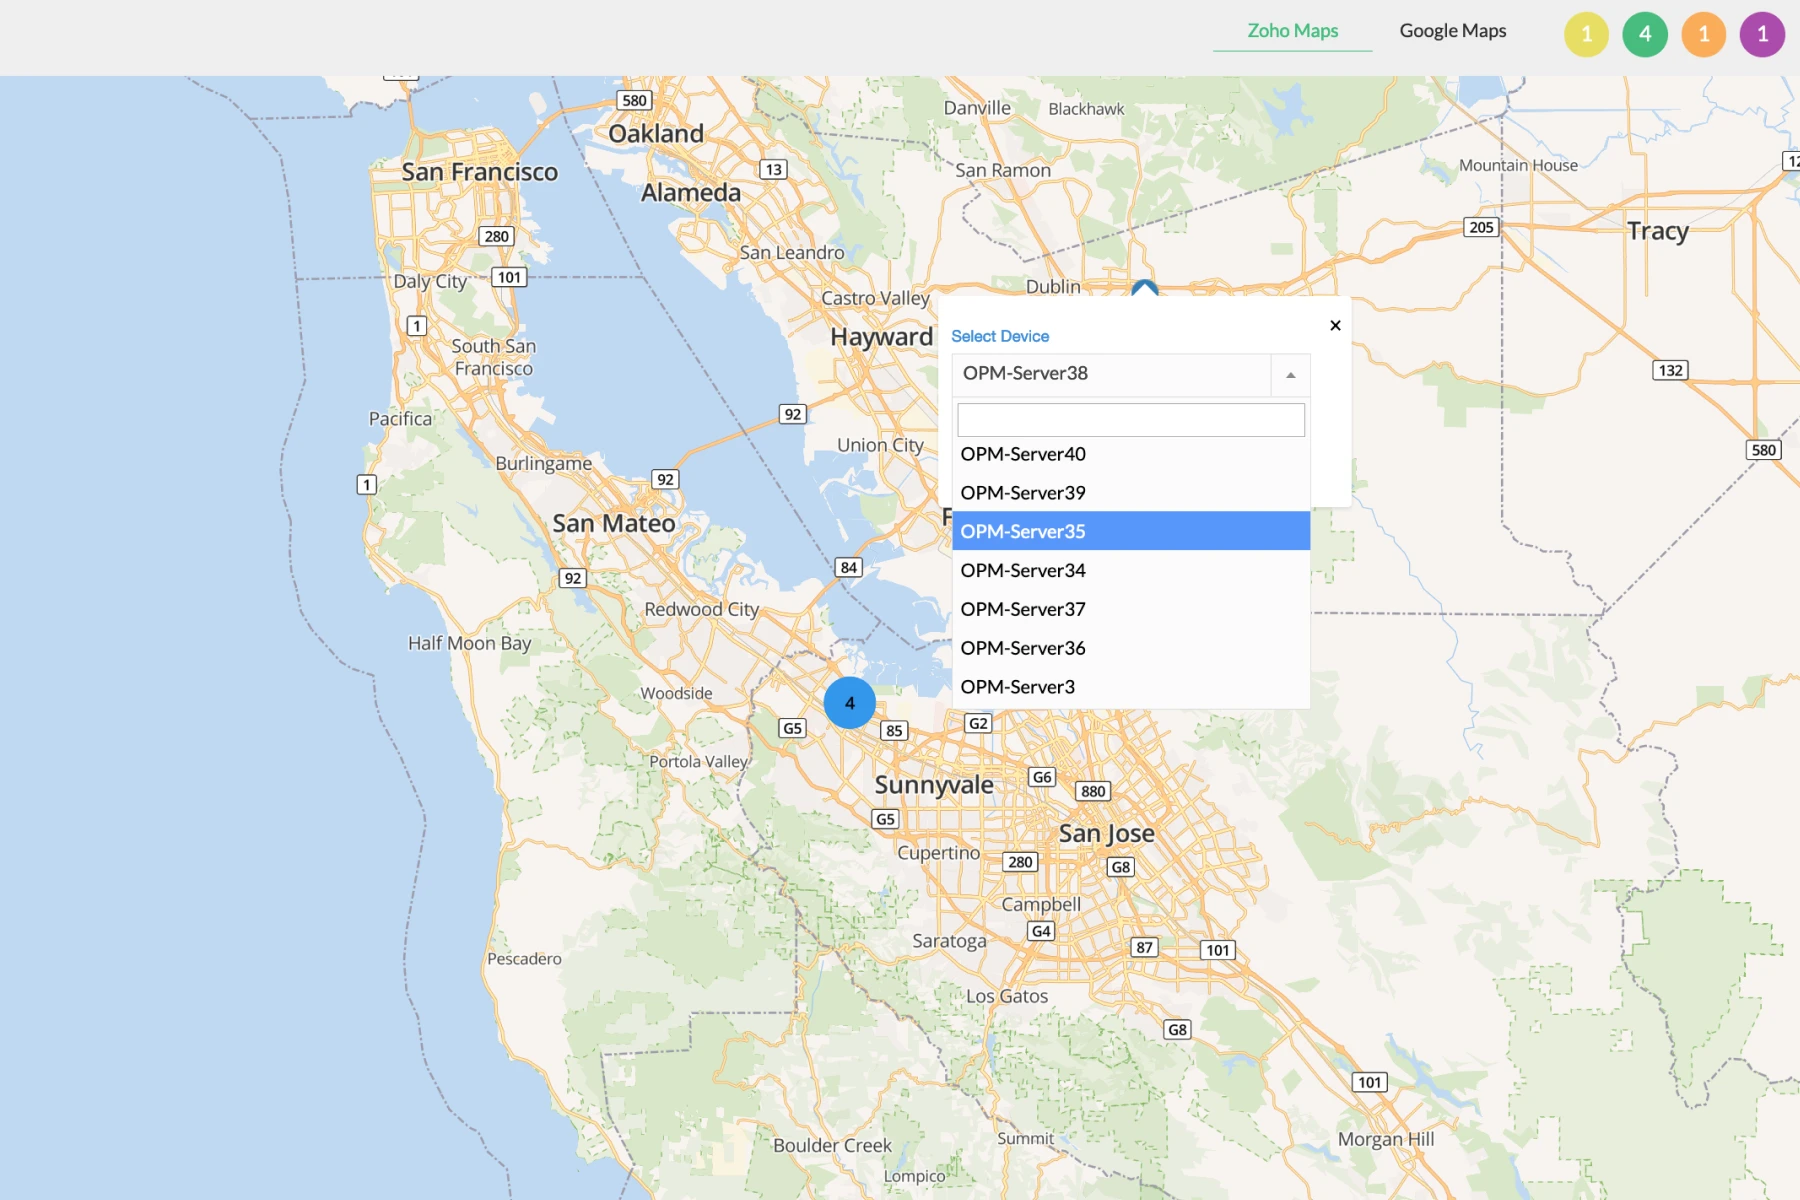
OpManager's custom mapping features help you to represent WAN infrastructure, like datacenters, branch offices, and WAN IP links visually.
- Mapped WAN elements are colour-coded to indicate their health status. Allowing you to monitor WAN elements in a single glance.
- OpManager's business views allow you to drag and drop WAN elements into a customizable background image.
- With Google and Zoho map integrations, you can drag and drop elements into an interactive world map.
Use cases for WAN monitoring in OpManager

Multi-branch retail monitoring
Maintain seamless storefront transactions and real-time inventory synchronization automatically, delivering the proactive link tracking your lean retail operations team needs to prevent costly checkout disruptions.
- Instant failover and downtime alerts: Configure real-time, contextual notifications that instantly alert off-site administrators via SMS the moment a primary broadband connection drops or a remote store goes offline.
- Network path availability mapping: Monitor essential network paths between local point-of-sale registers and central databases to catch performance dips before they halt customer checkouts.
Hybrid cloud WAN optimization
Track round-trip time and bandwidth utilization across your data paths, providing the deep traffic visibility your growing business demands to maintain peak application performance.
- Cisco IP SLA and WAN RTT monitoring: Measure the exact round-trip time (RTT) across your connections to identify whether latency bottlenecks occur internally or via ISP networks.
- Hop-by-hop network path analysis: Map out the exact route your data takes through the network, visually isolating the specific node or internal device where traffic drops or high latency occurs.
- Predictive resource capacity planning: Analyze historical utilization data across your WAN interfaces to accurately forecast exactly when critical link bandwidth will reach its physical limits.
VoIP quality assurance
Isolate complex distributed path faults instantly and optimize communication performance across the entire network, leveraging the intelligent automation your enterprise requires to maintain 24/7 business continuity.
- Real-time jitter and packet loss tracking: Monitor critical performance parameters like packet loss, jitter, and round-trip latency to catch voice and video stream degradation early.
- SD-WAN virtual tunnel monitoring: Gain comprehensive visibility into next-generation SD-WAN overlays, tracking path performance and tunnel status across vendors like Cisco and Fortinet.
Automated SLA violation alerting: Configure threshold-based parameters to instantly flag when connection latency or packet drops violate your contractual agreements, providing the data needed to address service drops.
FAQs on WAN monitoring
Resources to dig deeper
The technical playbook for deploying agentic AI in production ITOps
From alerts to action: How agentic AI will change your ITOps
Download Whitepaper→