Cisco Meraki monitoring
Frequently asked questions
Why are the links not present between devices in Topology View?
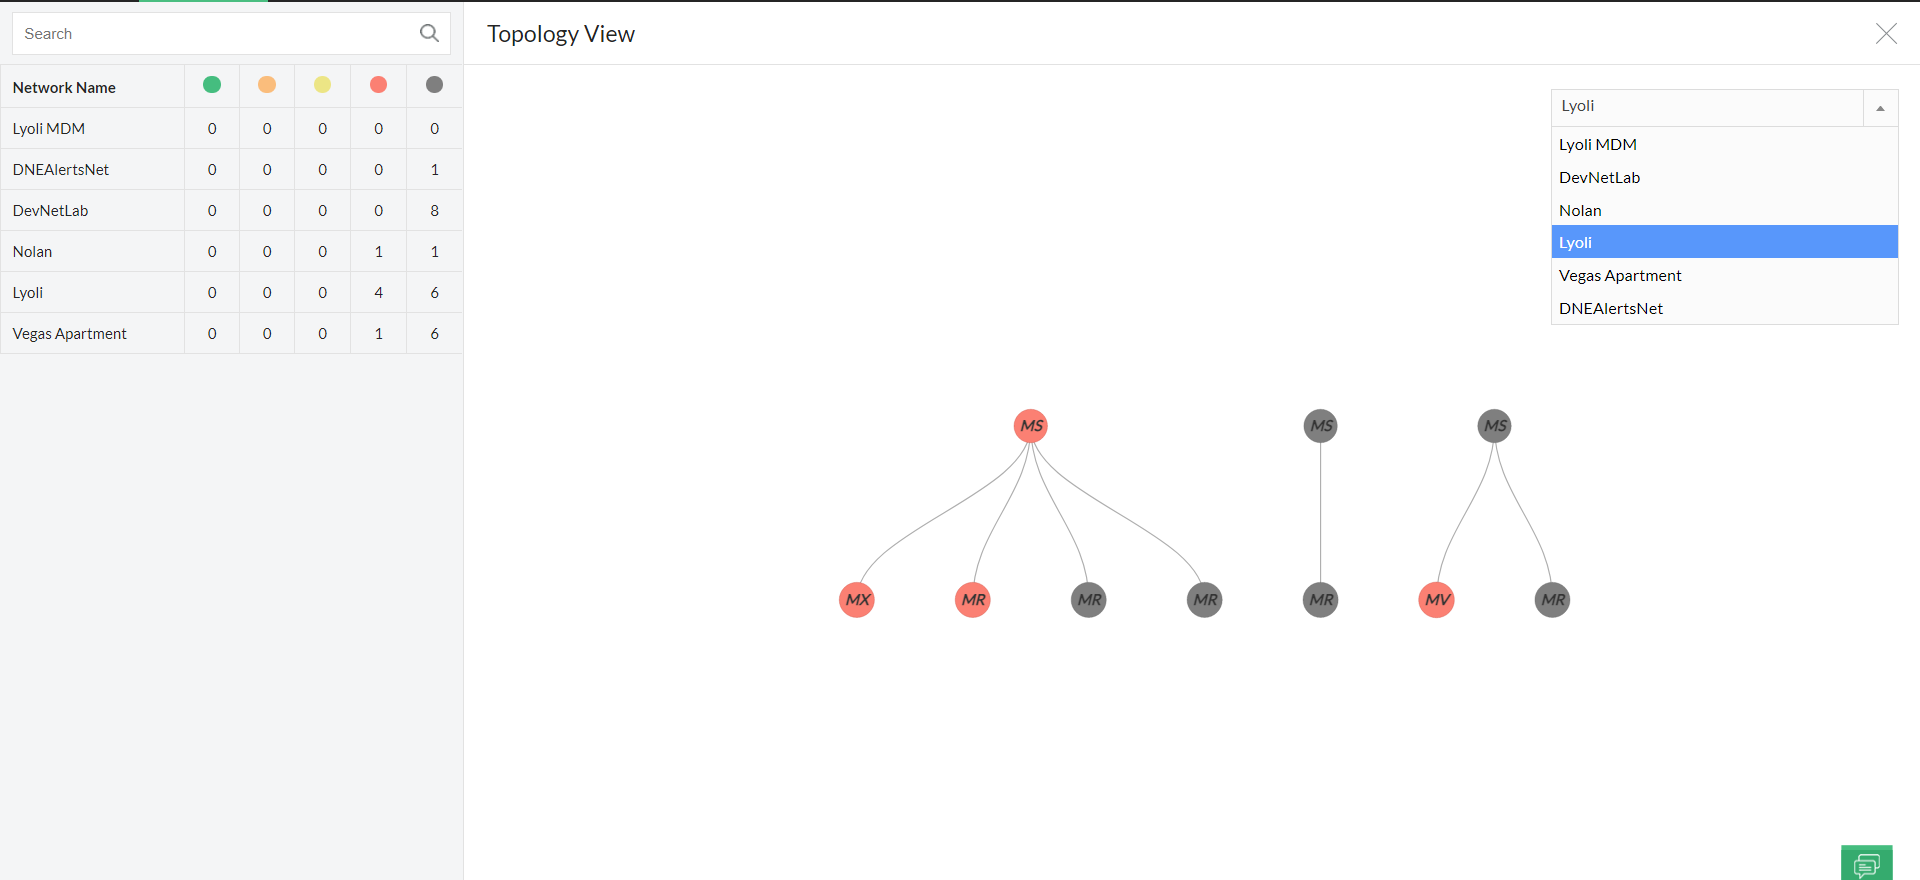
The Topology View page gives you a complete map like representation of the various devices in each network of the discovered Meraki controller. The device link between any two devices will only be present in the OpManager UI if the devices are connected to a Meraki Switch available in the discovered network. If not, there will be no connection between the devices and the devices will only be displayed as a Node.
What does the color code represent in Topology View?
The color codes here represent the availability state of the devices. Listed below are the various colors and what they represent in the Topology View under Meraki monitoring.
- Green - Number of Meraki devices available in the network that are in Clear state.
- Orange - Number of Meraki devices available in the network that are in Trouble state.
- Yellow - Number of Meraki devices available in the network that are Attention state.
- Red - Number of Meraki devices available in the network that are Critical state.
- Grey - Number of Meraki devices available in the network that are in Unmanaged or Device Not Monitored state.
