TCP Service Monitors
OpManager monitors and manages critical IT services around the clock, for better availability and performance. It supports various services. This help documentation will guide you through,
- Adding a new TCP service monitor
- Associating the Service to Devices
- Dissociating Devices
- Adding a monitor from the Device Snapshot Page
Add a new TCP service monitor
To start monitoring a TCP service in OpManager:
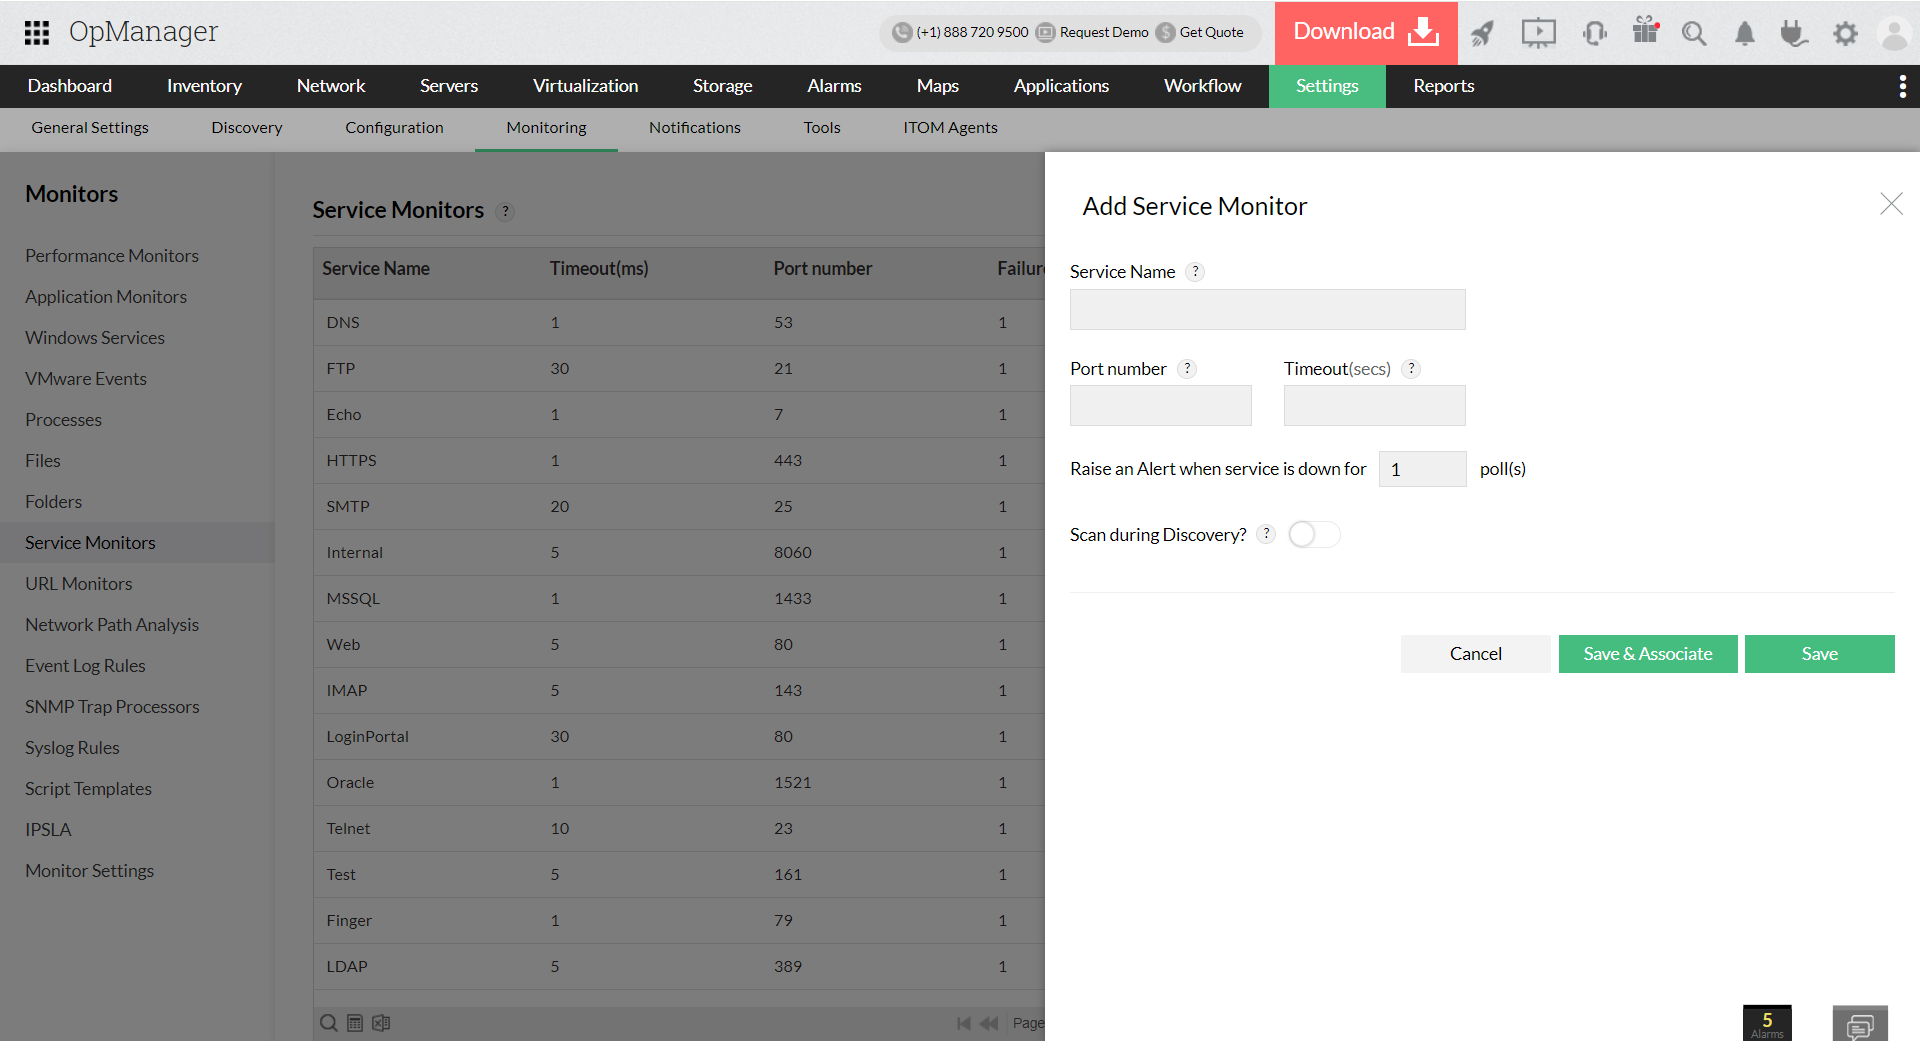
- Go to Settings → Monitoring → Service Monitors → Add.
- Specify the name of the TCP service that you want to monitor.
- Specify the TCP Port number that has to be checked for service availability.
- Specify the timeout interval in seconds for the port-check request.
- Specify the consecutive time to generate an alarm if the service unavailable for N number of times
- Select an option for Scan during Discovery. This will scan network devices for the monitored service during the discovery process and will automatically associate the monitor to the device if the specified service is available.
- If you wish to associate the monitor to existing devices, click on Save & Associate. This option will prompt you to select the required devices to which the monitor must be associated
Select the required devices and click 'Save'. - If you wish to only add the monitor (and not associate it to any of the existing devices), click on Save.
Associating the Service to Devices
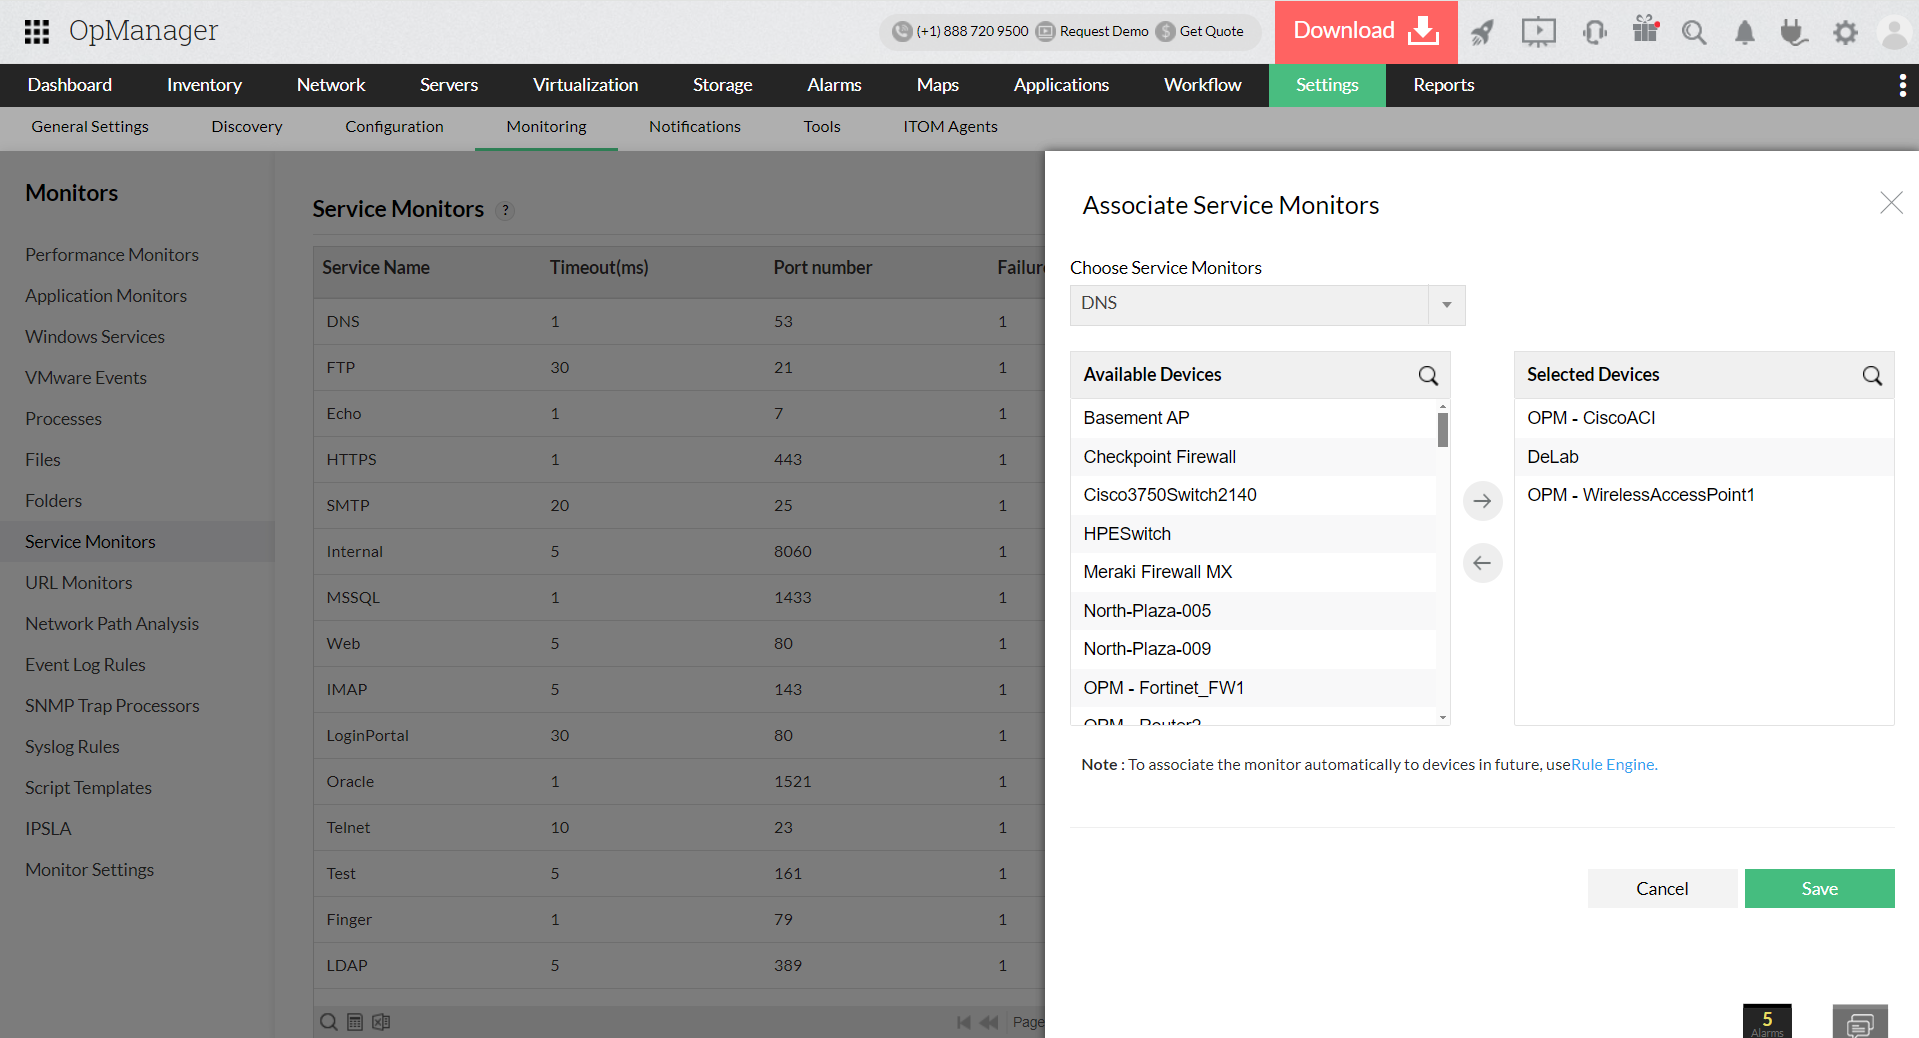
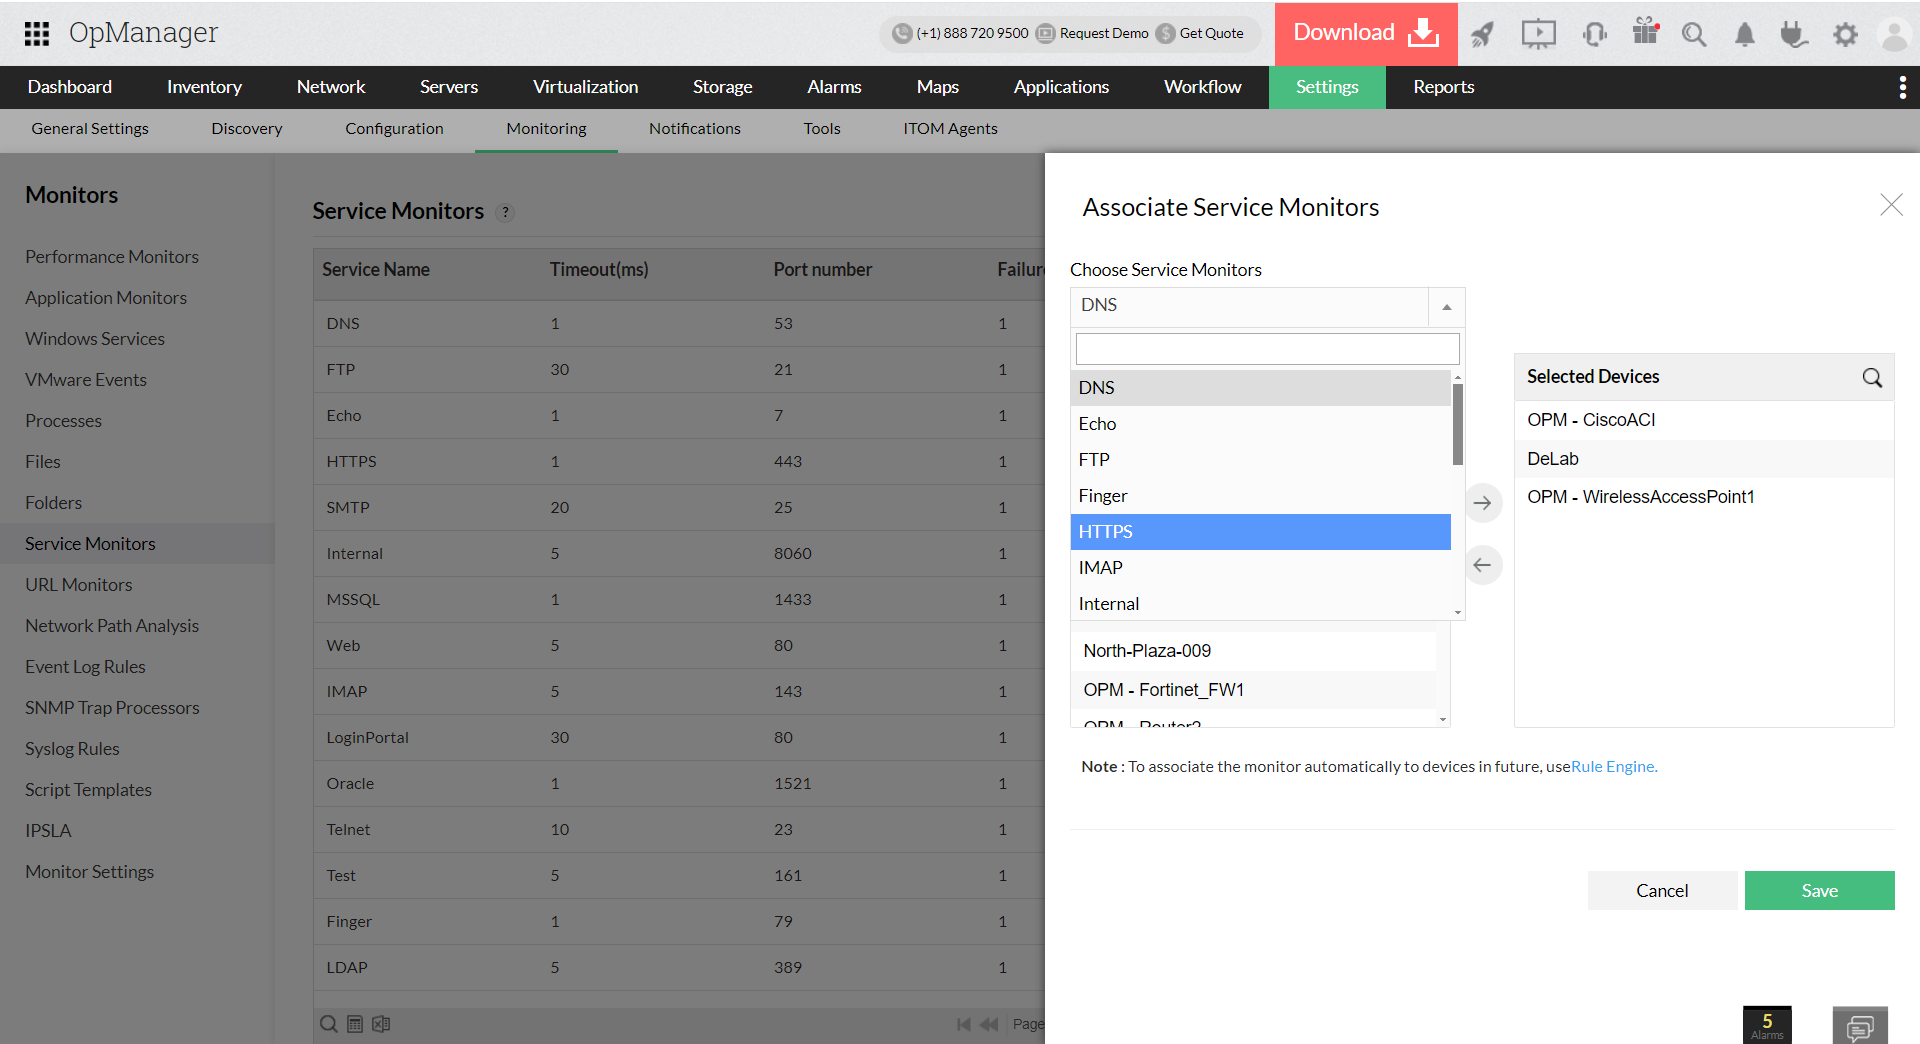
- Go to Settings → Monitoring → Service Monitors → Associate.
- Select the required TCP service from the Service Monitors drop-down.
- Select the devices on which you want to monitor the service from the column on the left and move them to the right.
- Click Associate.
Dissociate Devices
- Go to Settings → Monitoring → Service Monitors → Associate option.
- Select the monitor from the Service Monitors drop-down menu.
- Select the devices on which you do not want to monitor the service from the column on the right and move them to the left.
- Click Associate.
You can also associate/dissociate service monitors to devices from the Quick Configuration Wizard. Go to Settings → Configuration → Quick Configuration Wizard → Service Monitors and associate/dissociate services to devices as mentioned above.
Adding a monitor from the Device Snapshot Page
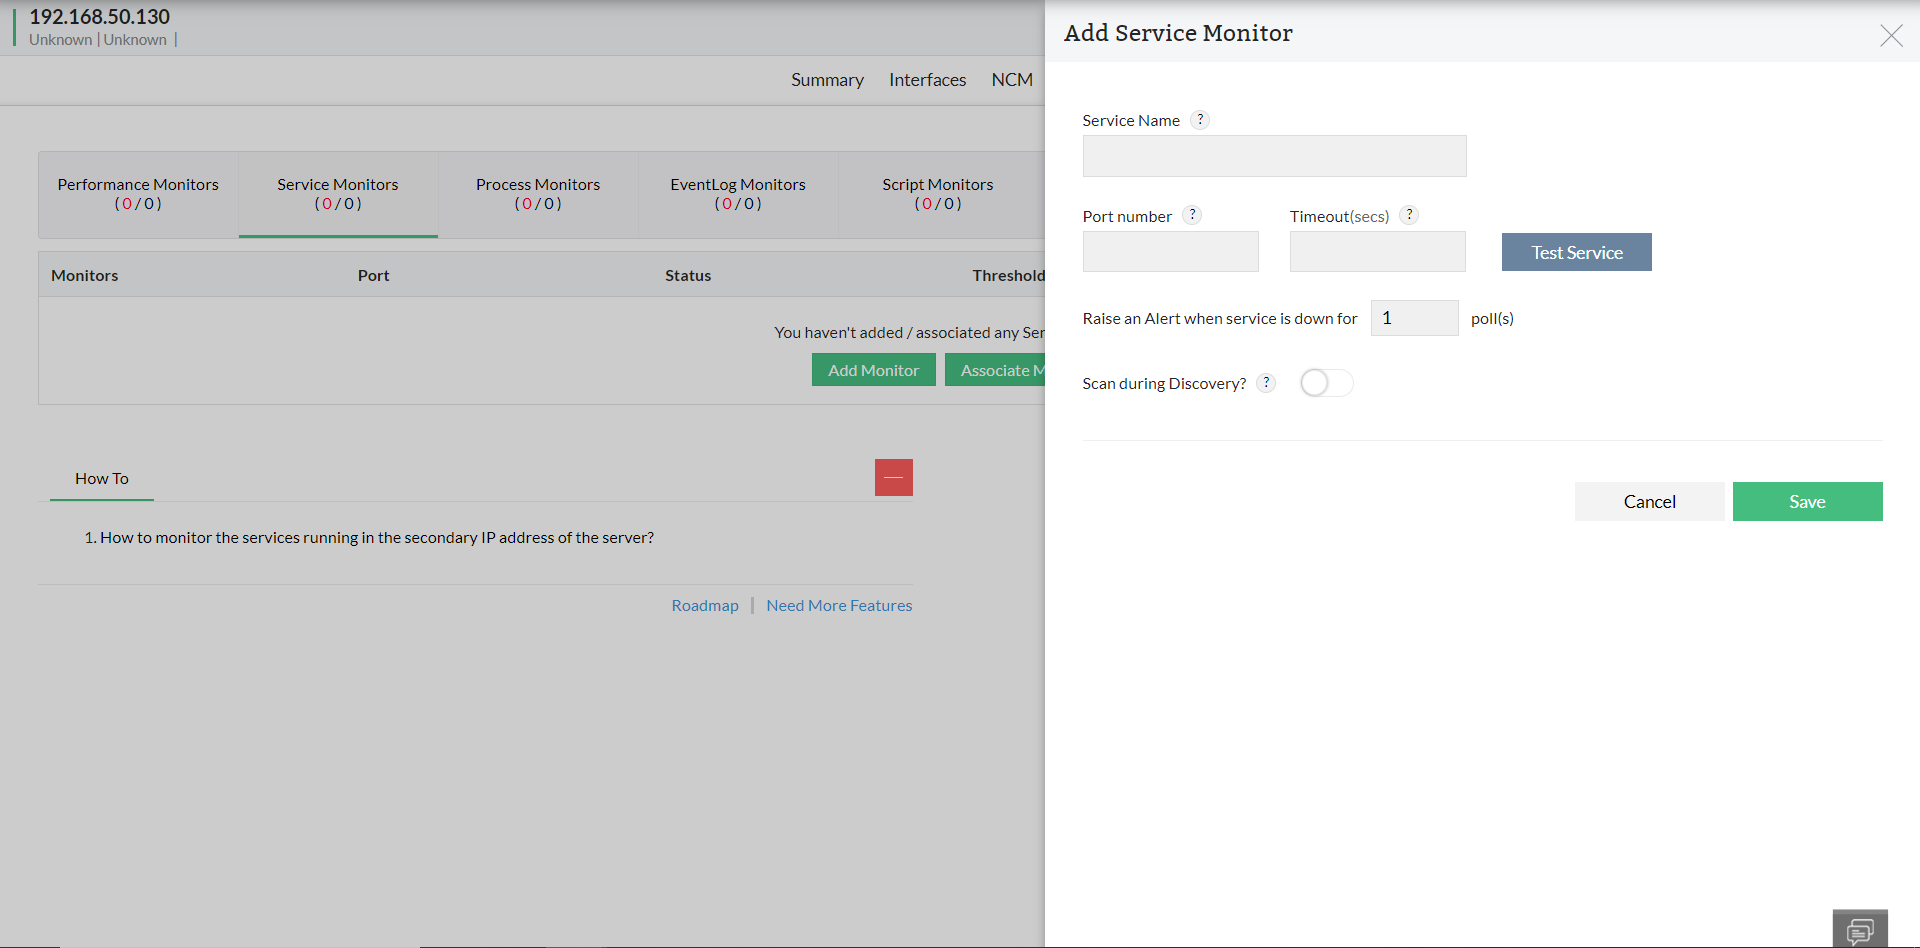
- Navigate to Inventory → Devices and then click on a device to open its the Snapshot page.
- Now open the snapshot page of the device you wish to add the monitor to, and click on Monitors → Service Monitors.
- Click Add Monitor, and provide the necessary details - the service name, port number and the timeout.
- You can test if the provided details are correct by using the 'Test Service' option.
- Also, mention the number of polls before OpManager raises an alert for that service monitor.
- Finally, choose if you want to scan the mentioned port during discovery of new devices by toggling the 'Scan during Discovery?' option. If this option is enabled, any device that is discovered in the future with this service/port combination will be automatically associated with this monitor.
- Once you have provided all these details, click 'Save' to associate the monitor to the device.
To gain in-depth insights into OpManager's TCP service monitoring, explore the following help documents.