DHCP Insights
DHCP Insights provides real-time visibility into all DHCP transactions across your network by analyzing packet-level data. It enables administrators to quickly detect, diagnose, and resolve DHCP-related performance issues and failures without relying on DHCP server logs.
Prerequisites:
DHCP and DNS Insights leverage deep packet inspection (DPI) to provide real-time visibility into DNS and DHCP traffic flowing through the network.
To enable the DPI engine in OpManager, a Remote Collector should be installed, which is a lightweight, unified agent that functions as both a poller and a packet analysis engine. To learn more about how to install the Remote Collector, click here.
DHCP packets are mirrored from the network switch, processed by the Remote Collector, and sent to OpManager for correlation and visualization.
How to access DHCP Insights?
Once the Remote Collector is installed and DHCP data collection has started, users can view DHCP Insights in a visual format from the device’s Snapshot page. To access DHCP Insights:
- Navigate to Inventory and select the required DHCP server.
- Open the DHCP Insights tab on the device's Snapshot page.
- Or, Go to the Network tab and select Packet analysis. The monitored DHCP and DNS servers will be listed here.
- Click on a DHCP server to open its DHCP isnights tab.
DHCP Insights:
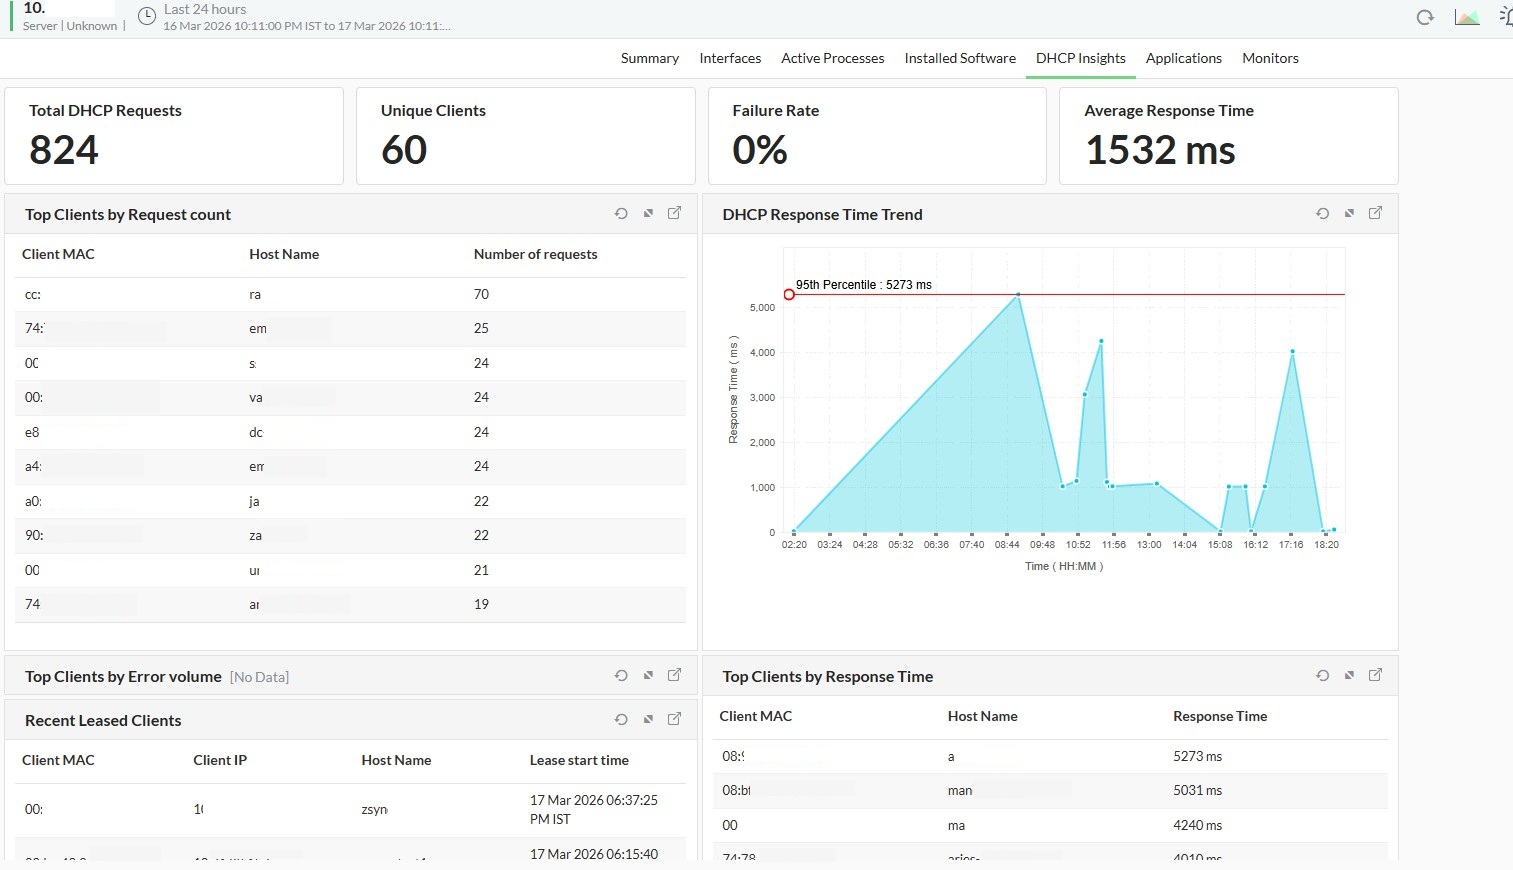
Users can gain visual insights from the widgets on the DHCP Insights page. You can click the expand button at the top right of a widget to drill down and view detailed information about the widget components, which can be further drilled down for more granular analysis.
Header Metrics
Users can gain a quick understanding of DHCP service activity and performance through the provided metrics:
Total DHCP Requests: Reveals the overall number of requests processed, useful for assessing server load.
Unique Clients: Displays the total number of individual devices interacting with the DHCP server.
Failure Rate: Tracks the percentage of failed requests, helping narrow down issues in DHCP communication.
Average Response Time: Provides the average time taken to process requests, offering insights into server responsiveness.
Recent Leased Clients
Users can gain detailed information about devices recently assigned IP addresses via DHCP. This section lists each client’s MAC address, IP address, hostname, and lease start time, helping administrators monitor active devices and verify DHCP leasing operations.
Top Clients by Request Count
Users can gain identification of devices generating the most DHCP requests. This section highlights devices with high request counts, allowing administrators to uncover network behavior such as loops, misconfigurations, or heavy traffic patterns.
DHCP Response Time Trend
Users can gain a view of DHCP response times over a timeline, allowing for the identification of spikes, dips, or trends. This helps correlate network load or server behavior during specific periods, aiding in root cause analysis for slower actions.
Top Clients by Error Volume
Users can gain visibility into devices causing repeated DHCP errors. When populated, this section highlights problematic clients or areas requiring attention due to misconfigured devices or network issues.
Top Clients by Response Time
Users can gain insight into client devices with the longest DHCP request processing times. By analyzing this list, administrators can focus on network delays caused by specific devices and evaluate server-side behavior.
These insights help administrators ensure optimal DHCP server operations and maintain seamless connectivity for active clients.