A Guide to Quick-start OpManager
Here are some quick steps to get started with the discovery and
monitoring using OpManager.
Before that, a quicker note on what OpManager can monitor. Just
about anything on your network. It is enough if the device is
reachable by OpManager.
The discovered devices are categorized as Servers, Routers,
Switches, Firewalls, Printers, UPS, Wireless APs, and Desktops.
What do you want to do?
The series of tasks you might want to perform to get started could be in the following order...
- Discover networks
- Discover a single device
- Find a device
- Map the devices
- Monitor memory, cpu, and disk
- Set thresholds
- Configure Email Alert
- When in Trouble....
Discover Networks
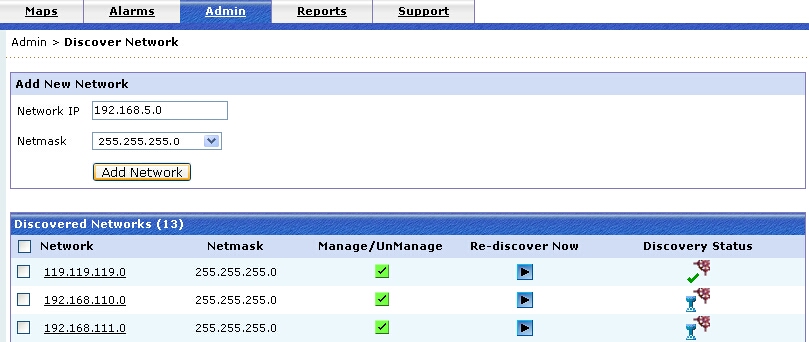
- Click the Admin tab.
- Under Discovery, select Discover Network.
- Type the Network Address and the Netmask of the network to be discovered.
- Click Add Network to start discovery.
Discover Devices
- Click the Admin tab.
- Under Discovery, select Add Device .
- Type either the IP Address or the Device Name of the device to be discovered.
- If the device is SNMP-enabled, type the SNMP Port number and the Community String to fetch the values from the SNMP agent.
- Click Add to start discovery.
Find the Device
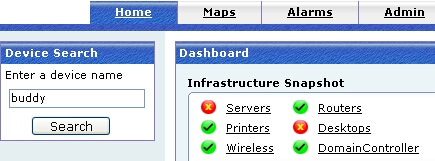
Type the device name in the search field on the left. You will find the device pronto! Here is the screenshot showing you the search field.
Map the Devices
OpManager automatically 'maps' the discovered devices into few broad categories like Servers, Routers, Switches, Desktops etc.
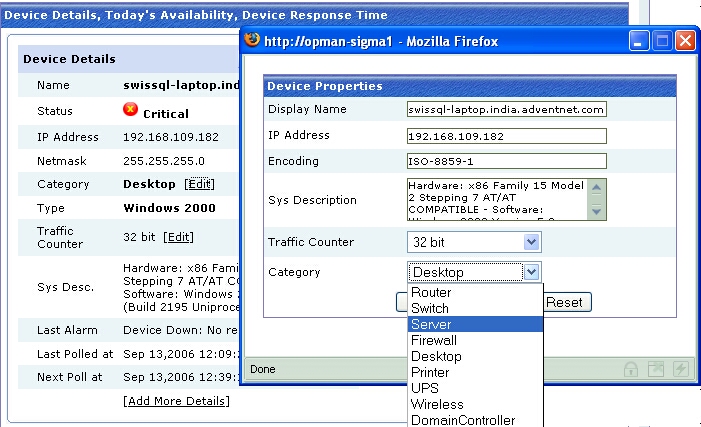
Don't worry if any of the discovered devices are not classified correctly. Here are the steps to change them:
To change category of a single device,
- Go to the device snapshot page
- Click Edit icon against the Category field
- Select the correct category from the corresponding combo-box
and save changes
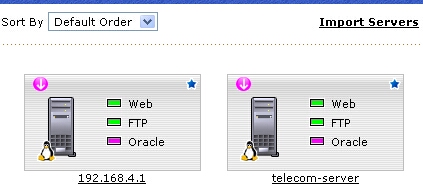
To bulk-import devices from desktops to servers,
- Go to the Servers map
- Click Import Servers link on top right corner
- Move the required devices to the Servers category and save
changes.
Monitor CPU, Memory, Disk
The monitors for CPU, Memory, and Disk Utilization are automatically associated for SNMP-enabled devices. These monitors are SNMP-based. You will see the dial graphs for these three resources in the device snapshot page.
Wait! Don't panic if you are not seeing the dial yet. You may not see the dials if SNMP is not enabled in the device. All you need to do is to enable SNMP on the device and rediscover the device, or simply associate a non-SNMP monitor.
Do you see the dial graphs appear for some devices while few dont?- Check if the device is SNMP-enabled. A blue star is shown on
the device icon in the map.
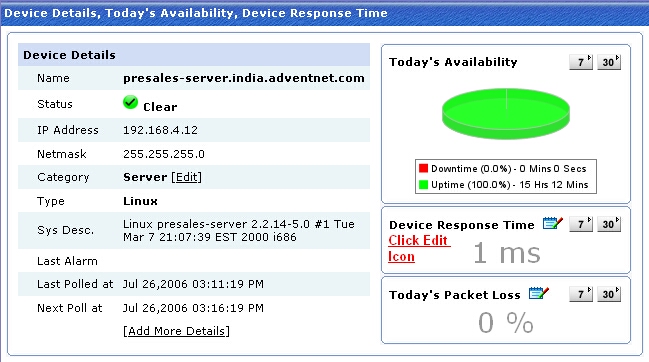
- Click the device to see the device snapshot page. The
'sysDescr' here will show the system description if the device
responds to SNMP requests
- Scroll down to the Resource Monitors section and click the Edit
icon against the Monitor name.
- Click the Test Monitor link. When you click this link,
OpManager queries the device for the data. If it responds, you
should be able to see the dial.
If the Test Monitor does not respond, check the troubleshooting steps.
Read on if you want to configure non-SNMP-based monitoring or
skip and move to the next
section.
WMI / Telnet Monitoring
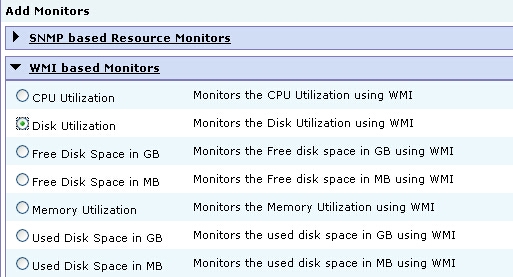
If your devices are not SNMP-enabled, you can associate WMI-based monitors for all the Windows machines, and Telnet-based monitors for Linux /Solaris machines.
The steps are:
- Go to Admin-->Quick Configuration Wizard.
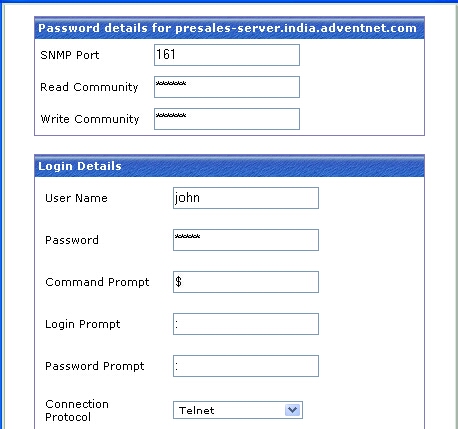
- Select the option ' Specify a common Username and Password for Windows / Linux / Solaris devices'.
- Select the device type as either Windows, Linux or Solaris.
- If you have selected Windows, configure the domain name, domain admin user name and the password to connect to the remote windows devices. For instance, if the domain name is BigDom and the user name is administrator, in the User name field, configure BigDom\administrator.
- If you have selected Linux or Solaris, configure the common username and password with which you can log into these devices.
- After configuring the device passwords, go back to the Quick Configuration Wizard.
- From here, select the option 'Add a new monitor to several devices (Eg. Traffic monitor,Service monitor)' .
- Select Resource Monitors from the monitors list.
- Select WMI based Monitors for non-SNMP windows devices, and select Telnet/SSH based monitors for Linux devices.
- Select the required monitor and associate it to the required devices.
Note: You can effect these configurations for individual devices too. Click the Passwords link on the right in the device snapshot page to configure the password. Scroll down to the 'Resource Monitors' section and associate the required monitor.
Set Thresholds
You can configure thresholds for the following performance monitors:
1. Resource Monitors, Service
Monitors, Traffic Monitors, Custom Monitors, Application Monitors,
URL Monitors
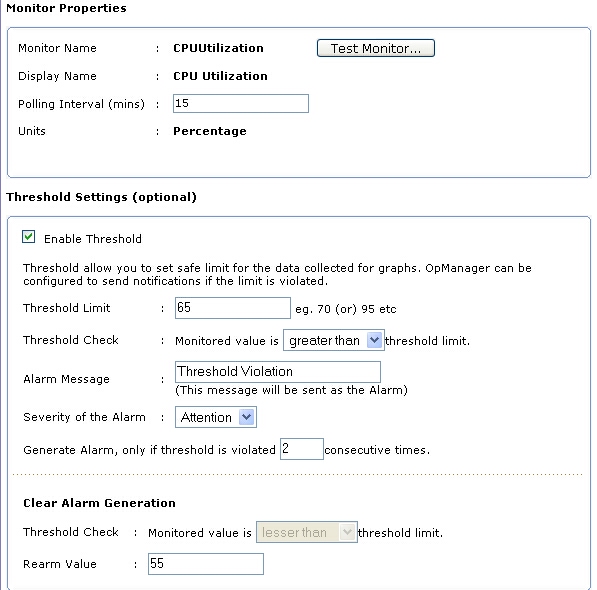
The steps to configure are,- Select the required monitor from Admin-->Monitors tab.
- Select 'Enable Threshold' checkbox and configure the monitor
threshold.
- Again, you can configure thresholds for individual devices by
editing the resource monitor from the device snapshot page.
2. Device Response Time and Packet Loss Percentage:
Select the device for which you want to configure the thresholds.Click Edit icon in the 'Device Response Time' column to configure threshold on response time.Click Edit icon in 'Today's Packet Loss' column to configure threshold on packet loss percentage.
Configure an Email Alert
You will need to configure the mail server settings, configure a notification profile, and associate it to the devices. This will notify you of specific faults through email.
- Configure Mail Server Settings
- Select Admin -->Mail Server Settings
- Configure the Mail server name and port number
- Configure the email id to which an email alert must be sent when a fault occurs
- Click OK to save the settings.
- Configure the Email Alert Profile
- Select Admin --> Notification Profiles
- Click Email Alerts link on the right
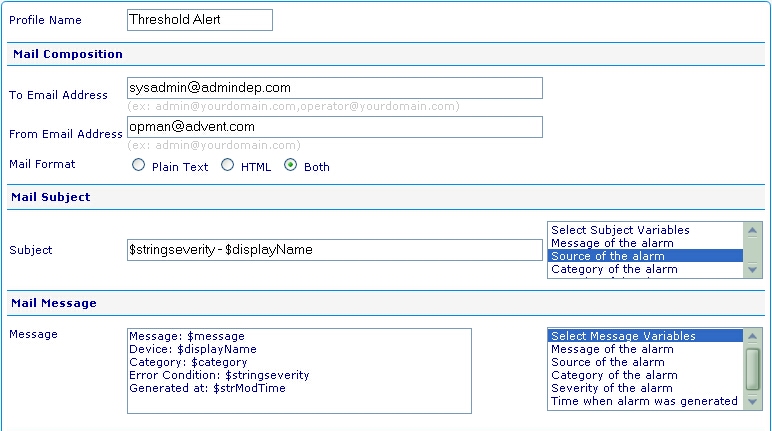
- Type the profile name, to and from email address.
- Select the variables that must appear in the mail subject and message from the corresponding list box.
- Save the profile.
Associate the Alert Profile to devices
- Click 'Associate to devices' link on the right in the Notification Profiles page
- Select the configured email alert profile and click Next
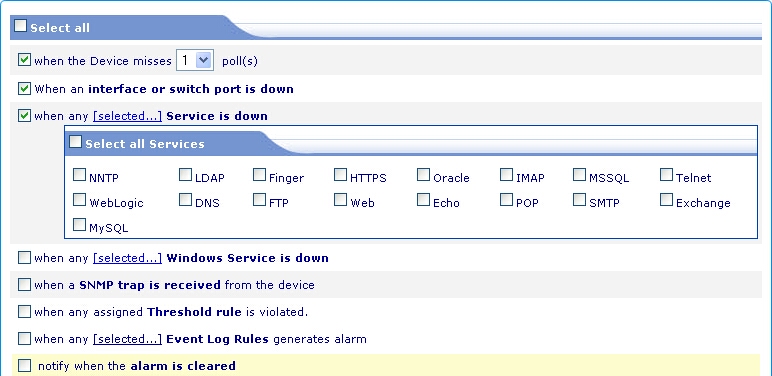
- Select the criteria for which you would like to receive an email alert. Click Next.
- Assign it to the required category, or manually group the devices for which you wish to be notified. For instance, if you want to be notified of threshold violation for all Servers, select Server category from the combo-box.
Email alert is now configured for all the chosen devices. You will receive an
email when a fault with the marked criteria is met.
When in Trouble...
All you need to
do is, - Select Support tab
- Click Request Support and submit your query.
Our techies will contact you!!!
Copyright © 2003-2006, AdventNet Inc. All Rights Reserved.
