Problem and Event Correlation
Problem and Event Correlation reduces alert noise by intelligently grouping related alerts into a single problem. Instead of sifting through multiple independent alerts during an outage, you can work from a consolidated problem view to quickly identify and resolve the root cause. When similarities are detected in a Device Group or Group of Groups, the related alerts are grouped into a Problem and listed under Alarms → Problems (Beta).
Enabling Event Correlation
Event Correlation must be configured at the group level for problem detection to work.
- Go to Settings → Configuration → Groups.
- Ensure devices are grouped by a defined business use case, such as interdependent components supporting a specific service or workflow, including servers, network devices, and applications. This alignment improves correlation accuracy and Problem detection reliability.
- In the Event Correlation column, turn on the toggle for the required groups.
Note: Before enabling Event Correlation, ensure the following conditions are met:
- Event Correlation is supported for Device Groups and Group of Groups only, with at least one Device Group required.
- A maximum of 20 groups can have Event Correlation enabled at a time in Central, and 10 in Probe and Essential editions.
- Each group must contain 256 or fewer devices.
Viewing Problems
Once Event Correlation is enabled, correlated alerts are available under Alarms → Problems (Beta). Each entry on this page displays the following details:
- Severity: The overall impact level of the problem.
- Created Time: When the problem was first identified.
- Number of Alarms Associated: Total alerts grouped under the problem.
- Associated Groups: The group from which the alerts originated.
- Correlation Method: Whether the problem was identified through ML-based grouping or a specific correlation rule.
- Status: The current state of the problem. The possible values are:
- Open: An active issue that has not yet been resolved.
- Closed: Most associated alerts have cleared, indicating resolution.
- Archived: The system could not confirm that alerts are still related after periodic evaluation, and the problem has been archived.
The Problems tab also displays a noise reduction percentage, indicating how much alert noise has been absorbed through correlation. This represents alerts that would have otherwise been raised as separate, standalone incidents.
You can filter Problems by status (Open, Archived, Closed) and by correlation rule type, and sort by severity, alert count, creation time, or last update.
Using Problems Widget: To view open Problems for a specific group, navigate to Inventory → select the Group you want to inspect. Each group now includes a Problems widget, which displays all open Problems generated by alerts from devices within that group. Each Problem in the widget represents one or more alerts that share the same root cause, consolidated into a single entry.
Using Problems in Notification Profiles: You can include Problem-specific information in your notification profile subjects using the Impacted Sources variable: the devices or sources affected by that Problem or root cause.
These variables can be added to the subject line or in the message of any notification profile applied to Problem alerts, ensuring recipients have the key context before opening the platform.
Inside a Problem
Each Problem provides key controls to help you manage and respond to incidents effectively. The interface allows you to contextualize the problem, configure notifications, and track ownership directly from the Problem details view.

- Editable Title: Modify the problem title to reflect the identified issue or add meaningful context for easier tracking.
- Trigger Notification: Opens the notification configuration panel, listing all configured notification profiles, allowing you to choose how problem alerts are notified.
- Alerts List: Selecting any alert within the problem will redirect you to the corresponding Alarm Details page, where you can perform further troubleshooting.
- Acknowledge/Unacknowledge: Available at the top-right corner, this option allows administrators to acknowledge a problem, indicating ownership and preventing duplicate investigation efforts; it can be reverted if needed.
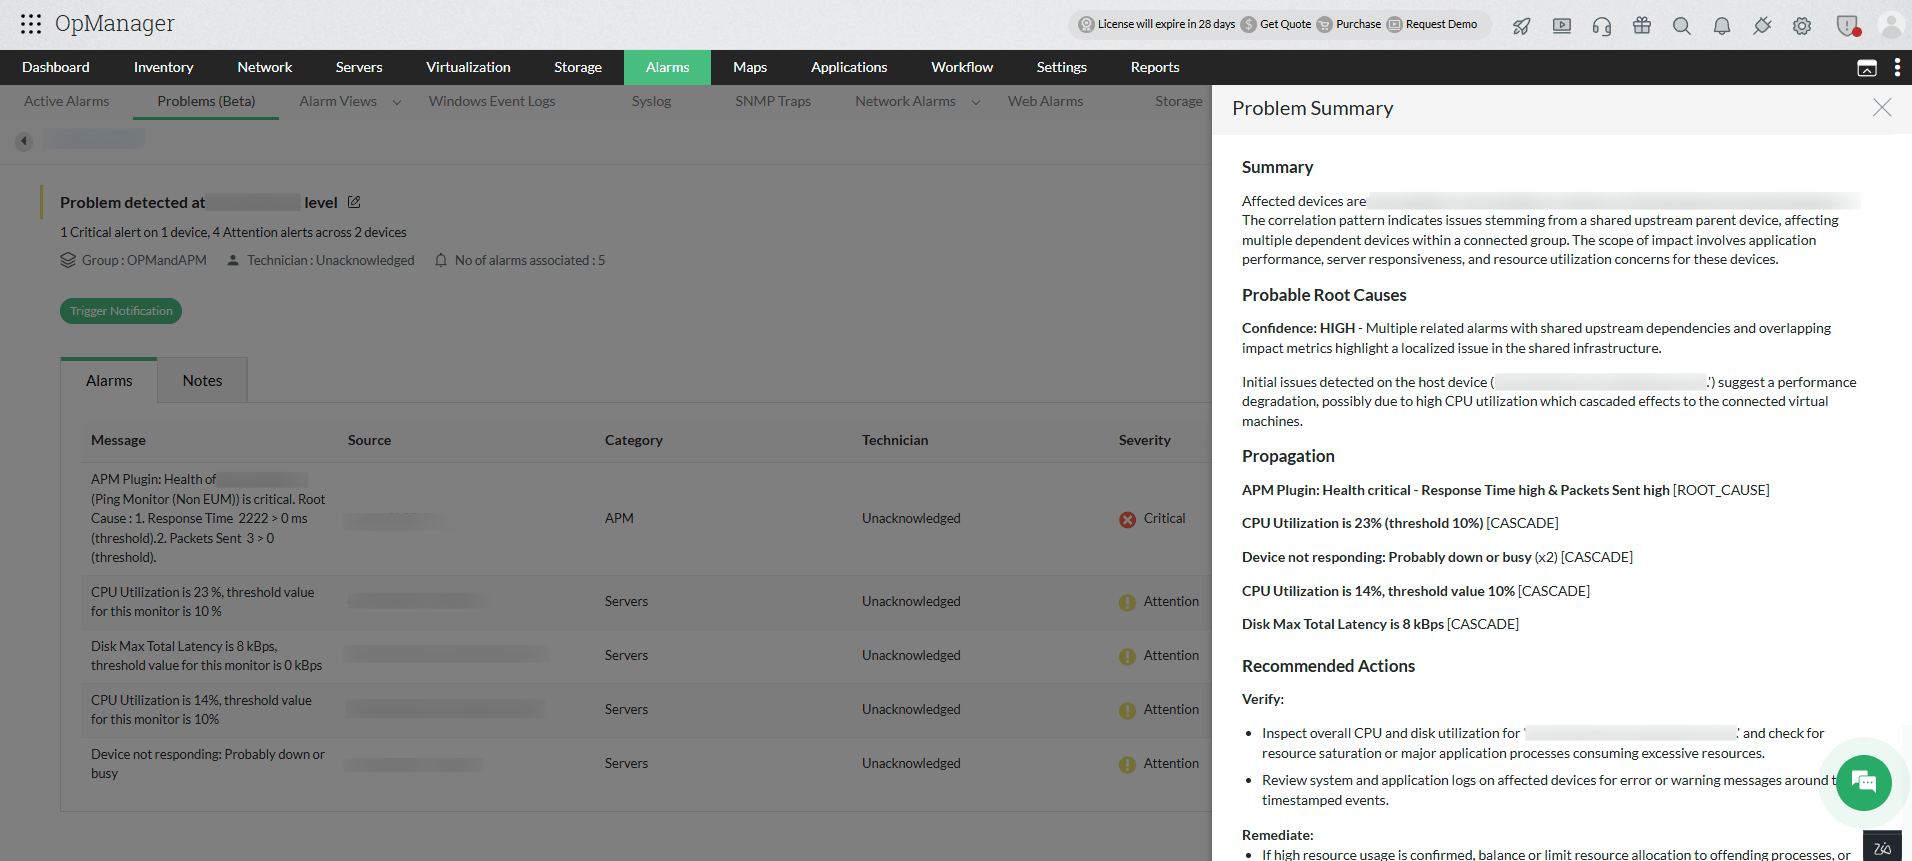
Analyze with AI: Runs a Gen AI analysis on the full incident context and opens the Problem Summary panel. This functionality is also available for APM plugin. When a Problem involves APM alerts, the analysis includes application performance context alongside network and infrastructure details.
For example, in this case, the analysis identifies the APM health alert on the upstream host as the root cause, flagging the impacted sources, and labels the remaining four alerts as cascades stemming from that failure. The Recommended Actions section then scopes the remediation steps directly to the upstream host, suggesting CPU and disk inspection before reviewing logs on the affected downstream machines.

Disabling Global Event Correlation
Event Correlation can be disabled globally when not required. Navigate to Settings → General Settings → System Settings → Client Settings tab. Here, you can disable Event Correlation to disable Problem functioning and display.

To learn more about the actions that follow an alert, such as assigning notification profiles, running workflows, or escalating issues, refer to our Alert Actions documentation.