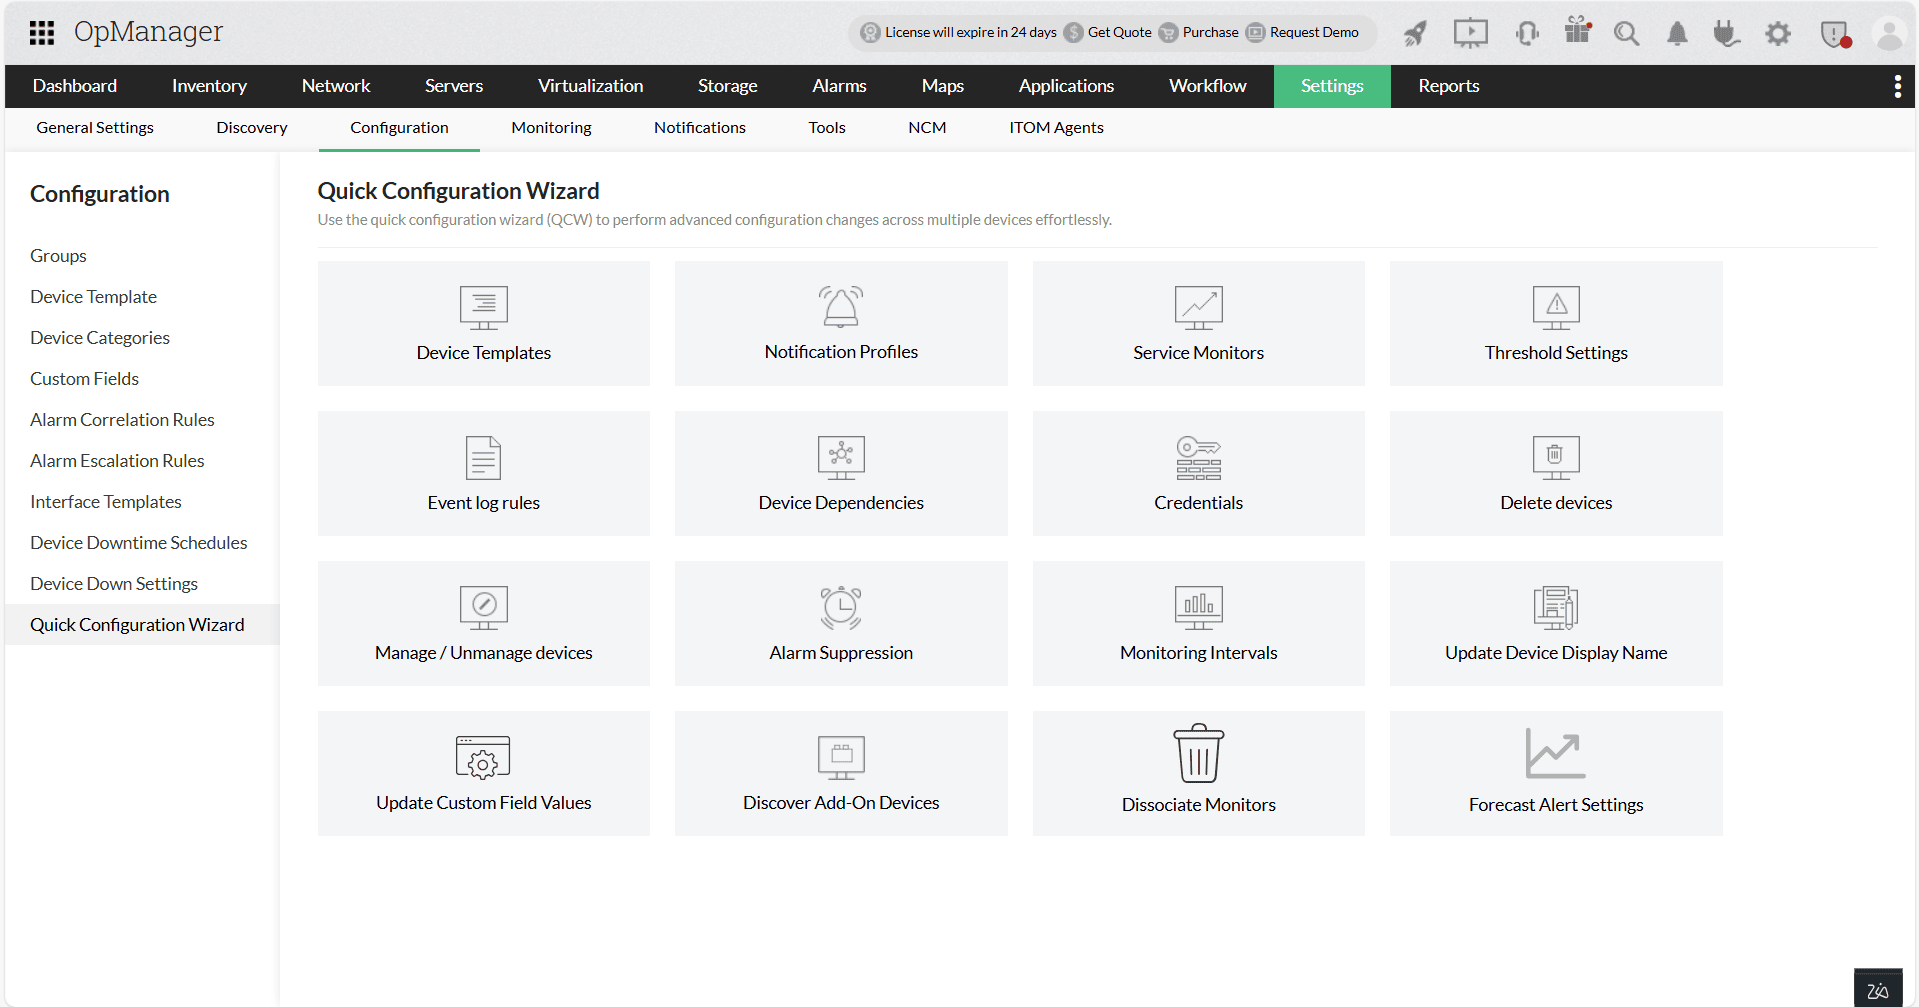
Quick Configuration Wizard
The Quick Configuration Wizard (QCW) in OpManager offers an easy and effortless way to make configuration changes to multiple devices.
To go to the Quick Configuration Wizard, go to Settings → Configuration → Quick Configuration Wizard.
- Device Templates
- Notification Profiles
- Service Monitors
- Threshold Settings :
- Event Log Rules
- Device Dependencies
- Credentials :
- Delete Devices
- Manage / Unmanage Devices
- Alarm Suppression
- Monitoring Interval
- Update Device Display Name
- Dissociate Monitors
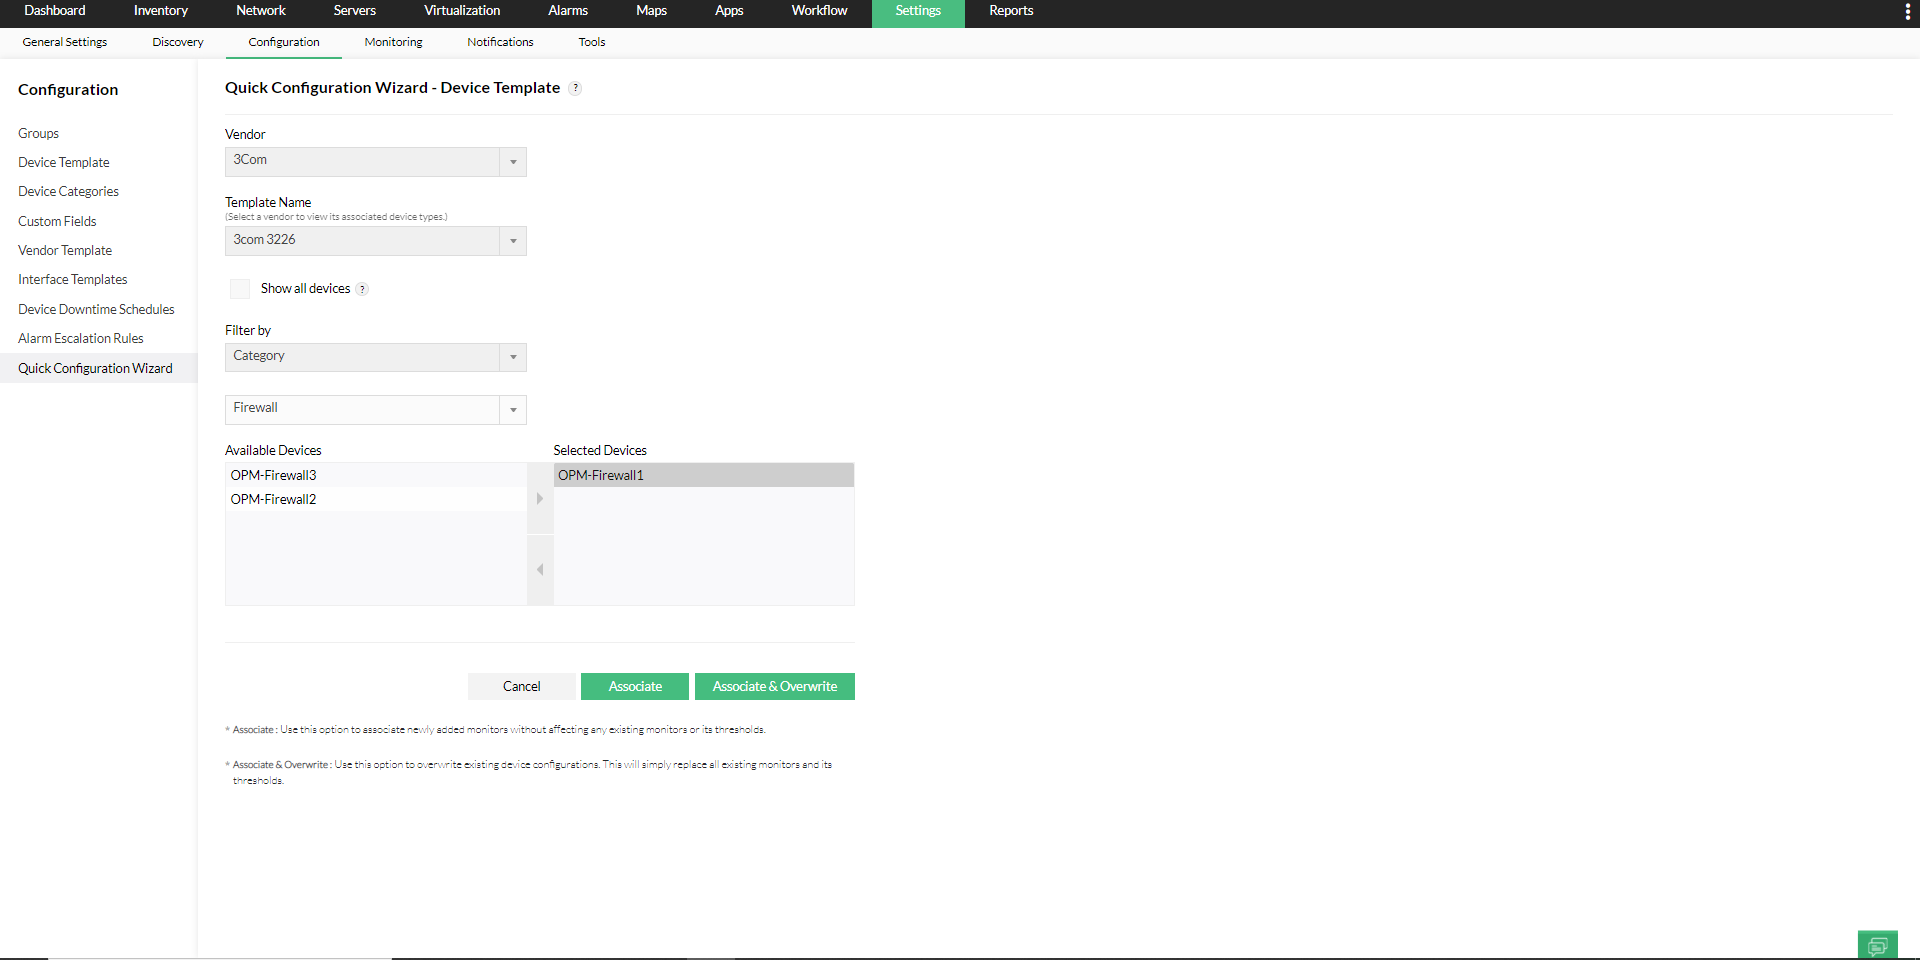
Device Templates:
Device templates carry the information required to classify the devices and to associate relevant monitors. OpManager comes with over 10000 device templates.
OpManager will automatically identify and associate device templates during discovery. However, in case the device types were not identified, you can create a custom device template and associate it either from Device template page or from QCW → Device Template.
Using the Device Templates tab in QCW, you can configure Device templates for multiple devices.
- Select a vendor to view the associated device templates.
- Select the template depending on your requirement.
- 'Show all devices' option: Enable this option to display all devices in the 'Available Devices' section. By default, devices classified as 'Unknown' device type are listed.
- Select all the devices you want to associate the template to from the 'Available Devices' list and click on the right arrow to move them to the 'Selected Devices' list.
- Select all the devices you want to associate the template to from the 'Available Devices' list and click on the right arrow to move them to the 'Selected Devices' list.
- Associate: Use this option to associate newly added monitors without affecting any existing monitors or its thresholds.
- Associate & Overwrite: Use this option to overwrite existing device configurations. This will simply replace all existing monitors and its thresholds.
Notification Profiles:
Configure Notification Profiles to selected devices using the option in QCW.
- Select the Notification Profile that you want to associate.
- Use the necessary filter and select the the devices you want to associate the Notification Profile to from the 'Available Devices' column.
- Click on the right arrow to move them to the 'Associated Devices' column.
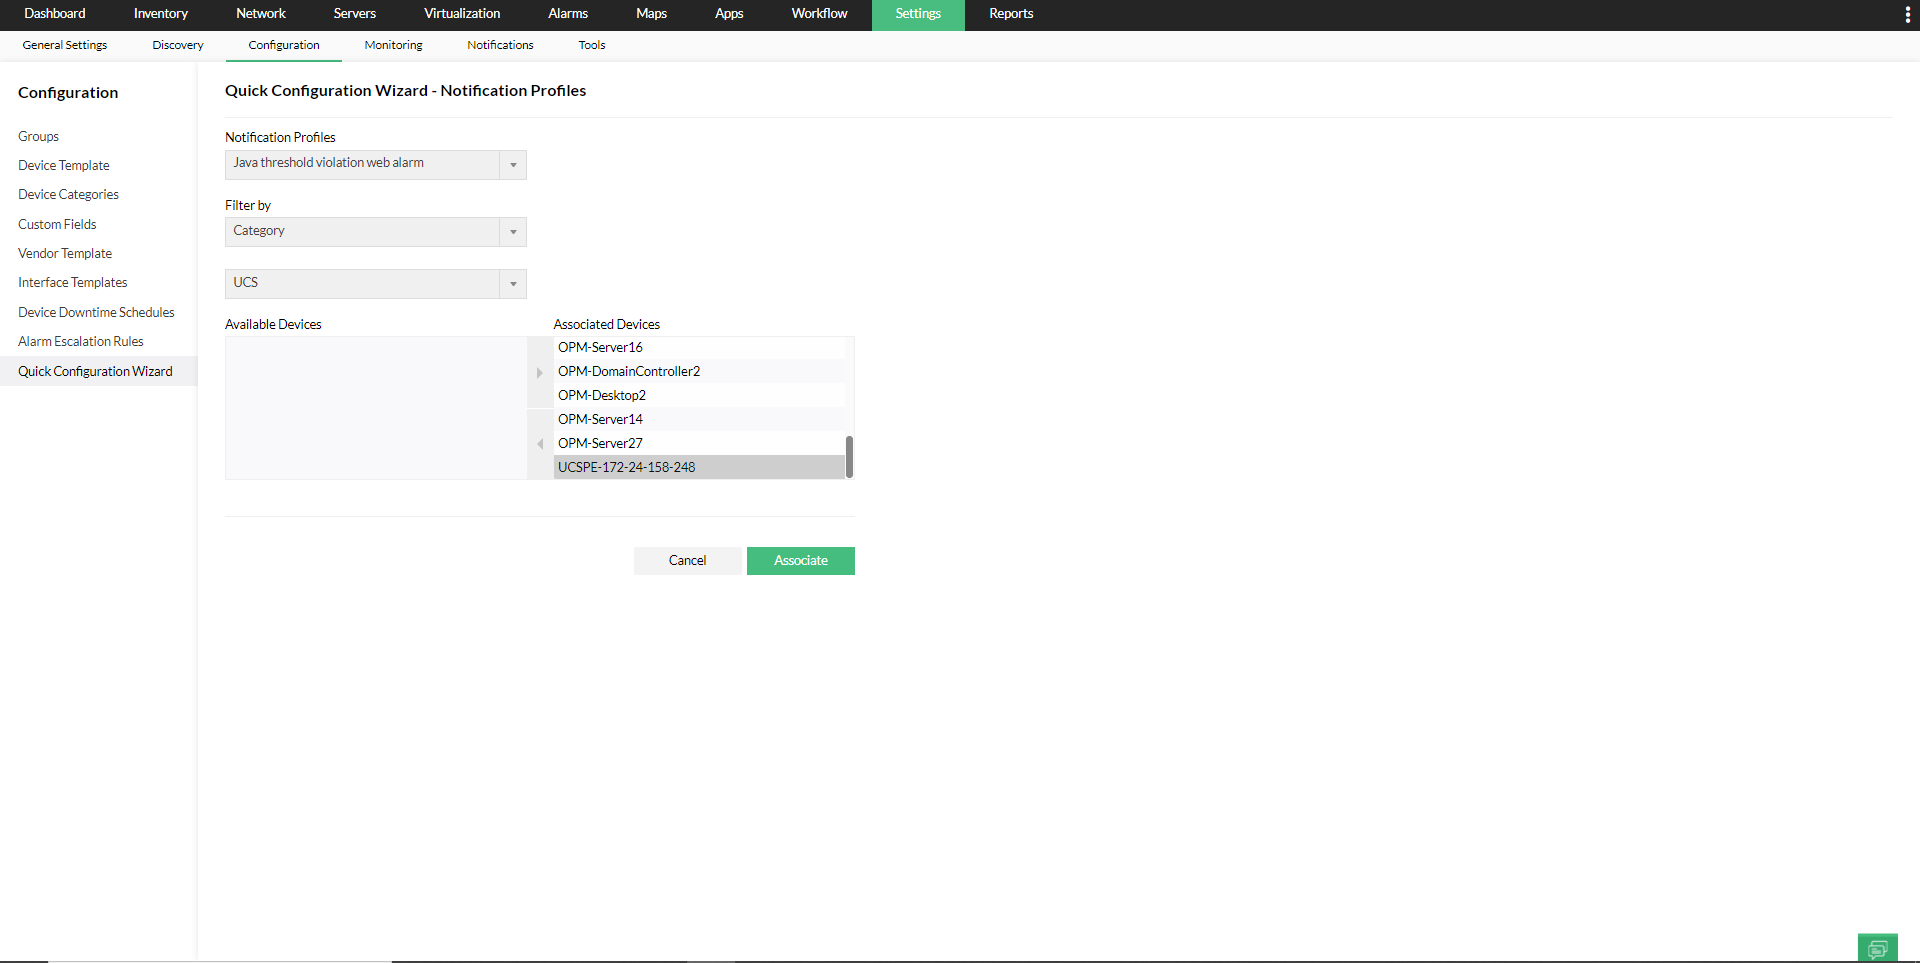
- Click on the Associate button once you've selected all the required devices.
Service Monitors:
Associate (or Dissociate) Service monitors and Windows Service monitors to devices in bulk using Quick Configuration Wizard - Service Monitors.
- Use the 'Associate a service to servers' option to associate a Service Monitor to devices in which the particular service is not monitored.
- Select the Service Monitor that you want to associate, then select the devices you want to associate the Service Monitor to from the 'Devices on which the service is not monitored' column.
- Click on the right arrow to move them to the 'Devices on which the service is monitored' column.
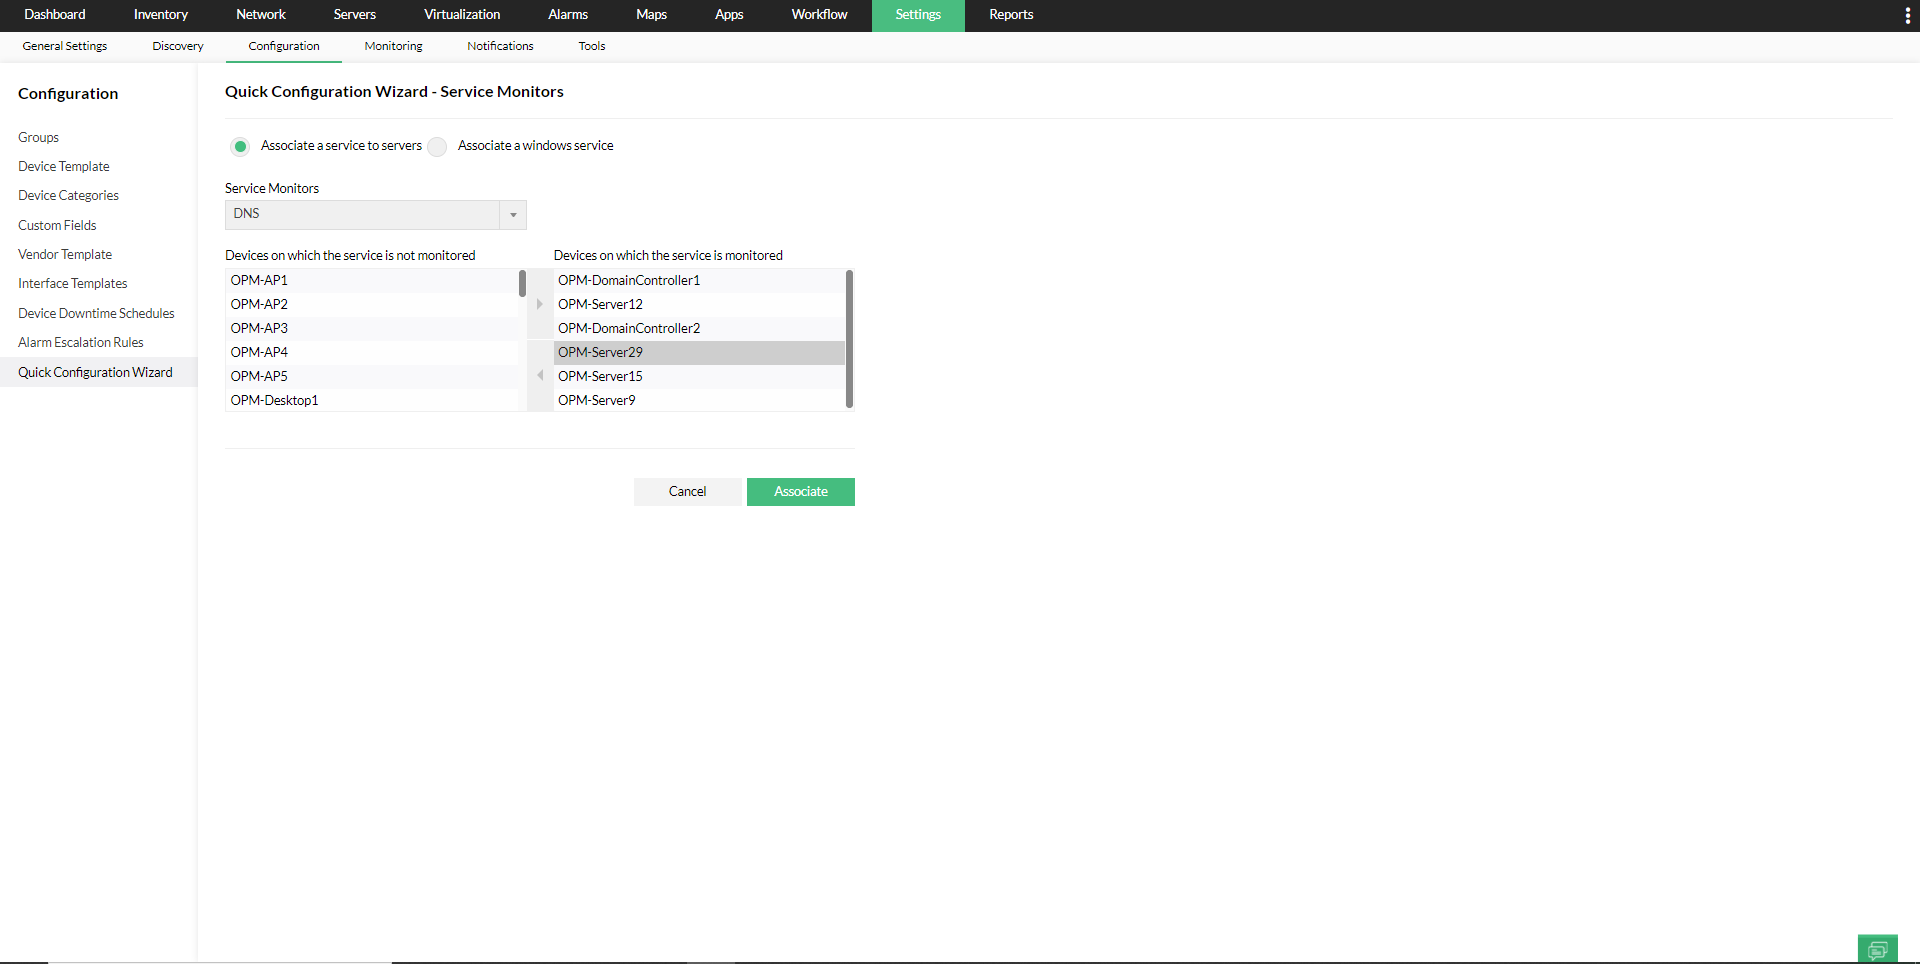
- Click on the Associate button once you've selected all the required devices.
- Use the 'Associate a windows service' option to associate a Windows Service Monitor to devices in which the particular Windows service is not monitored.
- Select the Windows Service Monitor that you want to associate, then select the devices you want to associate the Windows Service Monitor to, from the 'Devices on which the service is not monitored' column.
- Click on the right arrow to move them to the 'Devices on which the service is monitored' column.
Note: Move the devices from the 'Devices on which the service is monitored' column to the 'Devices on which the service is not monitored' to dissociate the monitors from the devices.
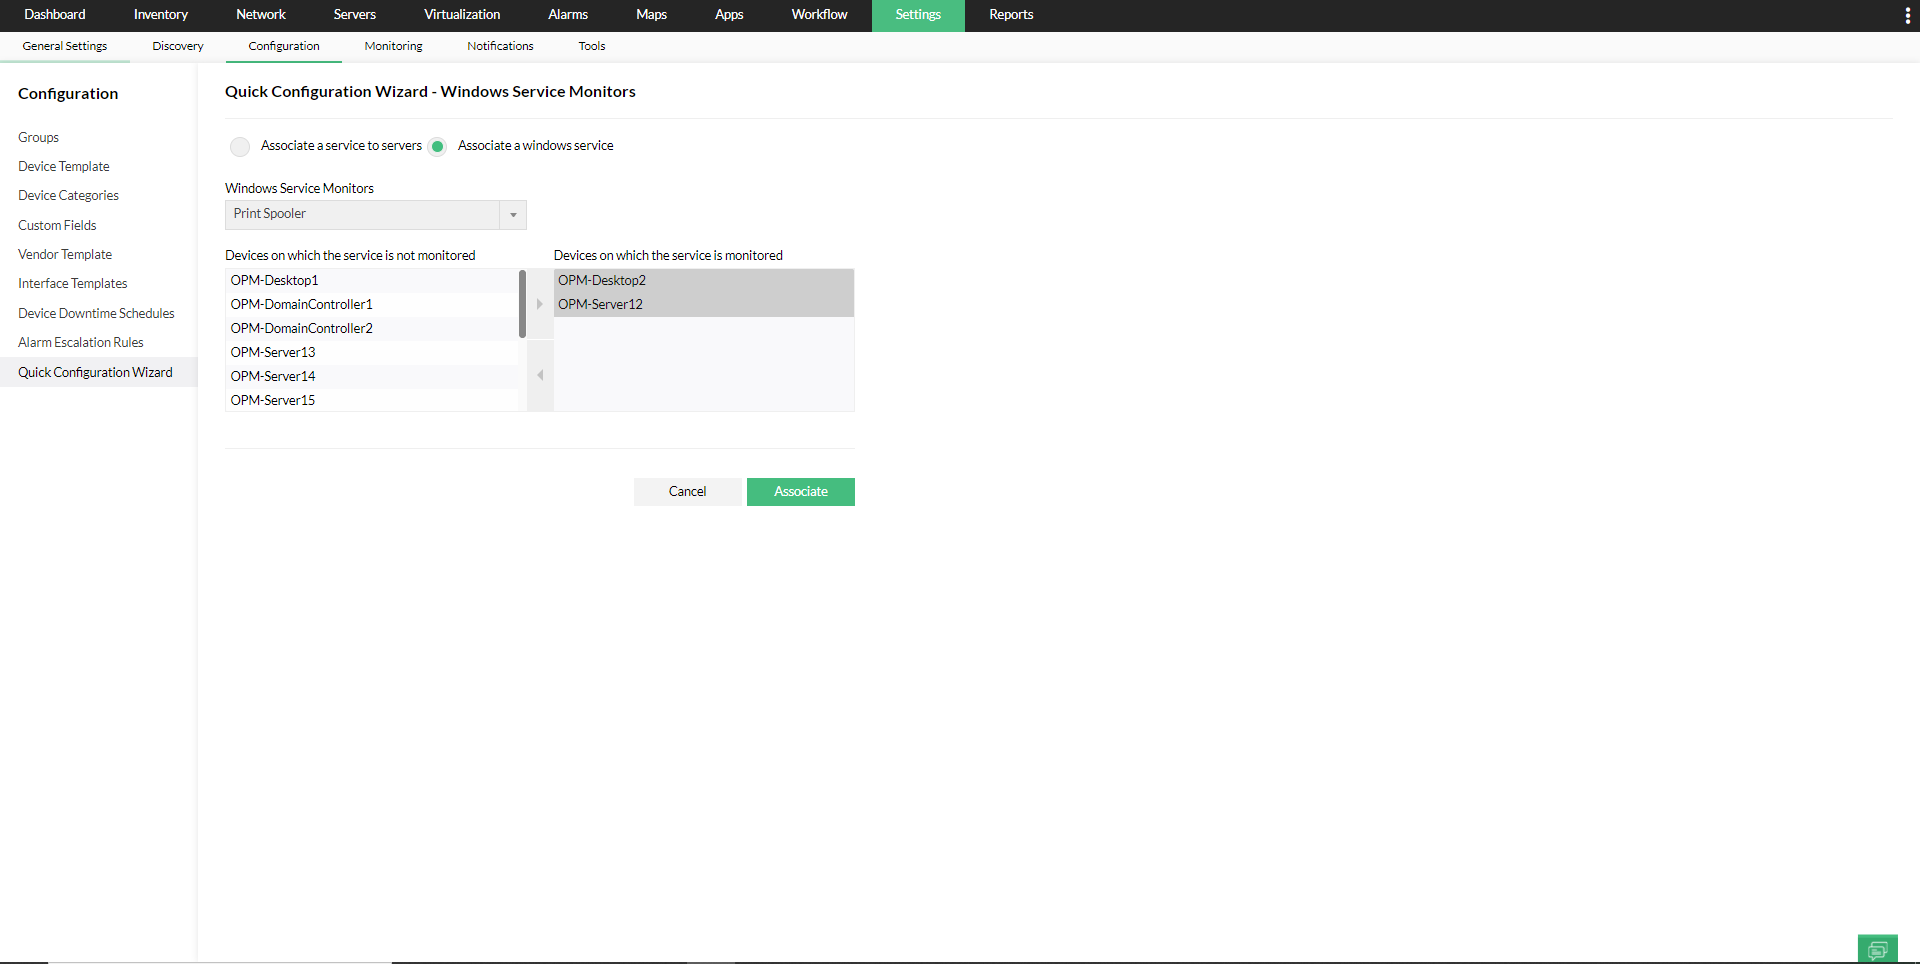
- Click on the Associate button once you've selected all the required devices.
Threshold Settings:
The Threshold Settings option in QCW allows you to configure/dissociate threshold settings in bulk for both performance monitors and availability monitors.
For performance monitors, you can configure/dissociate thresholds for Partition monitors, Instance monitors, VMware-Datastore monitors, Application monitors, and other types of Performance monitors. With the Enterprise Edition, you can configure these options directly from the Central server, allowing you to apply or remove thresholds for specific monitors within the selected probes.
To configure thresholds for Performance monitors:
- Select the monitor type.
- Choose the required Protocol, Category, and Filters based on the devices you want to configure, then click Next.

- Select the monitors you want to configure for their associated devices and click Configure.
- Enter the desired polling Interval and select the appropriate Data Type.
- Enter the threshold values and corresponding messages for the Attention Threshold, Trouble Threshold, and Critical Threshold. When thresholds are exceeded, alerts will be triggered with the defined messages.

- Enter the Rearm value desired and the corresponding message.
- Specify the number of 'Consecutive Times' of polling for which the threshold condition must be met before triggering an alert.
- Click Apply & Overwrite to overwrite the existing threshold values for the selected monitors with the newly configured thresholds.
Note :
- Only the fields in which values are added by the user, will be overridden. Unchanged fields will be left unchanged from their previously configured values.
- The consecutive times value can be configured only if the threshold values have been set.
To configure threshold settings for VMWare-Datastore monitors:
- Select Monitors Type as VMWare-Datastore, click Next and select the desired monitor.
- Click on Configure.
- Enter the desired 'Interval' for polling, Data Type and Units (usually percentage) required.
- Enter the threshold values and message needed for Attention Threshold, Trouble Threshold and Critical Threshold. Exceeding the thresholds set will give you an alert with the respective message.
- Enter the Rearm value desired and the corresponding message.

- Enter the number of 'Consecutive Times' of polling for which threshold alerts need to be raised.
- Click on Next.
- Select from the list of 'Available Datastores' and click the right arrow.
- Click on Apply & Overwrite.
To dissociate thresholds for Performance monitors:
- Select the monitor type.
- Choose the required Protocol, Category, and Filters based on the devices you want to configure, then click Next.
- Select the monitors you want to dissociate thresholds from for their associated devices.
- Click Dissociate Threshold to remove the threshold configurations from the selected monitors


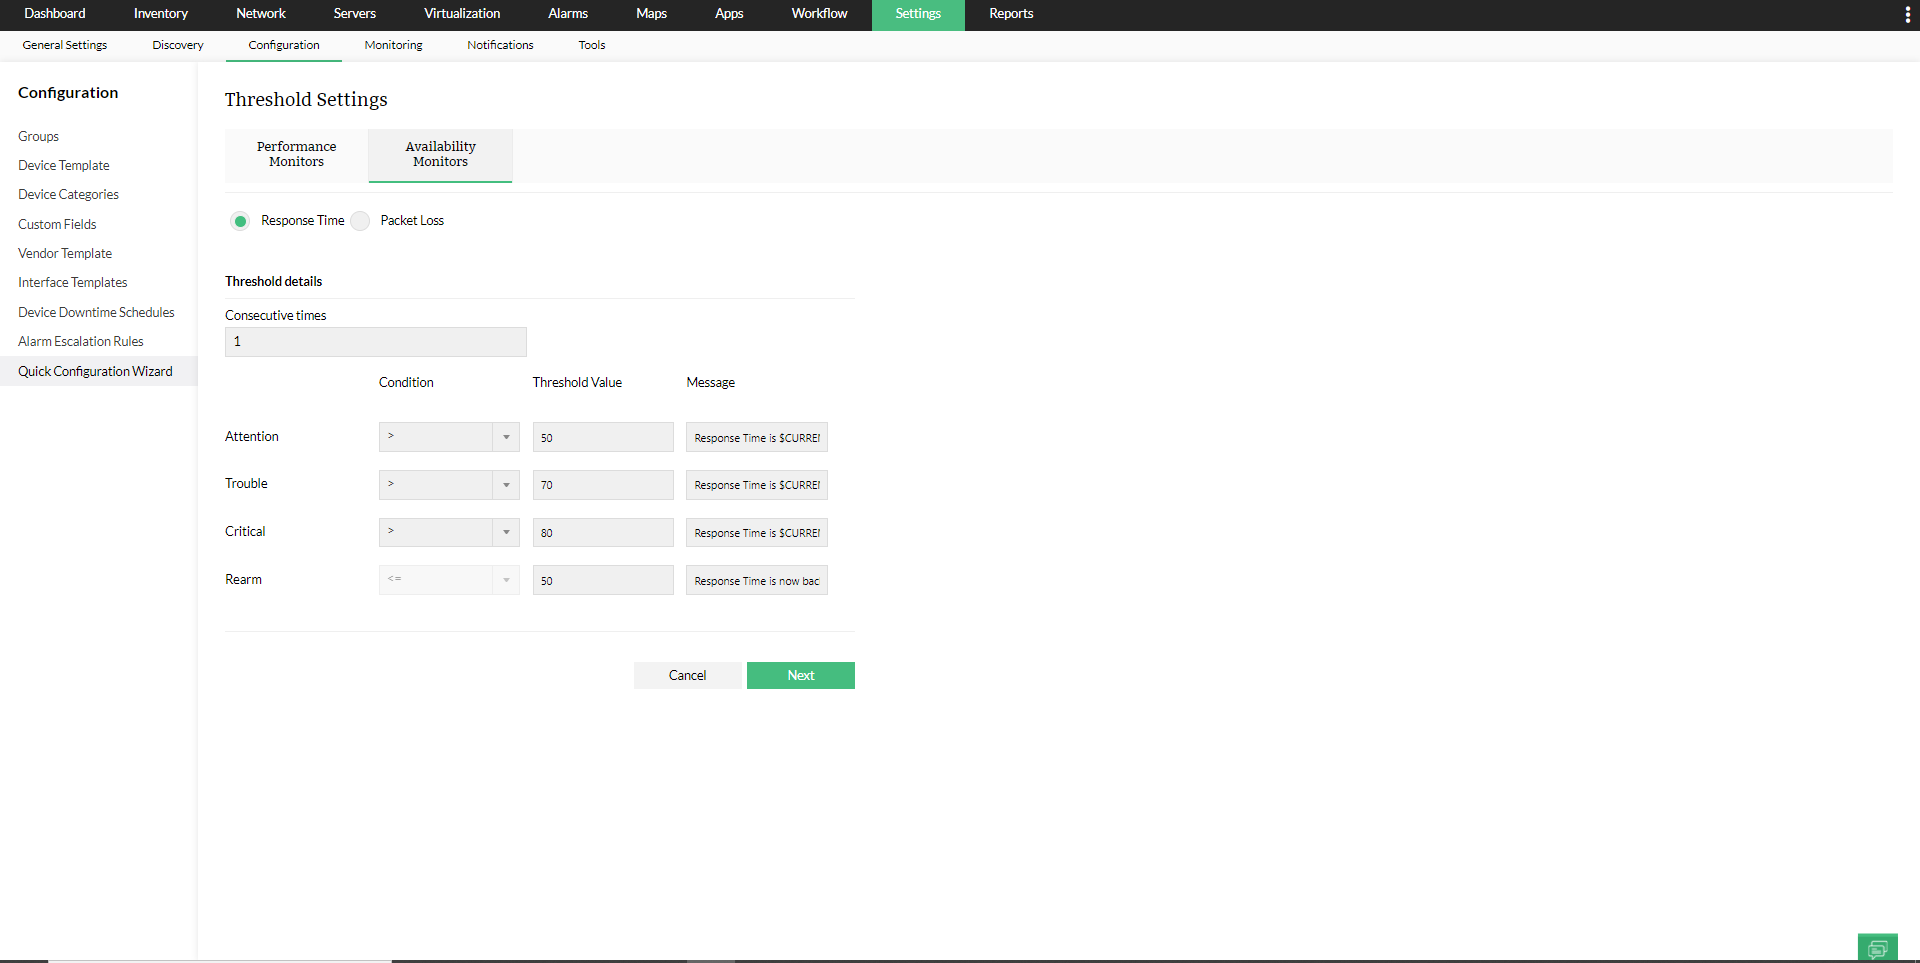
Configure thresholds for Availability monitors:
- Click on the Availability Monitors tab and choose Response Time or Packet Loss depending on your requirement.
- Configure the Threshold settings, such as Consecutive times - number of polls after which the Threshold alert should be generated, Threshold values for Attention Threshold, Trouble Threshold and Critical Threshold along with their corresponding message.
- Enter the desired Rearm value and the rearm message.
- Click on Next.
- Select the desired devices to apply the Threshold Settings from the list of 'Available Devices' and click on the right arrow to move them to the 'Selected Devices' column.
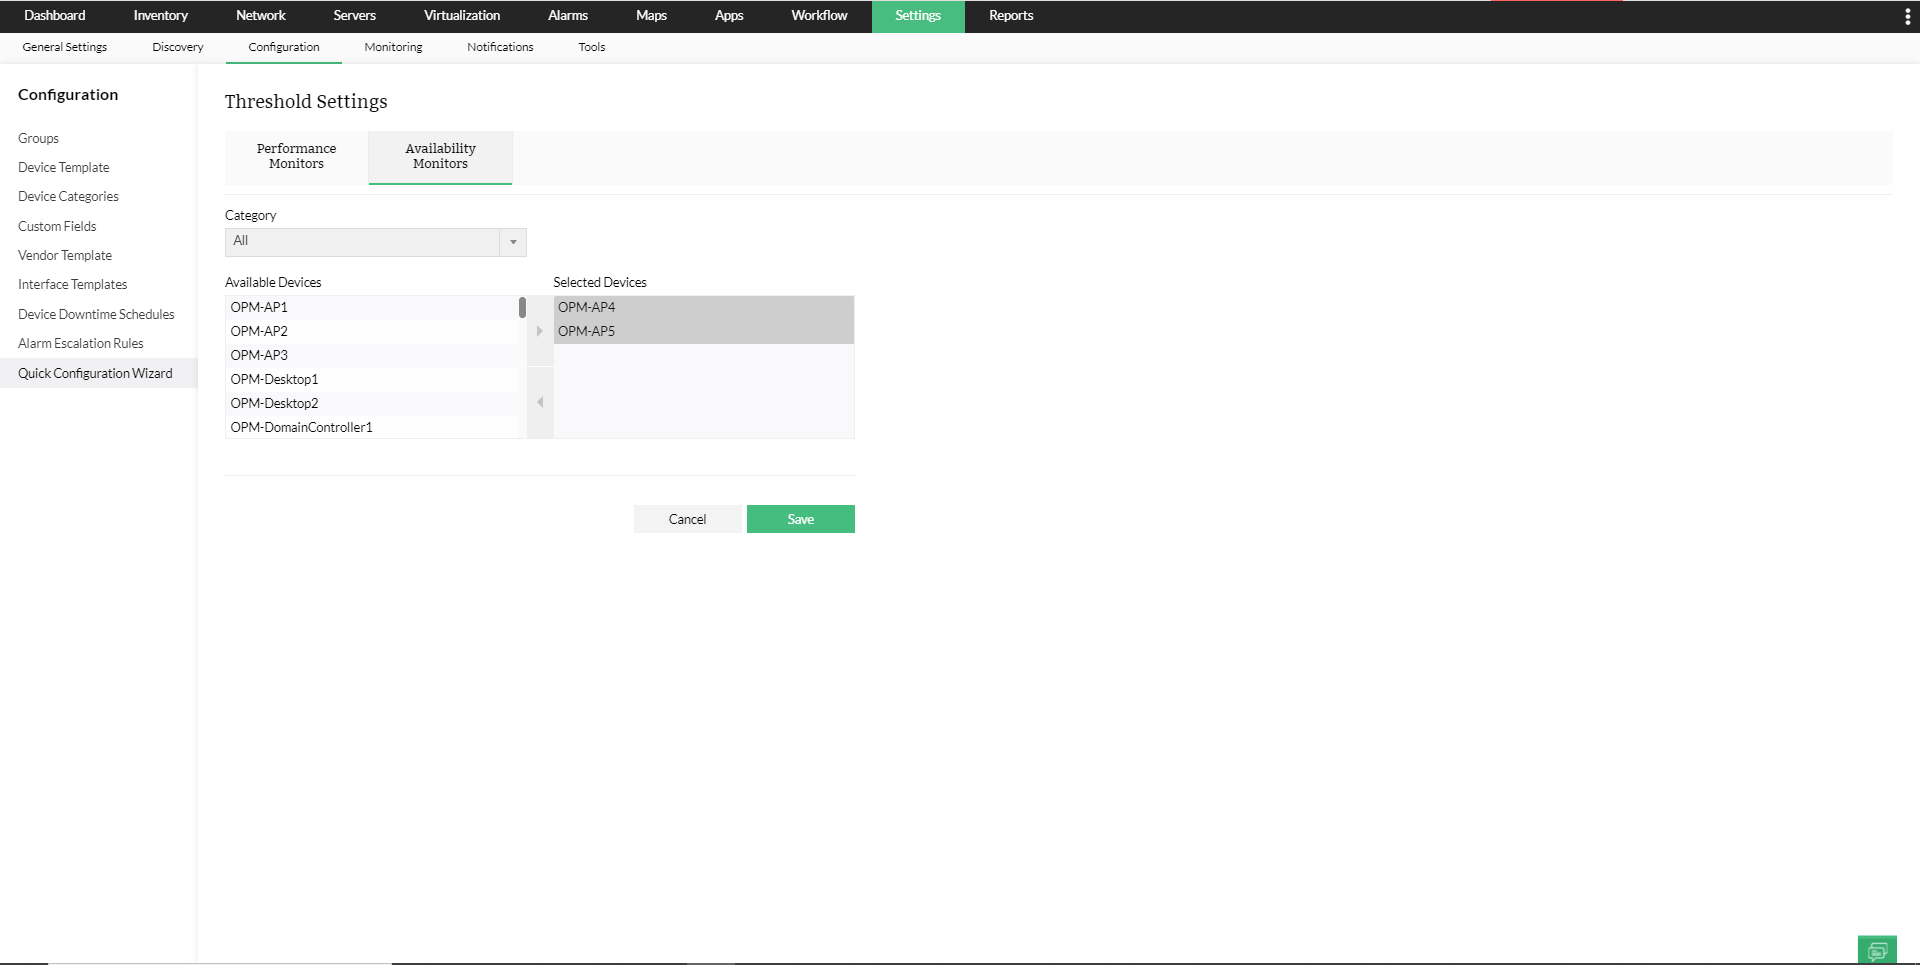
- Click Save.
Note: If you want to remove Threshold for the monitor, leave the Threshold related fields empty. Additionally, you can also set or remove thresholds from the Packet loss and Response time dials in the device snapshot page.
Event Log Rules:
The Event Log Rules option in QCW allows you to associate/dissociate event logs in bulk for specific rules.
- Select the LogFile.
- Select the Rule for which you want to configure event logs for.
- Select the required devices from the list of 'All Devices' and move them to the 'Event Log associated devices' column (remove the devices from the 'Event Log associated devices' column if you want to dissociate event logs for the devices).
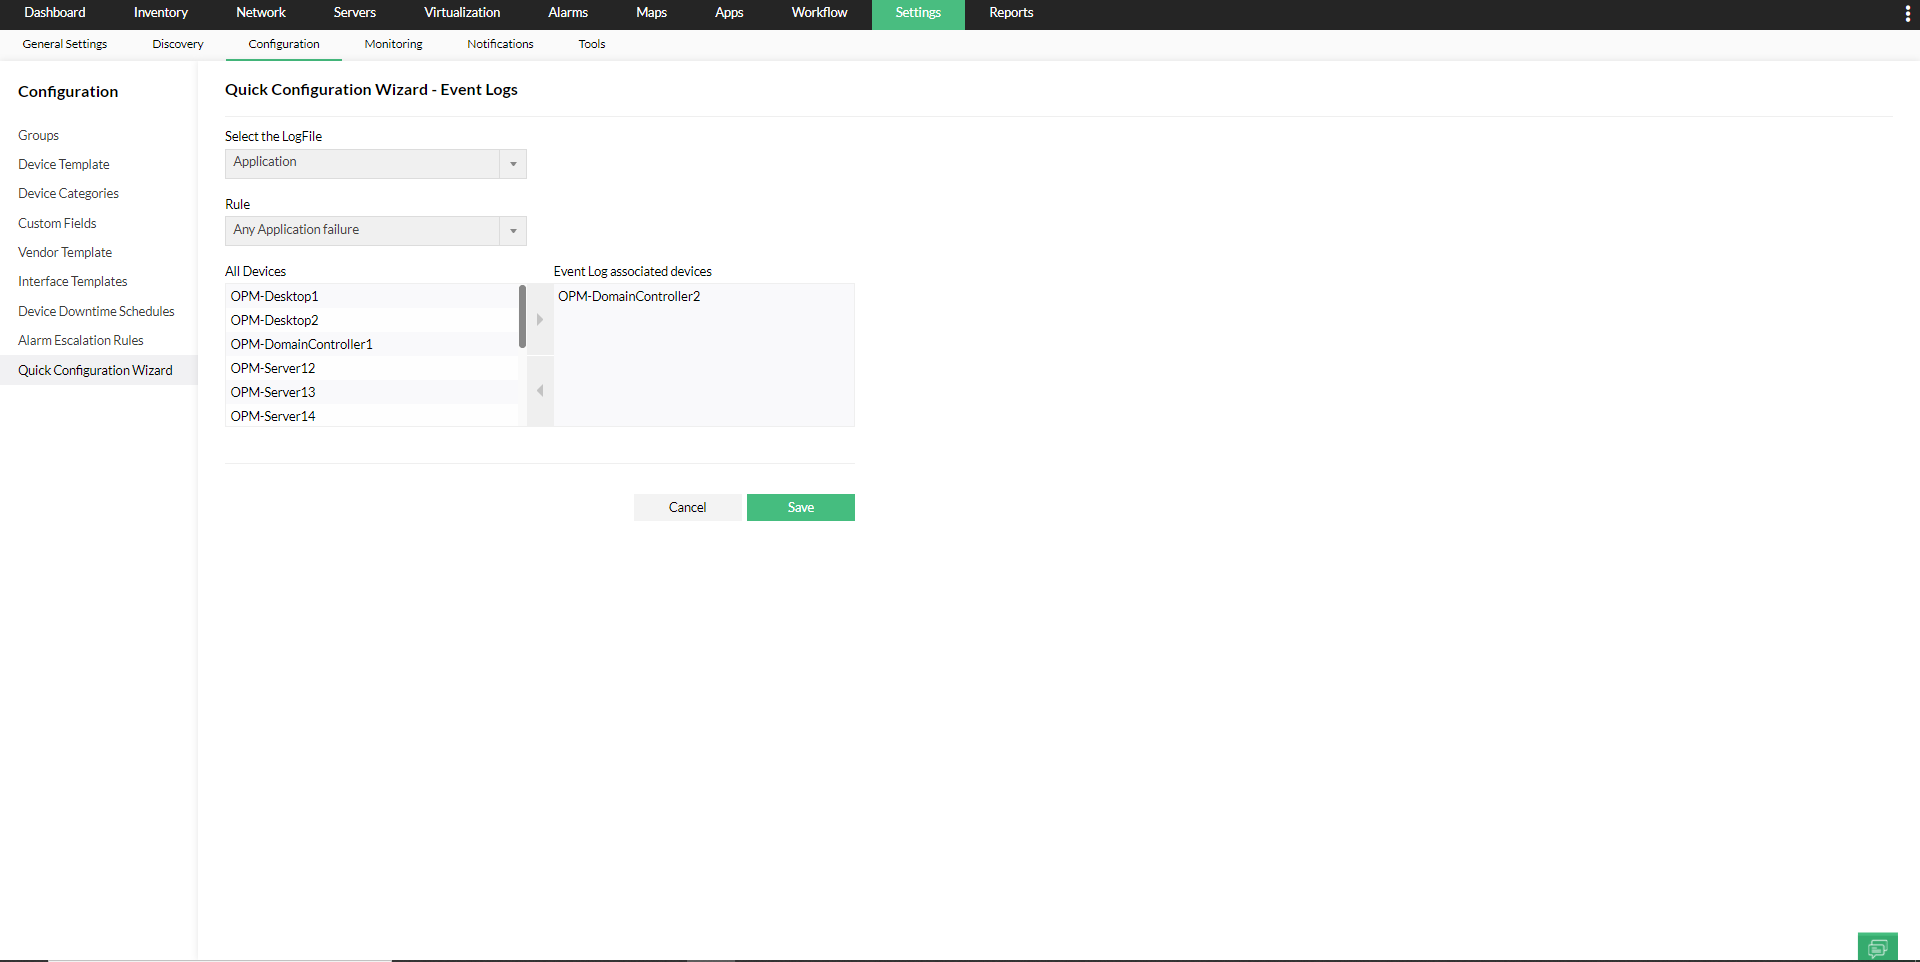
- Click on Save.
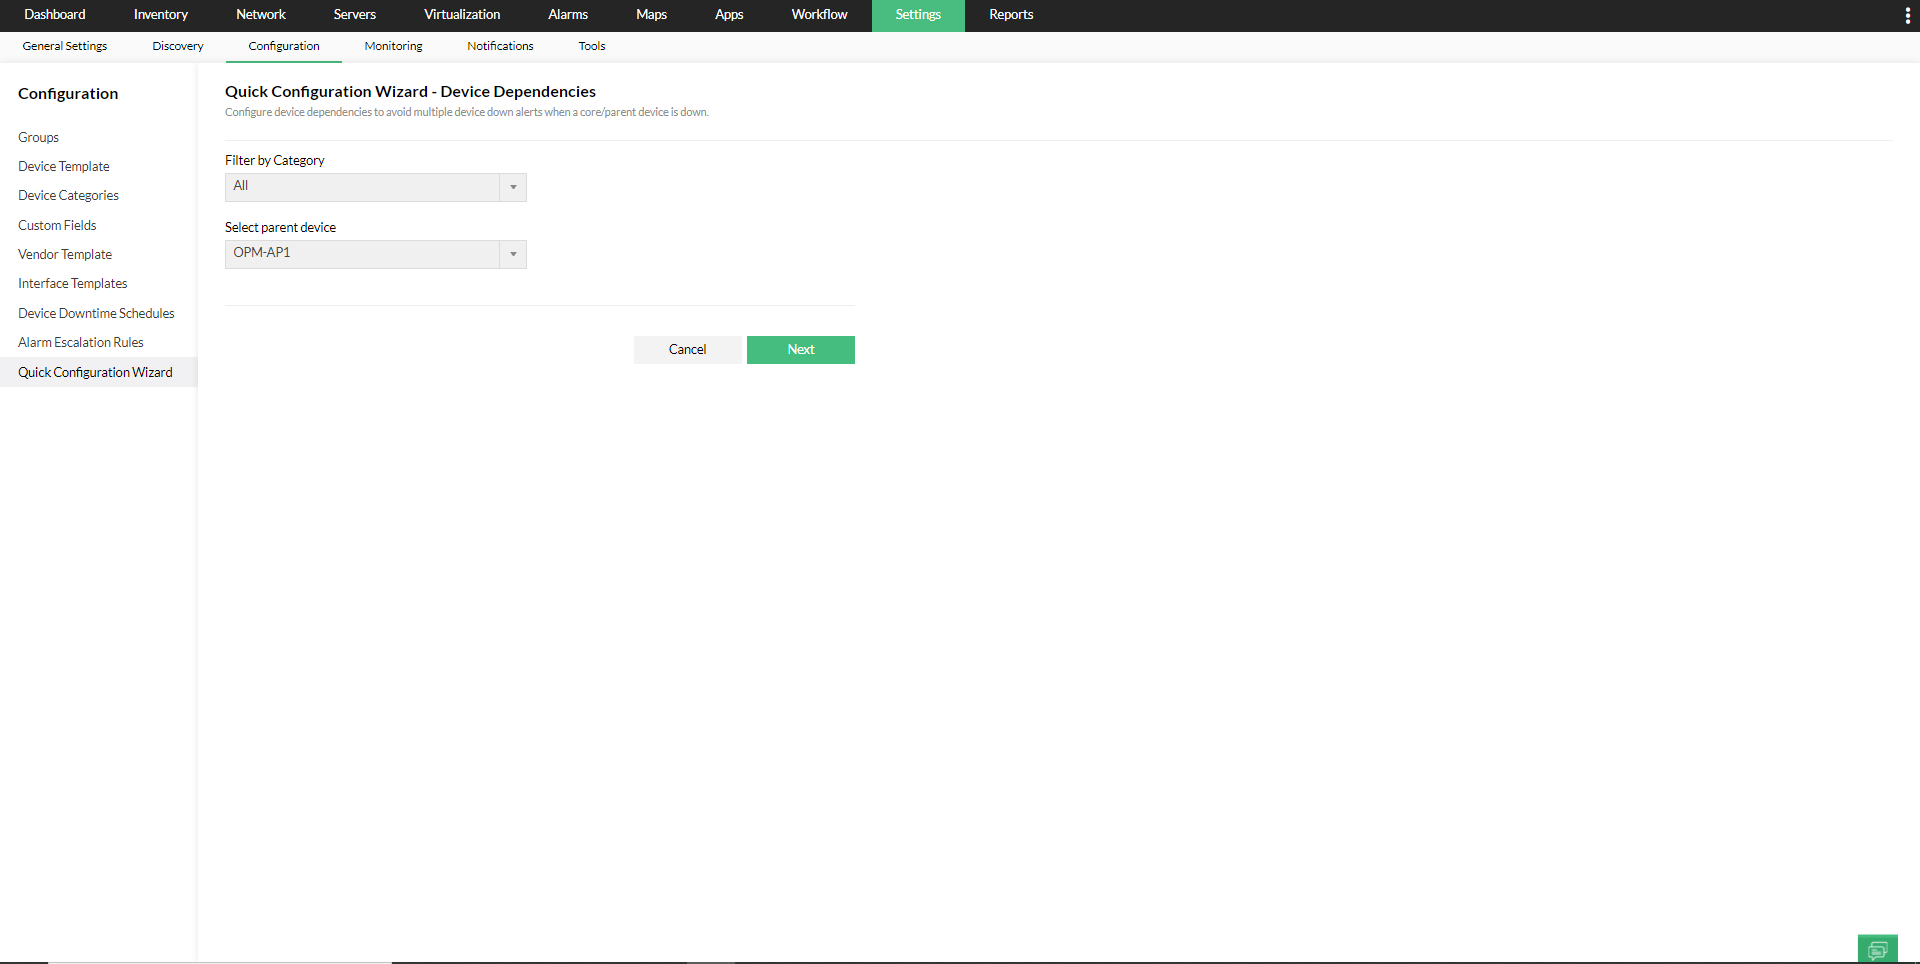
Device Dependencies:
Configure device dependencies to avoid multiple device down alerts when a core/ parent device is down. It also pauses the Availability monitoring of child devices when the parent device is down, thereby optimizing the performance of OpManager.
- Filter by Category, choose parent device and click 'Next'.
- Choose if you want to assign to all devices in a category, a specific Business View or manually group devices that you want to associate as dependent or child of the parent device chosen.
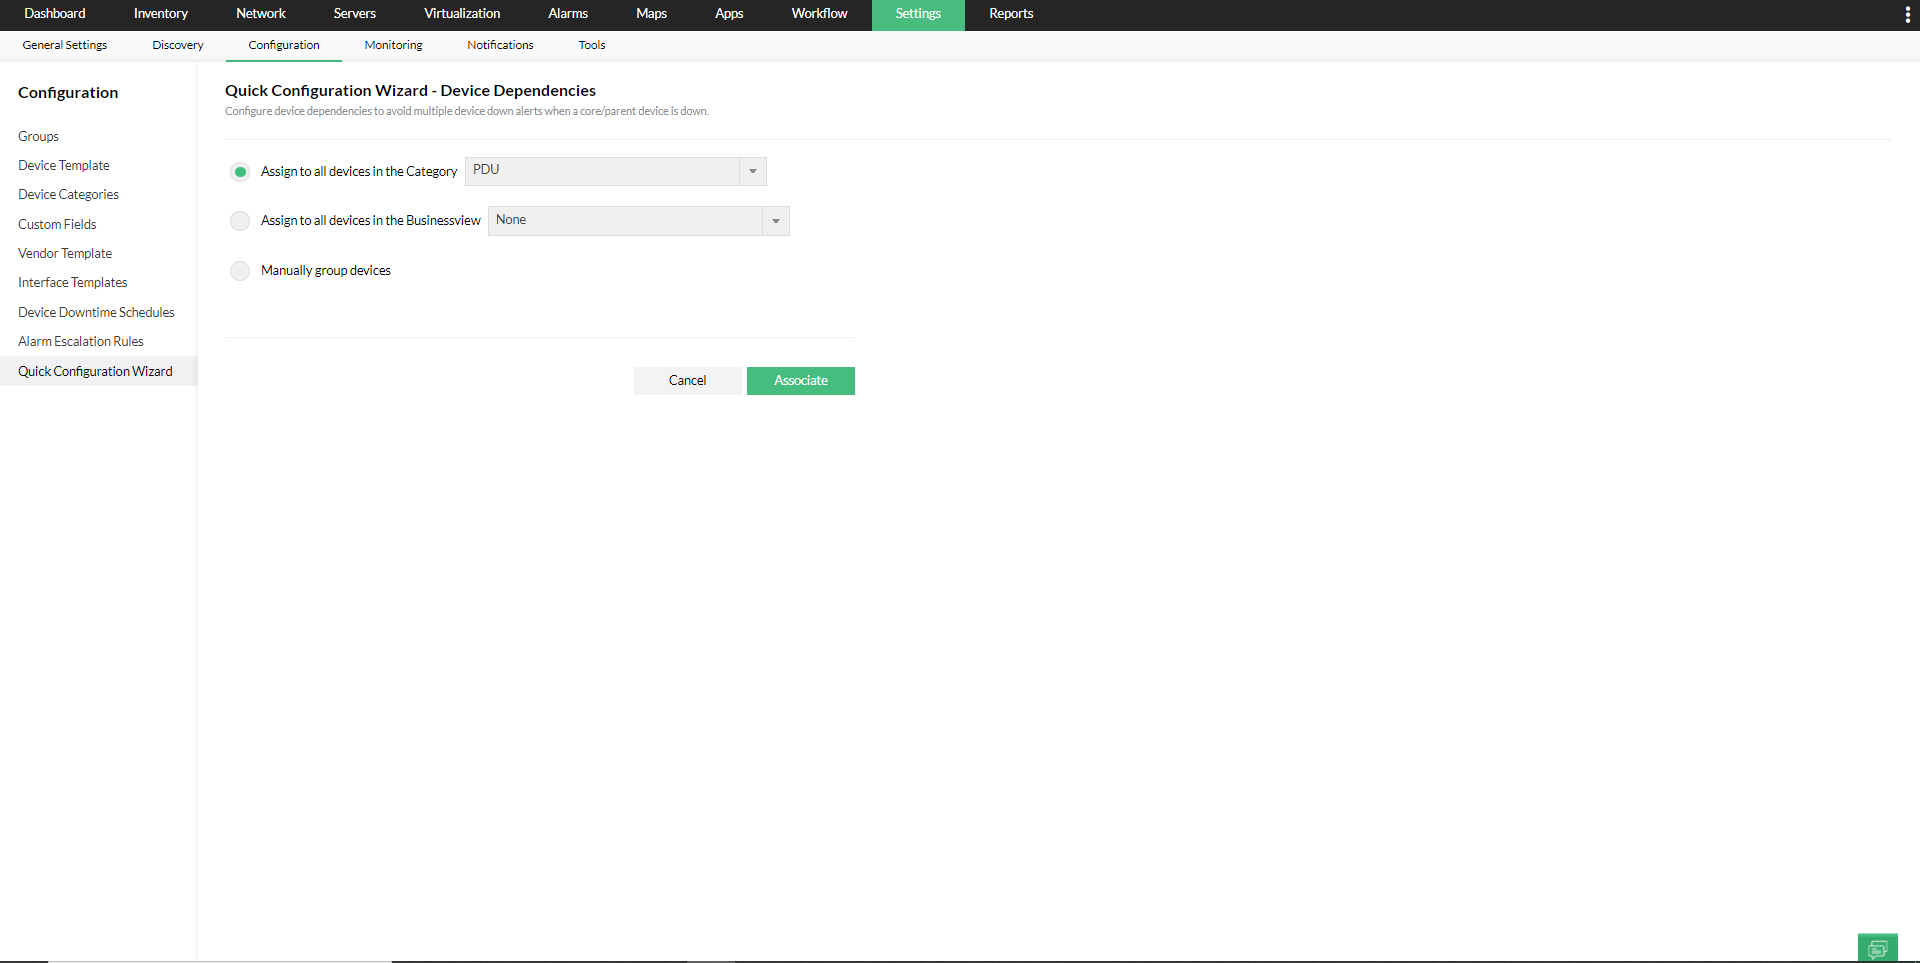
- Click on Associate.
Note: Get a report of all dependent devices listed with their parent device from the Uplink Dependency Devices report under Inventory reports in the Reports tab.
Credentials:
Using Quick Configuration Wizard - Credentials, you can associate or dissociate a credential to selected devices.
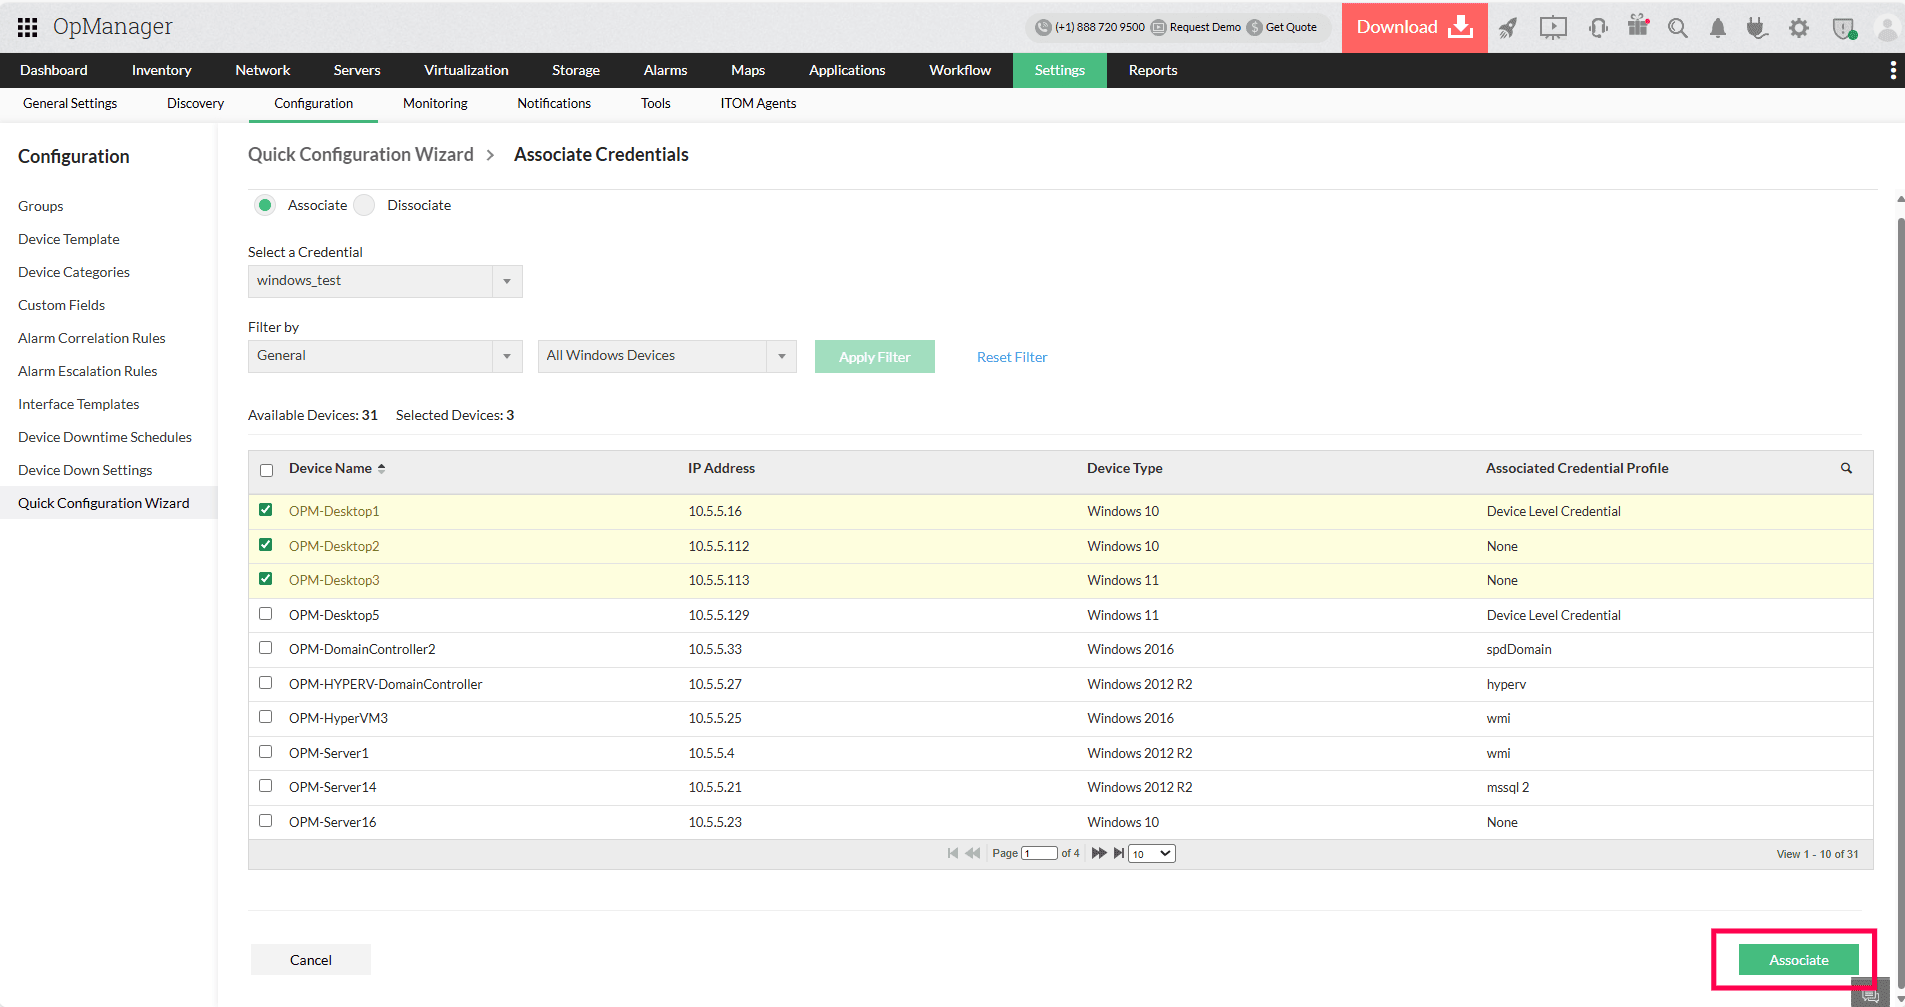
Steps to Associate Credentials:
- Choose Associate (this option will be selected by default)
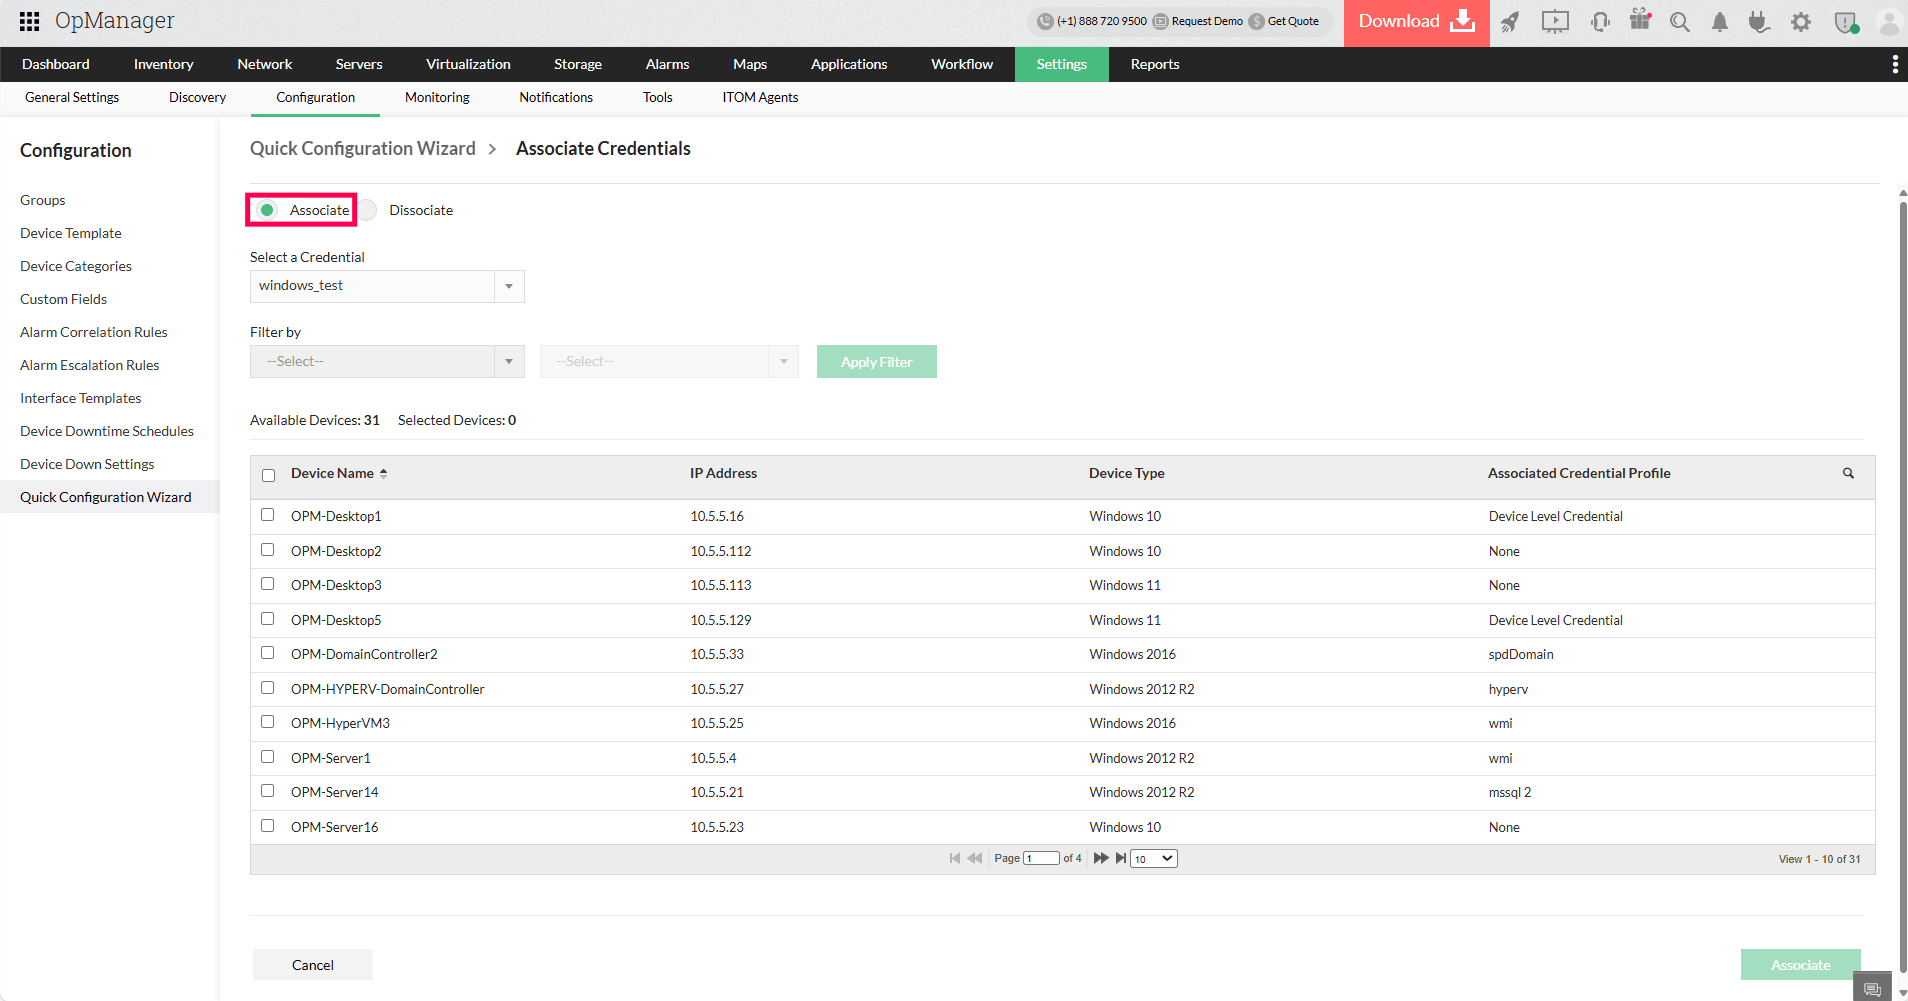
- From the Select a Credential dropdown, choose the appropriate credential
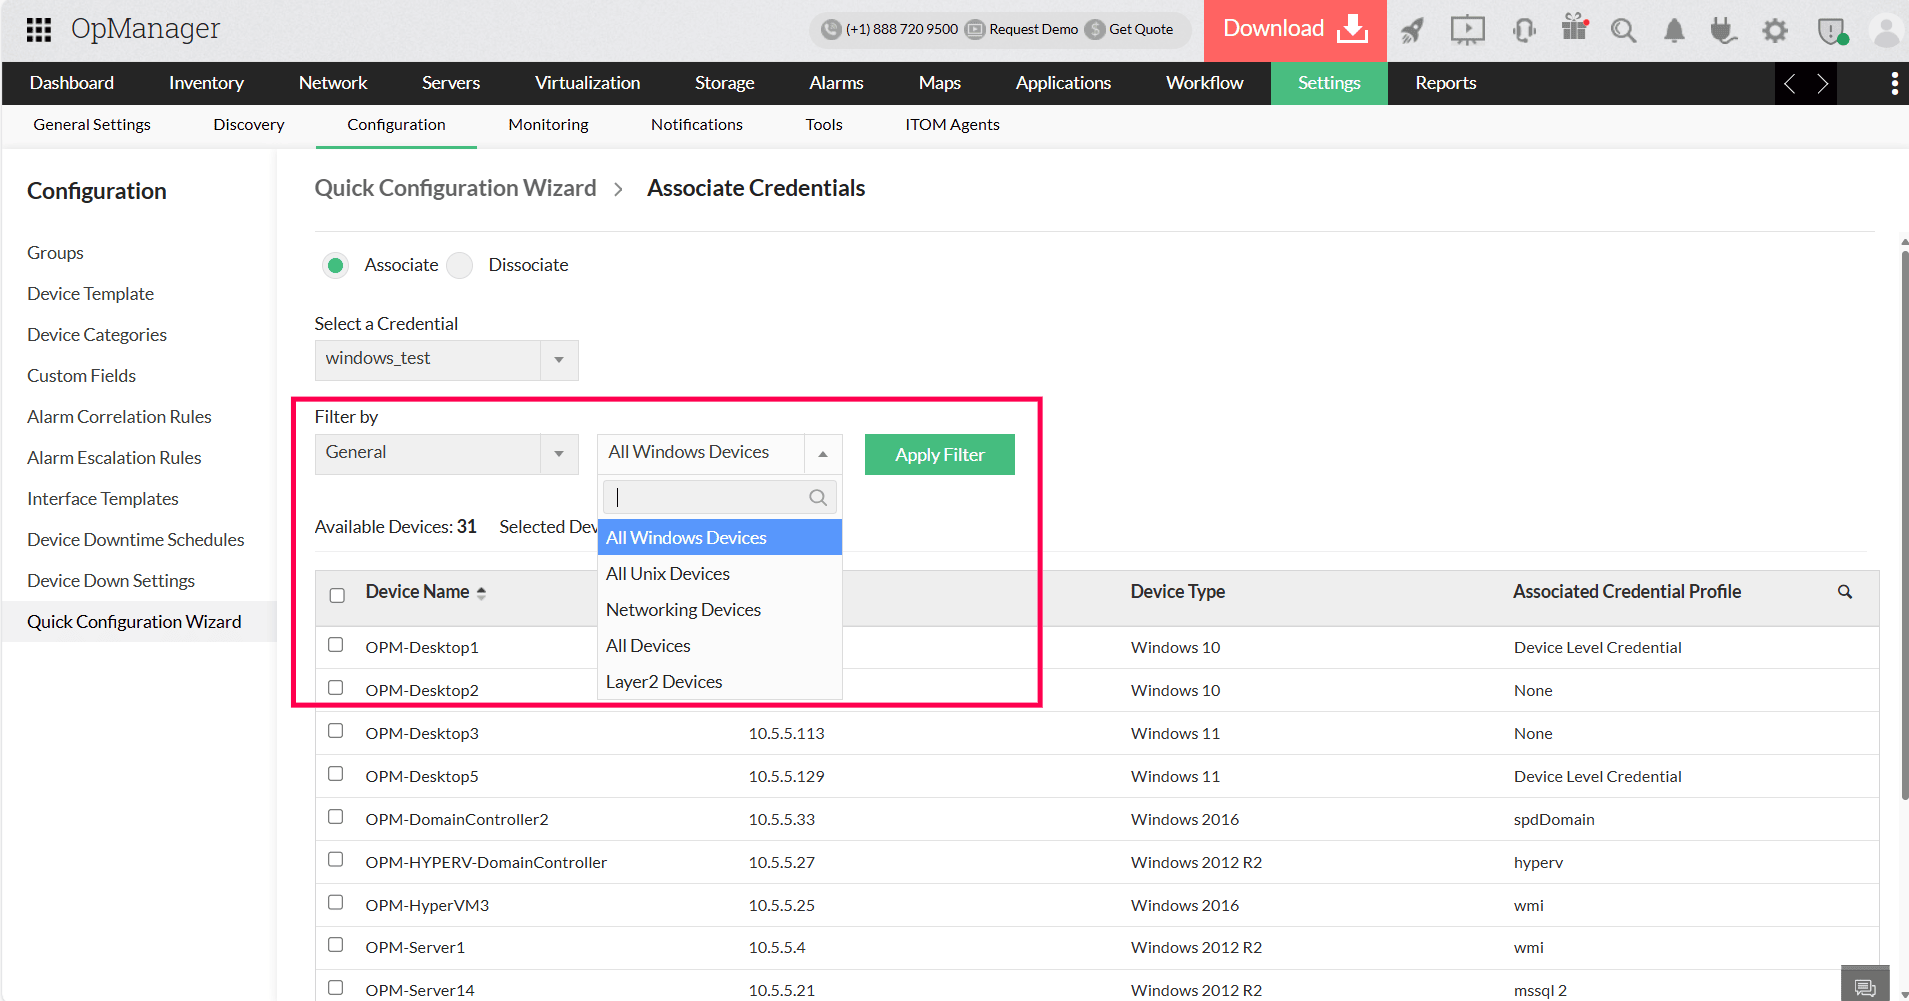
- Use the Filter by dropdowns to narrow down devices if needed. Available filters are Category, General, Business View, Virtual Servers, Groups.
- Click Apply Filter to refine the device list
- Select the checkbox next to the device(s) you want to associate the credential with
- Verify the selected devices once and click the Associate button to apply the credentials
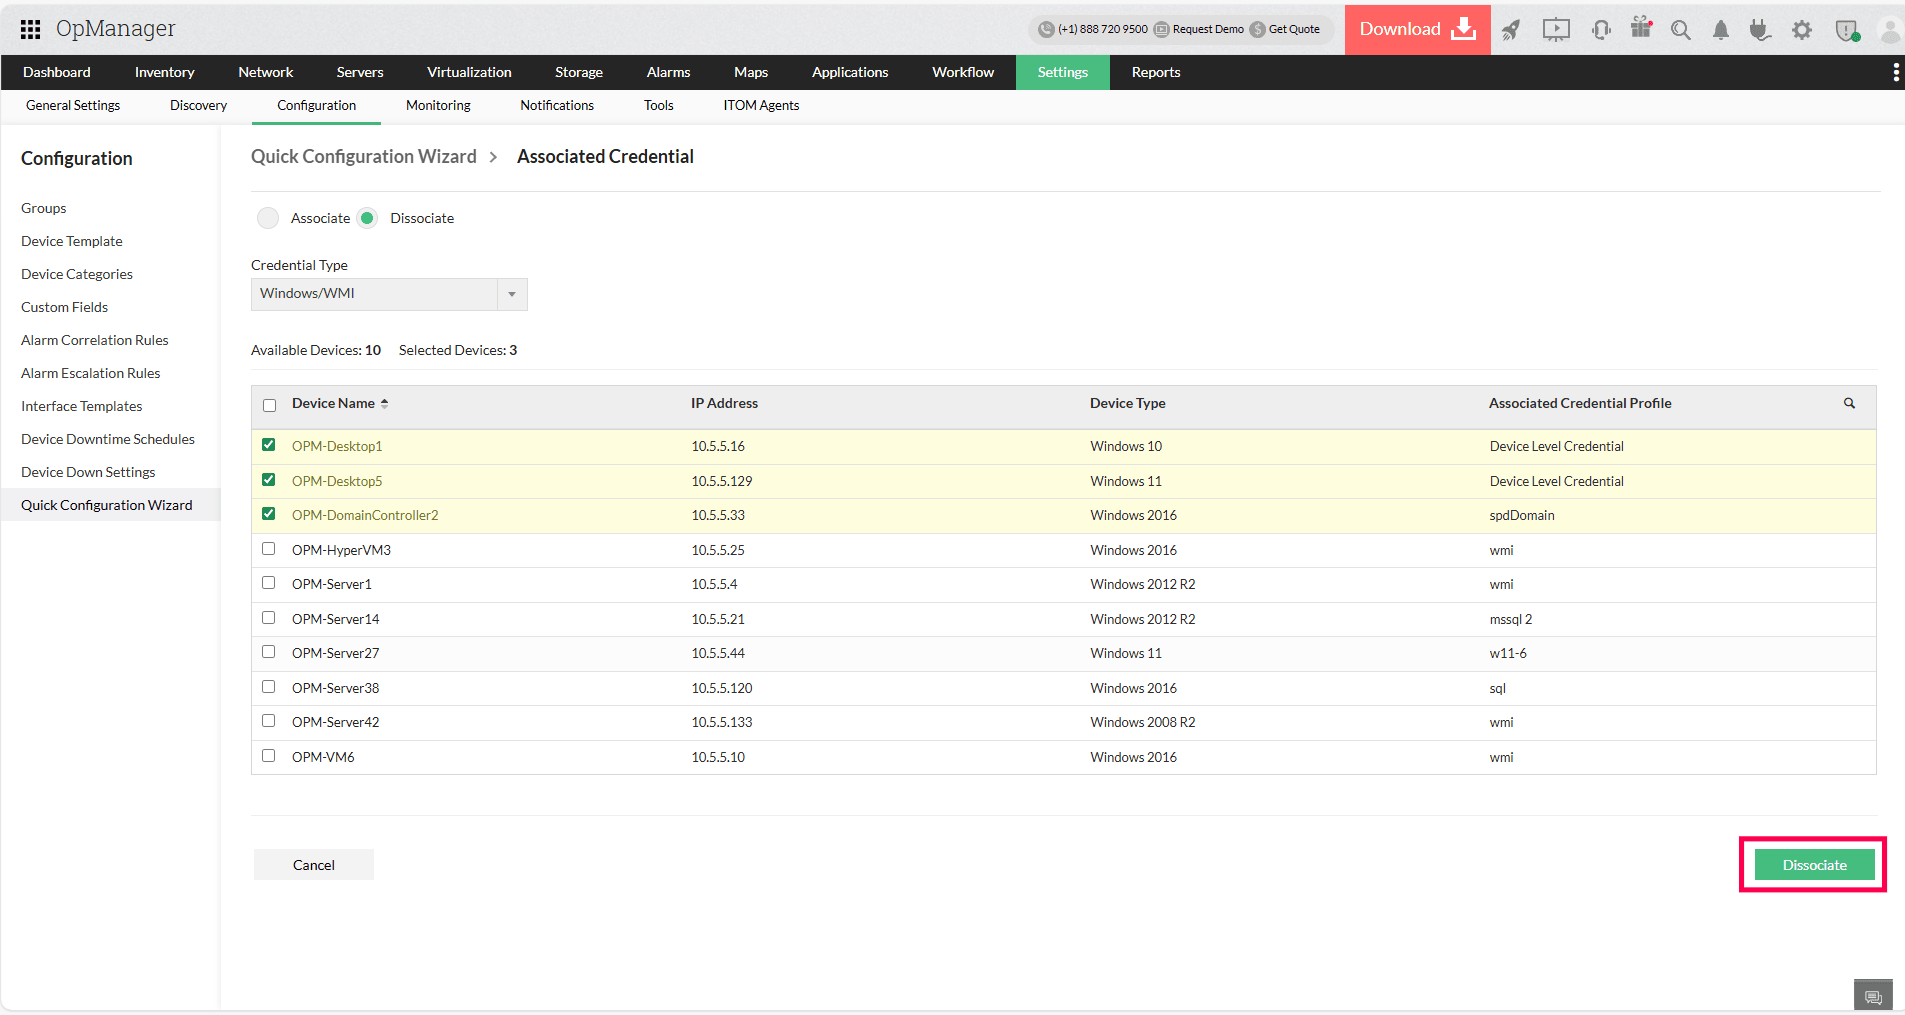
Steps to Dissociate Credentials:
Choose Dissociate
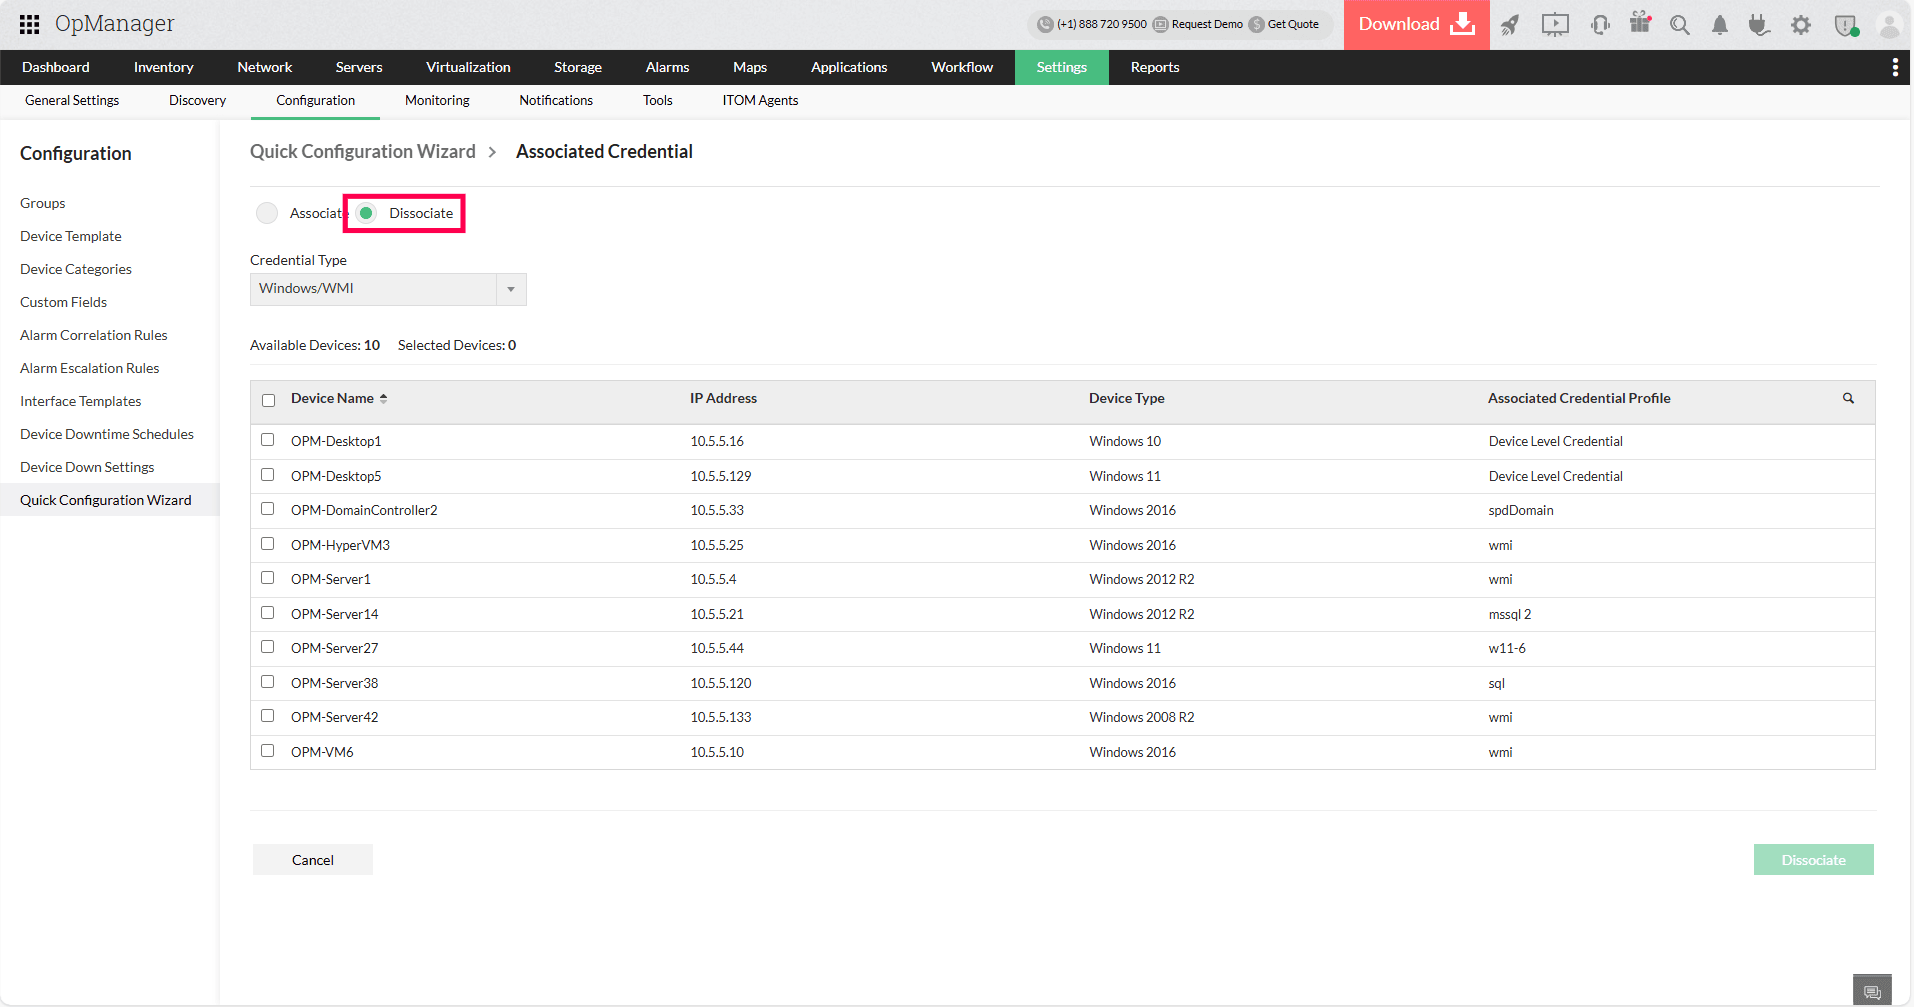
- From the Credential Type dropdown, choose the type of credential to remove from the devices
- The devices that have the credentials associated will be listed
- Check the checkbox next to the device(s) you want to dissociate the credential from
- Verify the selected devices and click the Dissociate button to remove the credentials
Delete Devices:
Use the Delete Devices tab in QCW to delete devices from your OpManager database in bulk. Deleted devices need to be rediscovered and configured from scratch before they are monitored again.
- Select a category that you want to delete devices for.
- Select the devices you want to delete from the 'Devices in the selected category' column and press the right arrow.
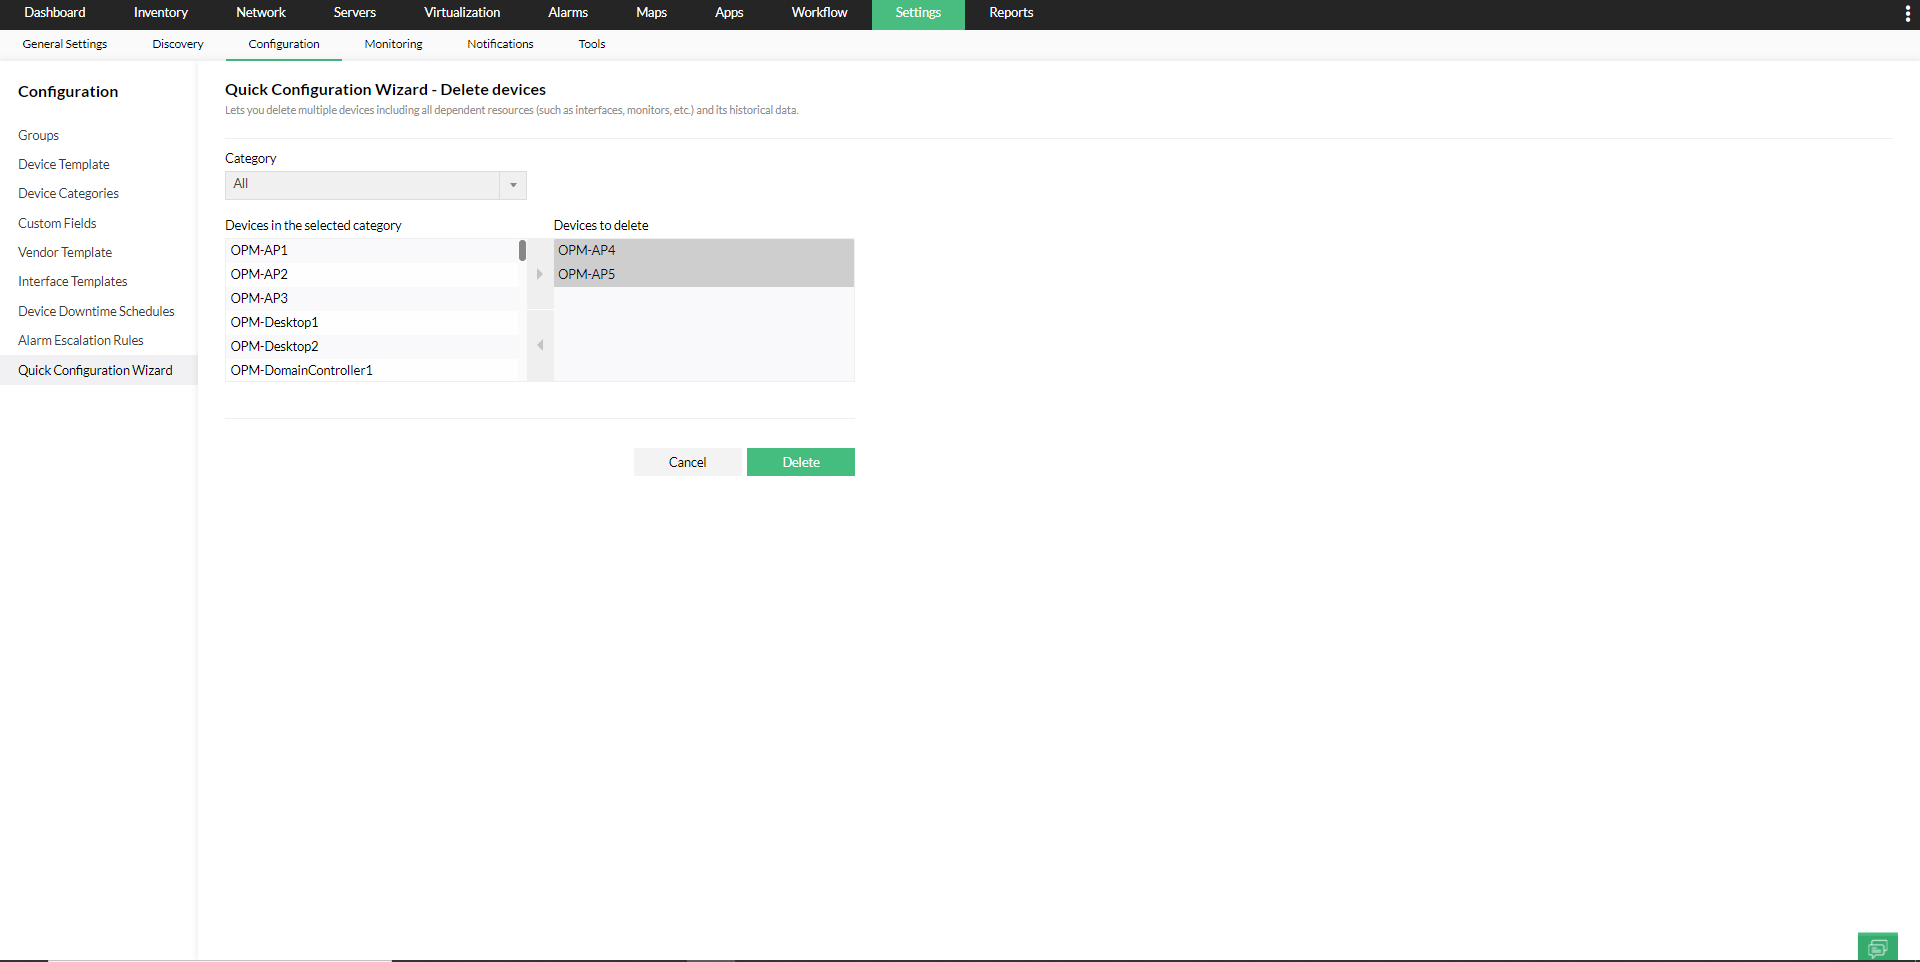
- Once you've moved all the devices that you want to delete to the 'Devices to delete' column, click on the 'Delete' button.
Note: Deleting the devices will lead to the loss of historical data of the availability monitors, associated performance monitors and interfaces.
Manage / Unmanage Devices:
By default, OpManager manages all the discovered devices. However, there might be some known devices in your network that are either down or under planned maintenance and hence cannot respond to status polls sent by OpManager. These devices can be set to 'Unmanaged' status to avoid unnecessary polling. Once maintenance gets over, they can be set to managed status.
The associated device and its historical data will remain intact when you re-manage.
- Select the Category of the devices you want to un-manage.
- Select the devices you want to un-manage from the 'Managed Devices' column and select the right arrow to move them to the 'Unmanaged Devices' column.
- If you want to re-manage previously un-managed devices, you can select them from the 'Unmanaged Devices' column, select the left arrow and move them to the 'Managed Devices' column.
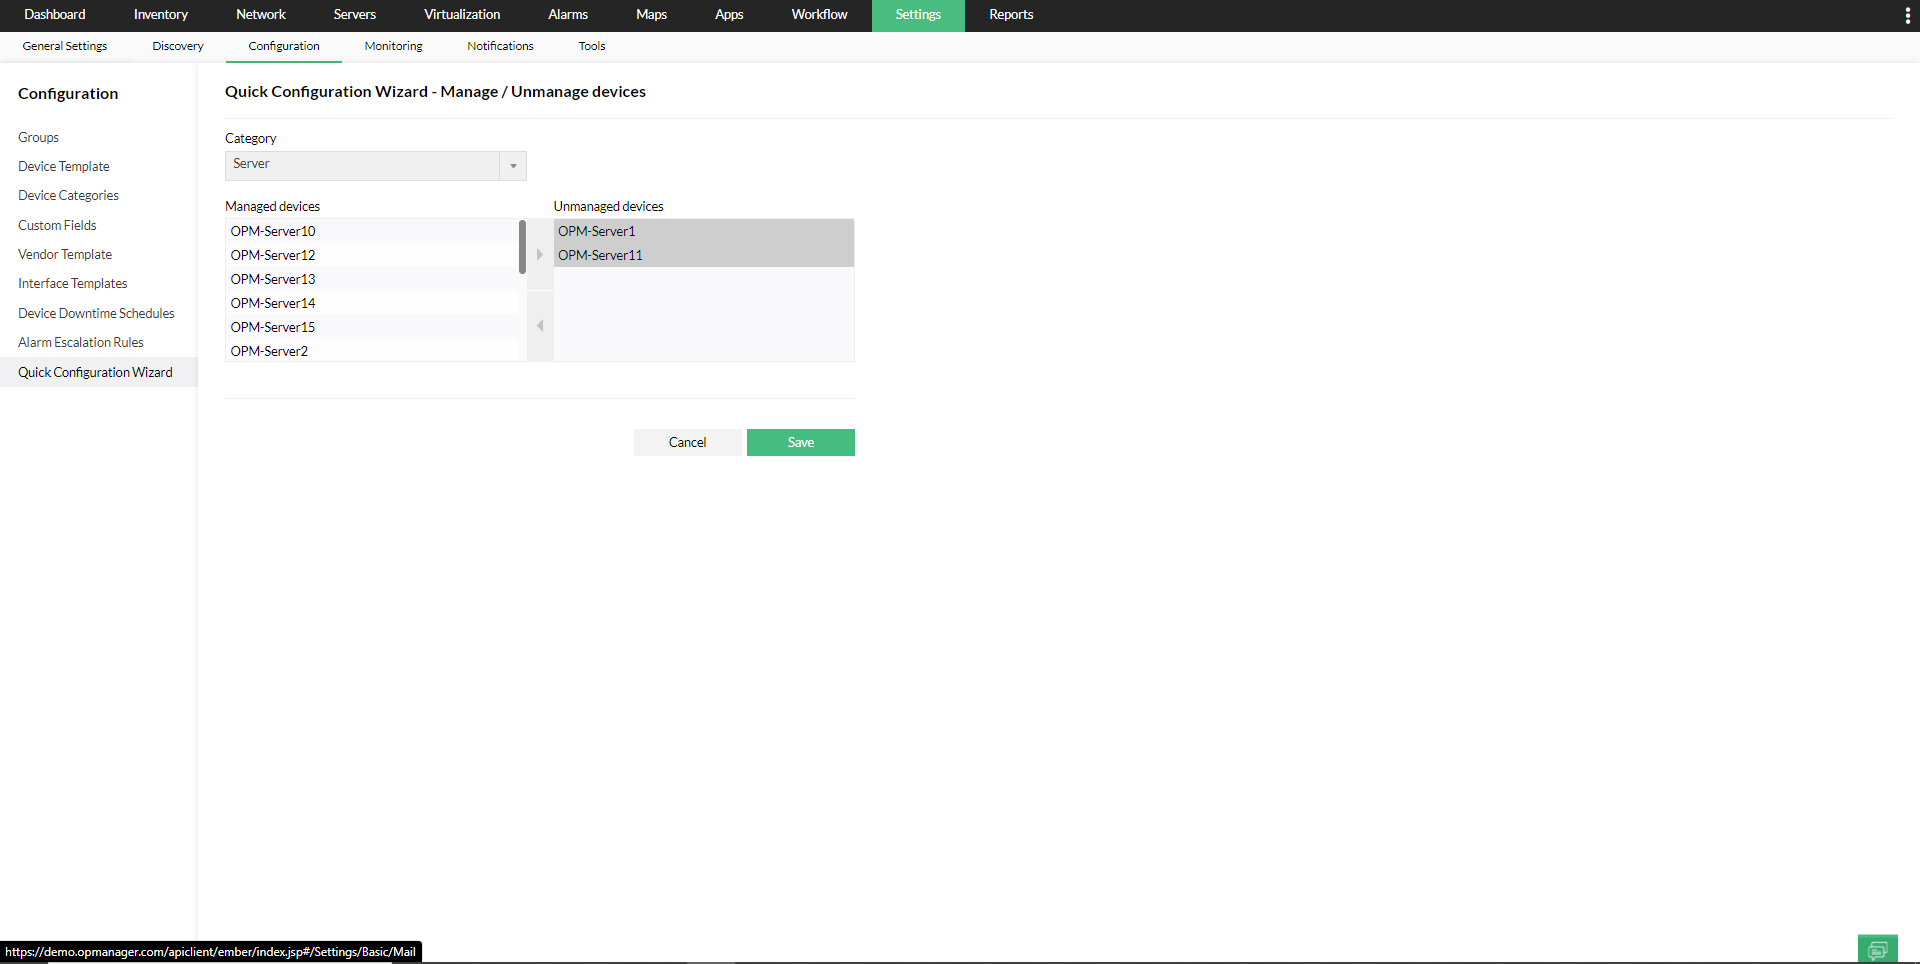
- Click on the 'Save' button.
Alternatively, you can also Manage/ Unmanage devices from the inventory page. Go to Inventory → Devices → Click on the device that you want to Manage/ Unmanage and go to the device snapshot page → Click on the 'more' option on the top right → Click on Manage/Unmanage.
Note: To perform this operation automatically, use Device Downtime Scheduler.
Alarm Suppression:
The Alarm Suppression option in QCW enables you to suppress alarms for Devices, Business Views and Groups.
- Select Category if you want to suppress alarms for devices by sorting by category, select "Business Views" if you want to suppress alarms for Business Views, select "Groups" if you want to suppress alarms for Groups.
- Choose the 'Time Period' for which you want alarms suppressed from the drop down.
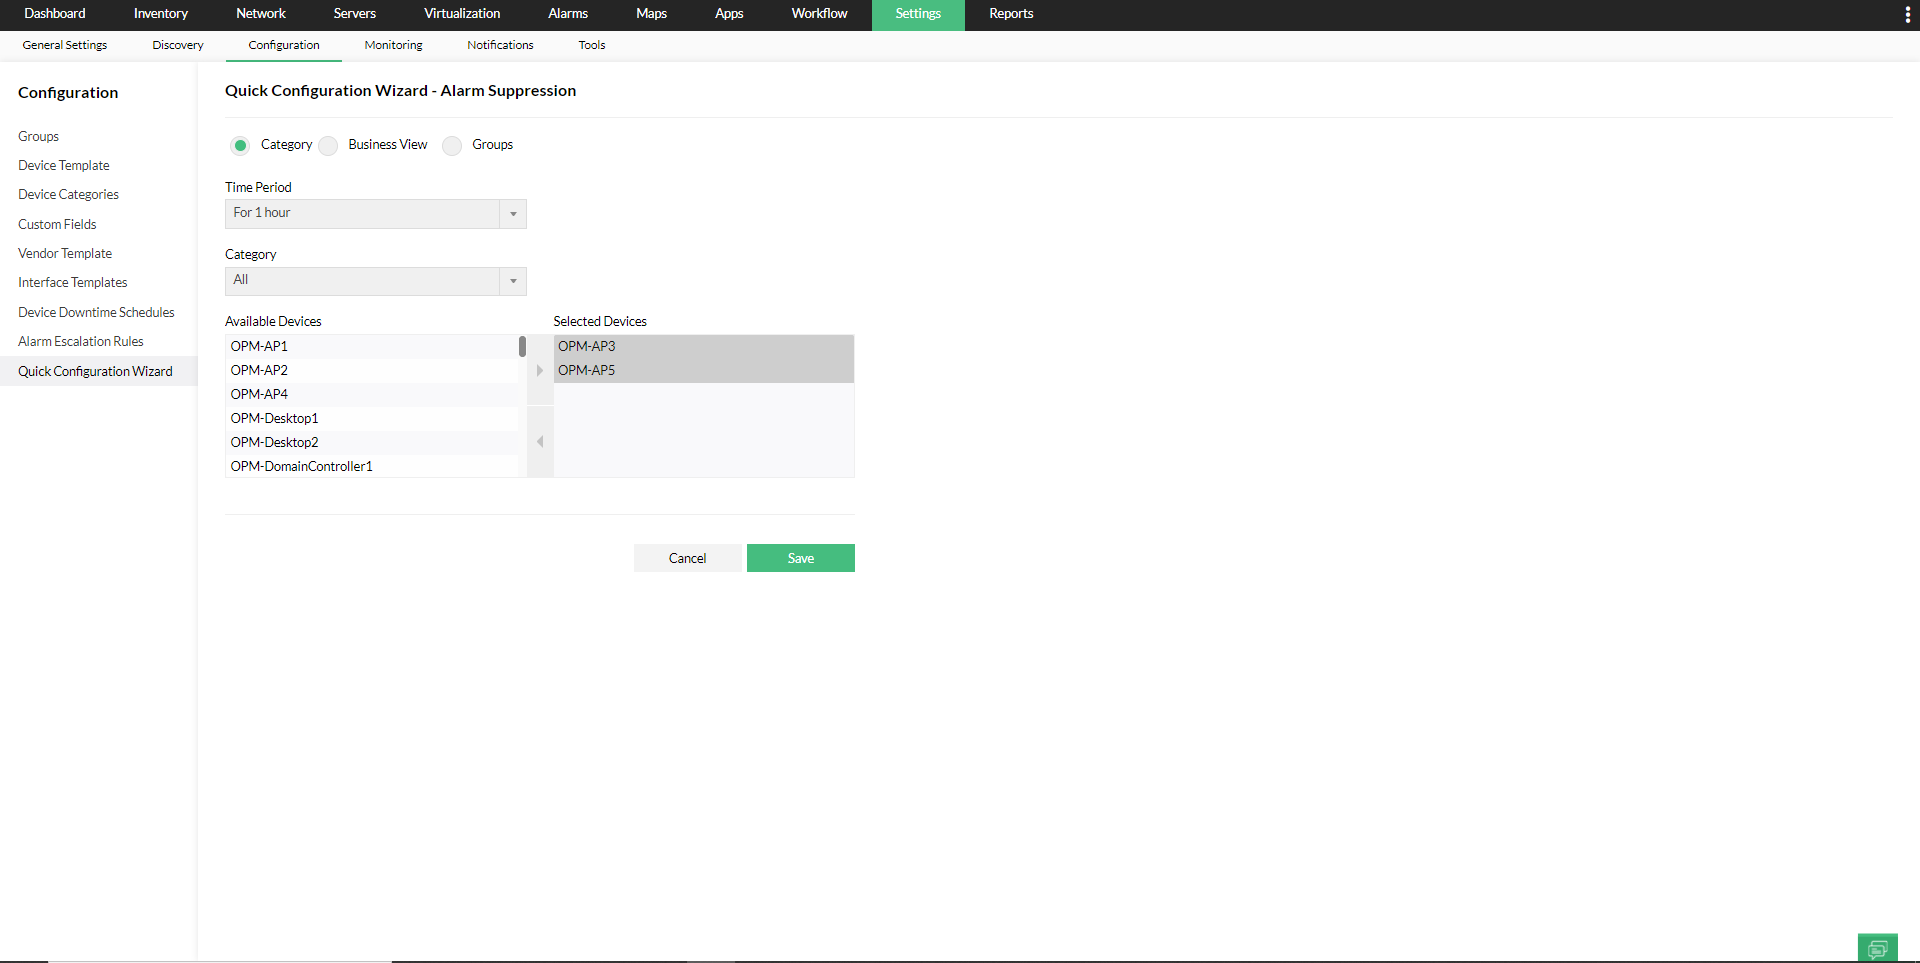
- Select the Devices/ Business Views/ Groups for which you want to suppress alarms for.
- Click on the 'Save' button.
Monitoring Interval:
Using the Monitoring Interval tab in QCW, you can modify the availability monitoring interval for all devices in a category and disable or enable availability status polling of all devices in a category.
- Set the monitoring interval in the 'Monitoring Interval (Minutes)' column for the category of devices you want to make changes for.
If the 'Monitoring Interval (Minutes)' is changed, then the status polling interval for 'Availability Monitoring' is changed. That is, if status polling occurred every 15 minutes before and the 'Monitoring Interval (Minutes)' column has been changed to 30 minutes, then status polling will occur every 30 minutes now for the devices. - Enable/Disable status polling (Availability monitoring) for devices using the 'Enable' checkbox.
If the status polling is disabled, then the devices will not be polled and hence 'Availability Monitoring' for the selected devices will be stopped.
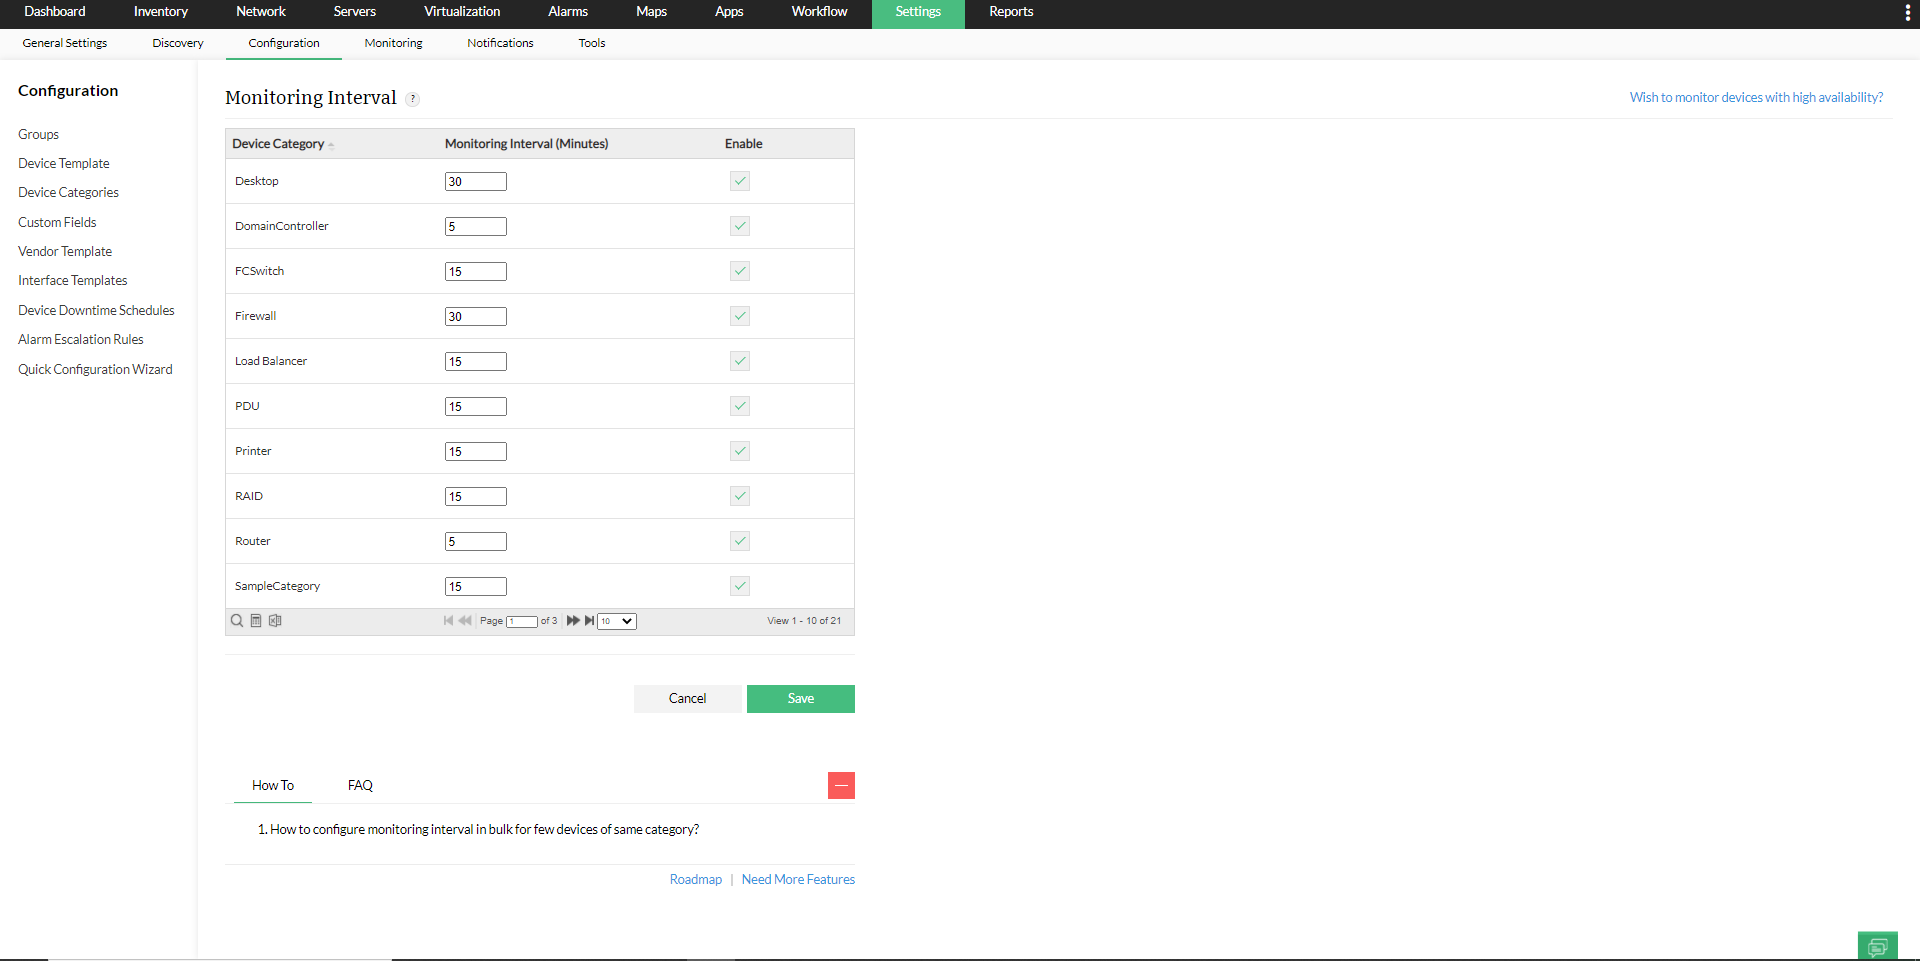
- Click on the 'Save' button.
Note: You can also set monitoring interval and status polling for random devices from the Inventory page.
Update Device Display Name:
You can update the display name of devices in bulk using this option. You can do this either by uploading a CSV file with the device name or IP address, and the respective display name or by querying the device itself.
- To update device name using a CSV file, upload the file in the 'CSV file Import' tab and click 'Update'.
- To update device name by querying devices using the associated credentials:
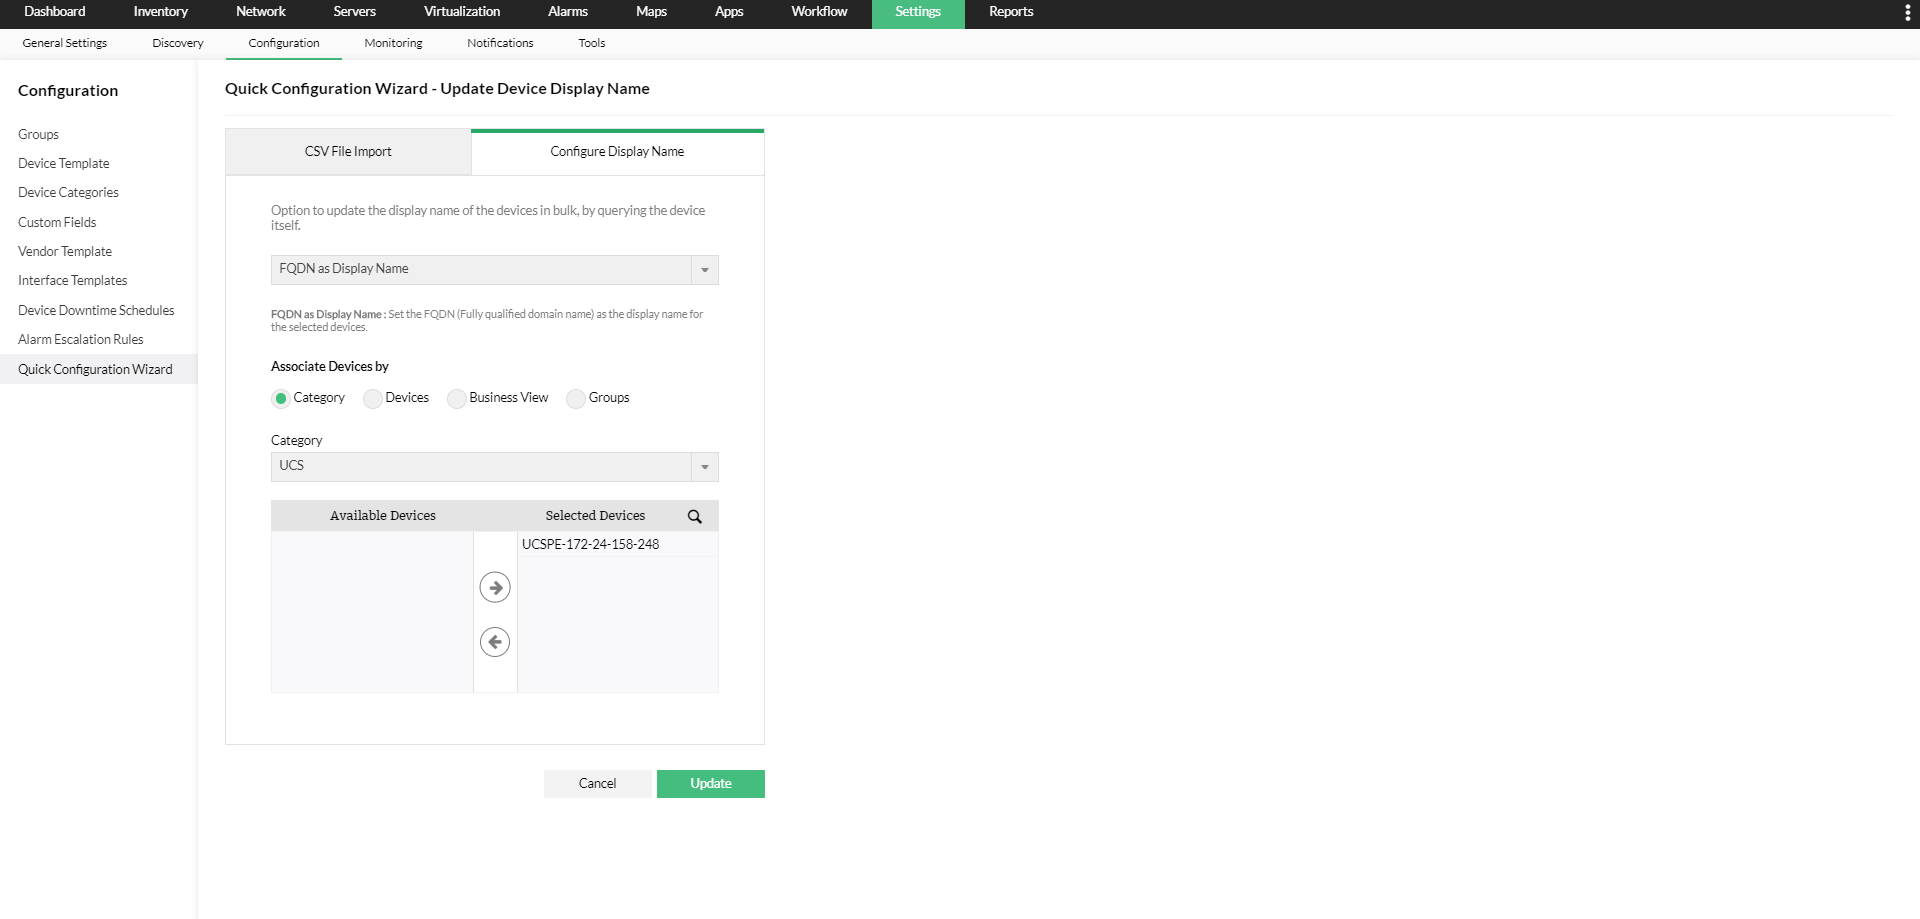
- Select if you want to configure the device name to its FQDN , Hostname, or sysName:
- FQDN (Fully qualified domain name) - If the device display name is configured to its FQDN, the device will be queried and the device display name will be changed to its FQDN, that is its Hostname + Domain name.
- Hostname - If the device display name is configured to its Hostname, then the device will be queried and its Hostname will become its device display name.
- sysName - Set the sysName (queried from the device using SNMP) as the display name for the selected devices.
- Select the desired Devices or or filters such as Business Views or Groups and choose the devices whose display name need to be updated in OpManager.
- Click on the 'Update' button.
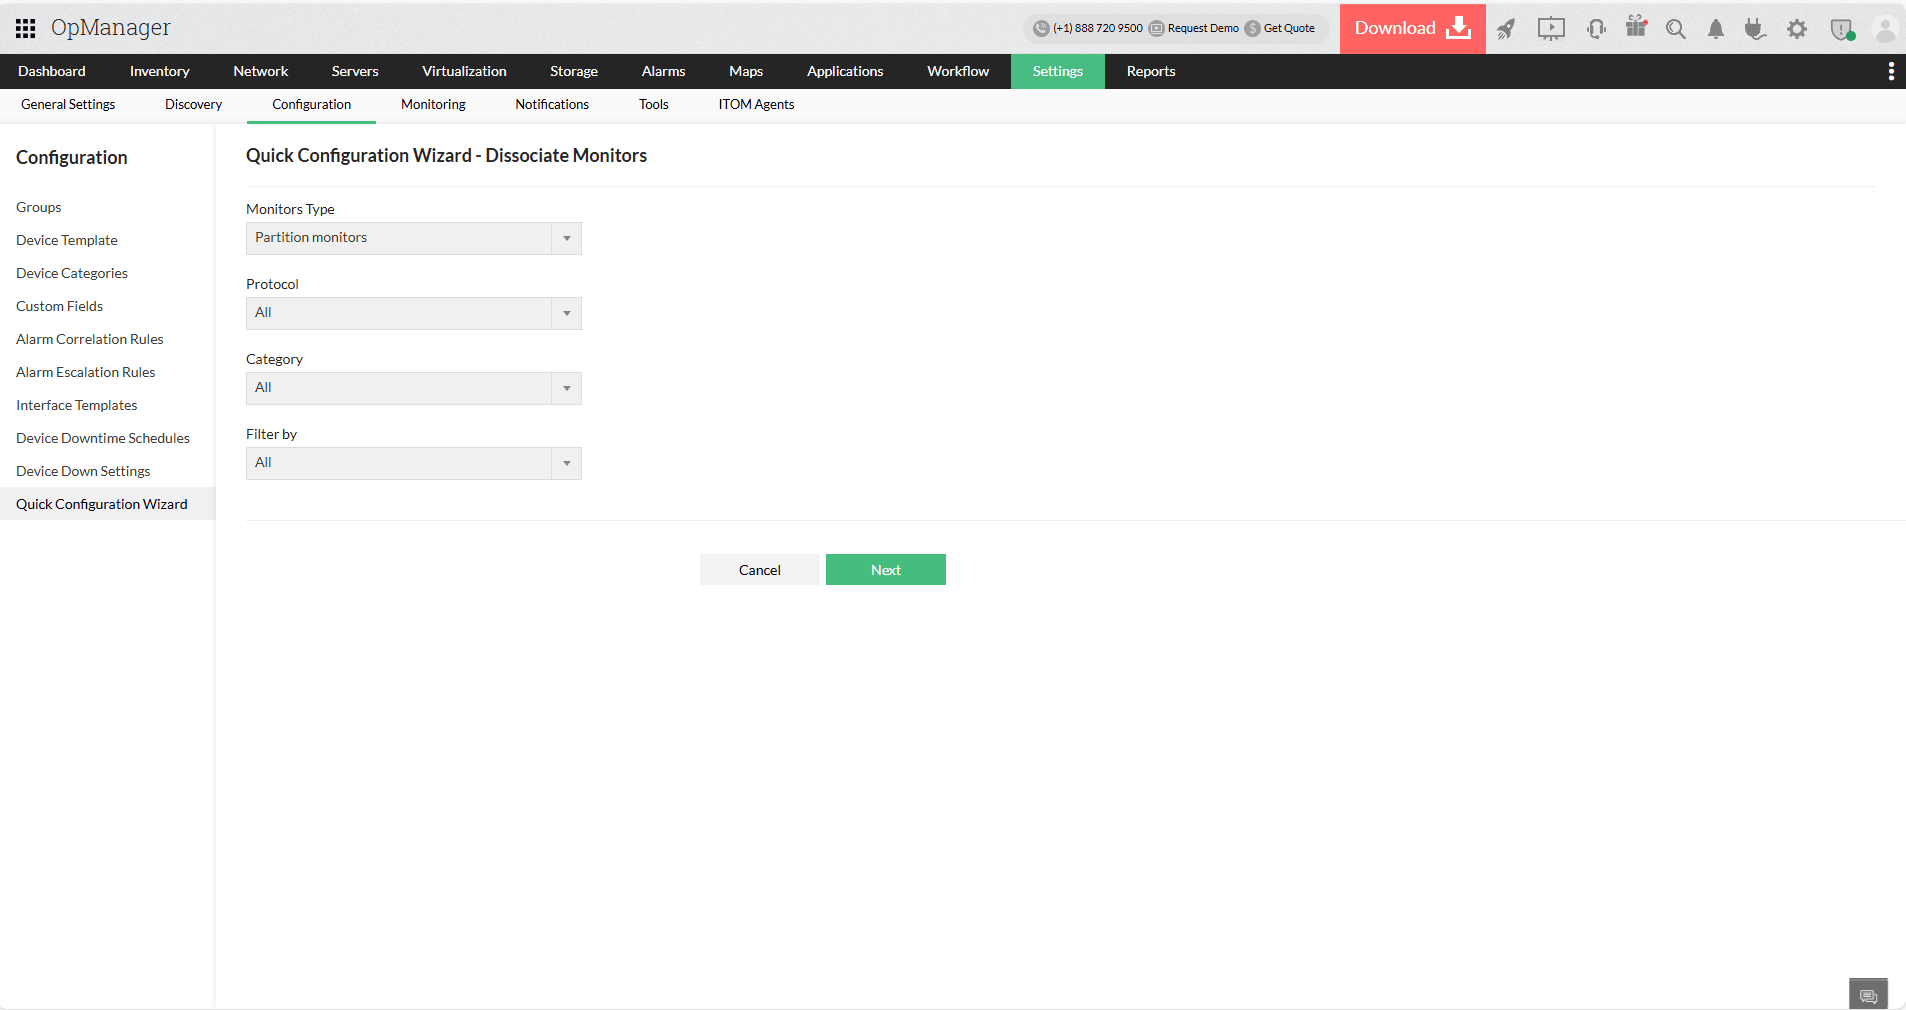
Dissociate Monitors:
Using the Dissociate Monitors option from Quick Configuration Wizard, you can dissociate monitors from bulk devices. This feature allows you to remove specific monitor types from selected devices efficiently.
Steps to Dissociate Monitors:
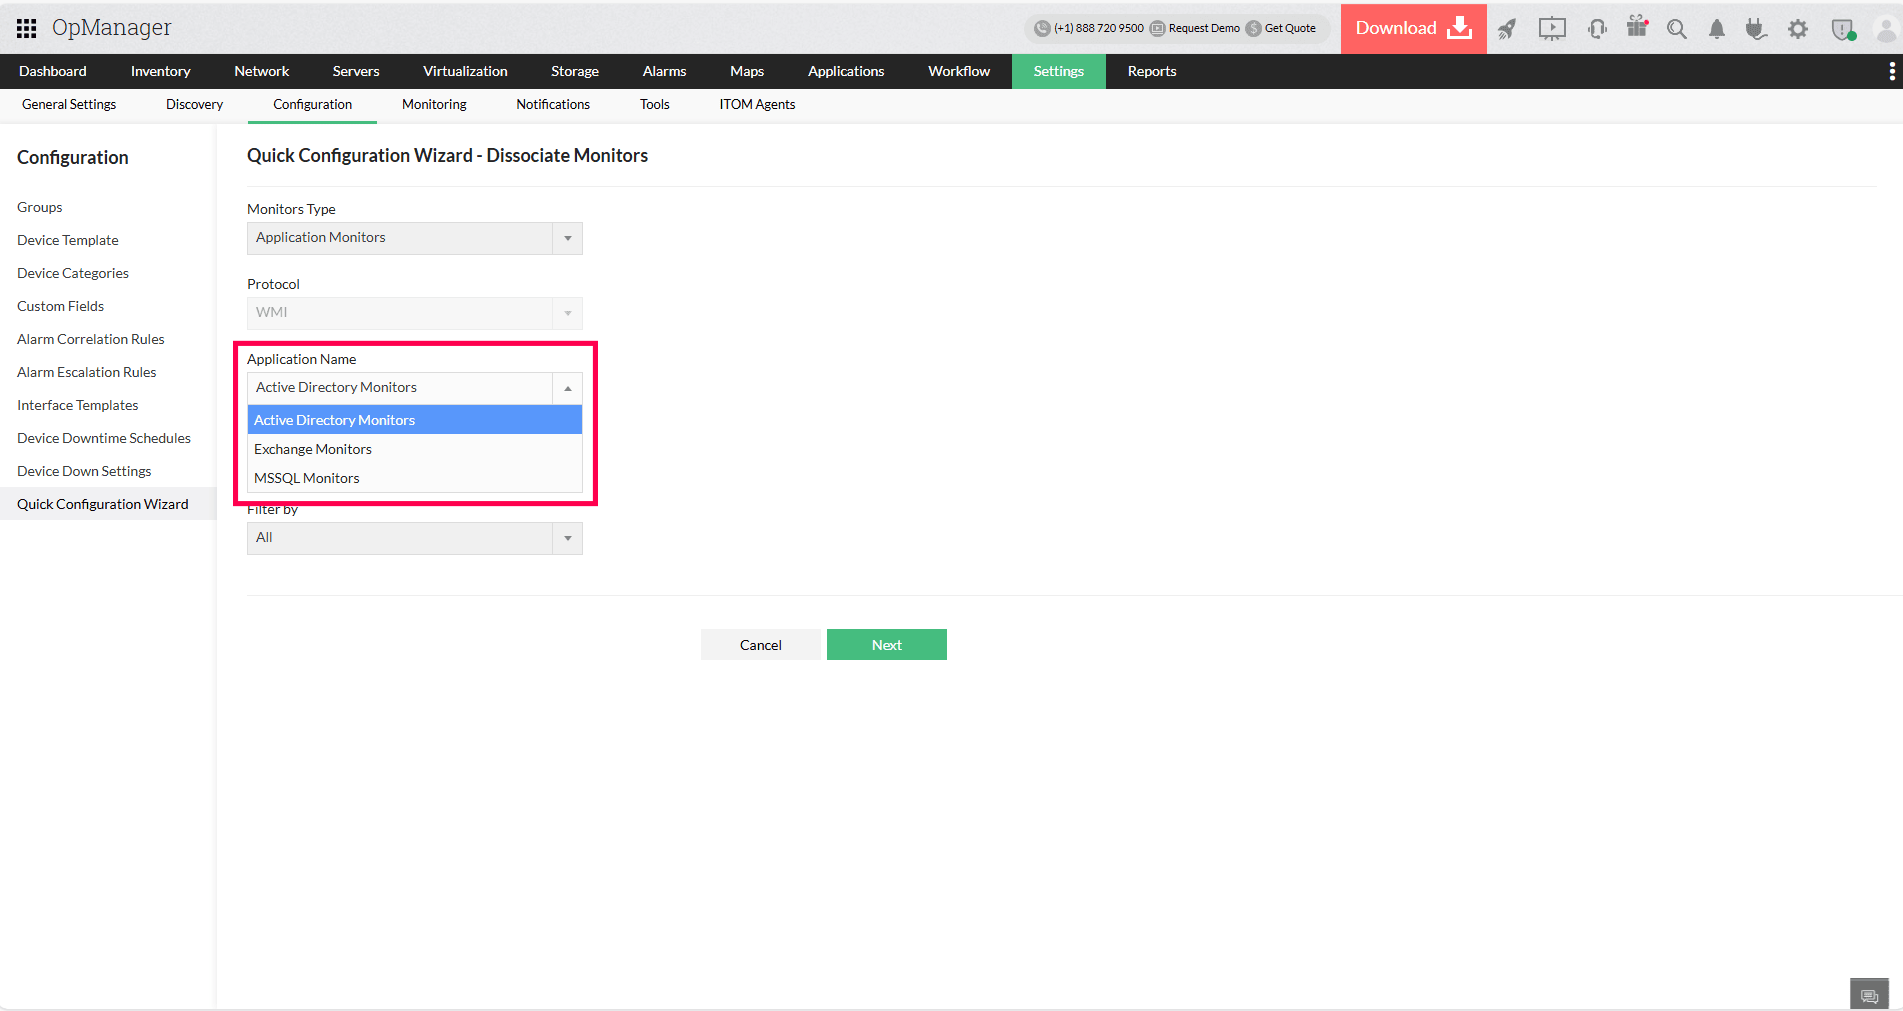
- Select the monitor type. The available monitor types are Partition monitors, Instance monitors, Application monitors.
- When Application monitor type is selected, an additional dropdown will be shown to filter devices based on application name such as Active Directory Monitors, Exchange Monitors, MSSQL Monitors.
- Choose the required Protocol, Category, and Filters based on the type of devices you want to list the monitors, then click Next.
- The monitors associated with the devices will be listed based on applied filters
- Select the monitors you want to dissociate from their associated devices
- Click Dissociate to remove the monitors
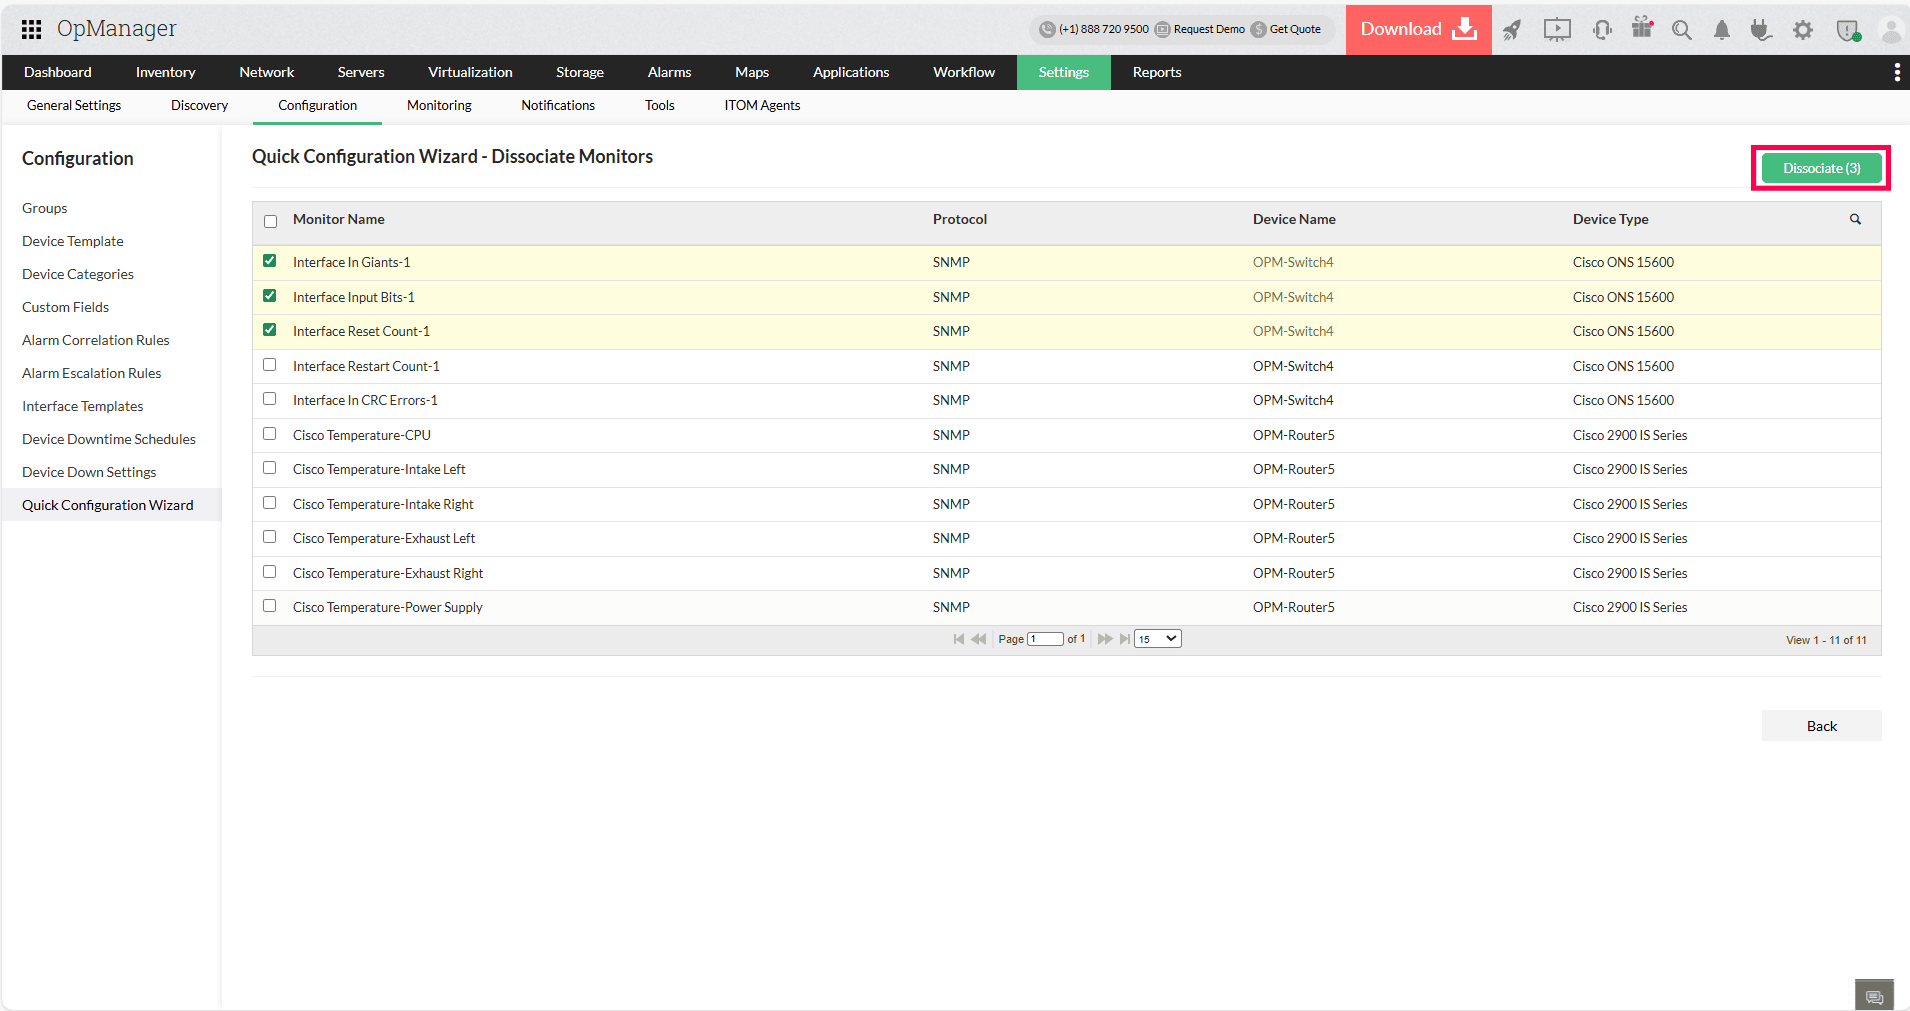
NOTE : The selected monitor(s) will be completely deleted from the device(s) along with their historical performance data.
Understanding Monitor Types
Partition Monitors
Partition monitors track performance metrics related to disk partitions such as used space, free space, and disk utilization. You can configure thresholds for each partition to trigger alerts when usage exceeds defined limits.
Instance Monitors
Instance monitors track multiple instances that fall under a single performance monitor, such as Load Average, custom SNMP monitors, etc., where each instance is added as a separate monitor. This allows you to configure thresholds individually for more granular performance monitoring.
VMware-Datastore Monitors
These monitors collect performance metrics from VMware datastores, including free space, IOPS, and throughput usage. You can configure thresholds for each monitor to proactively detect and prevent potential storage issues in your virtual infrastructure.
Other Performance Monitors
This category includes all performance monitors that don’t fall under the above classifications. These can include monitors for CPU, memory, custom performance metrics, etc. You can configure thresholds for these monitors to receive timely alerts and maintain optimal performance across all monitored devices.
For availability monitors, you can configure thresholds for Response Time and Packet Loss.
Application Monitors
Application monitors in OpManager track the performance of critical business applications such as Active Directory (AD), Microsoft Exchange, and MSSQL. You can configure thresholds for each application's performance monitors to proactively detect and resolve issues before they impact operations.
Hardware Monitors
Hardware monitors track the health and status of physical hardware components such as fans, temperature sensors, voltage sensors, and power supplies using protocols like IPMI, SNMP, and VIWebService. You can configure thresholds for each monitor to receive alerts when hardware components operate outside acceptable ranges.
Response Time
Response time measures the time taken for a network device or server to respond to a request, typically expressed in milliseconds. Monitoring response time helps you understand the speed and responsiveness of your network or applications. You can set thresholds to get alerts if response times exceed acceptable limits, indicating potential performance bottlenecks.
Packet Loss
Packet loss refers to the percentage of data packets that fail to reach their destination during transmission over a network. High packet loss can lead to degraded network performance, affecting applications and user experience. Configuring thresholds for packet loss helps detect network issues early so you can take corrective action before they impact operations.