WAN RTT Monitor Reports
The WAN RTT Monitors Report provides a detailed analysis of round-trip time (RTT), threshold violations, and availability statistics for network paths. This report helps administrators assess the efficiency of WAN connections, detect latency issues, and identify paths experiencing availability problems.
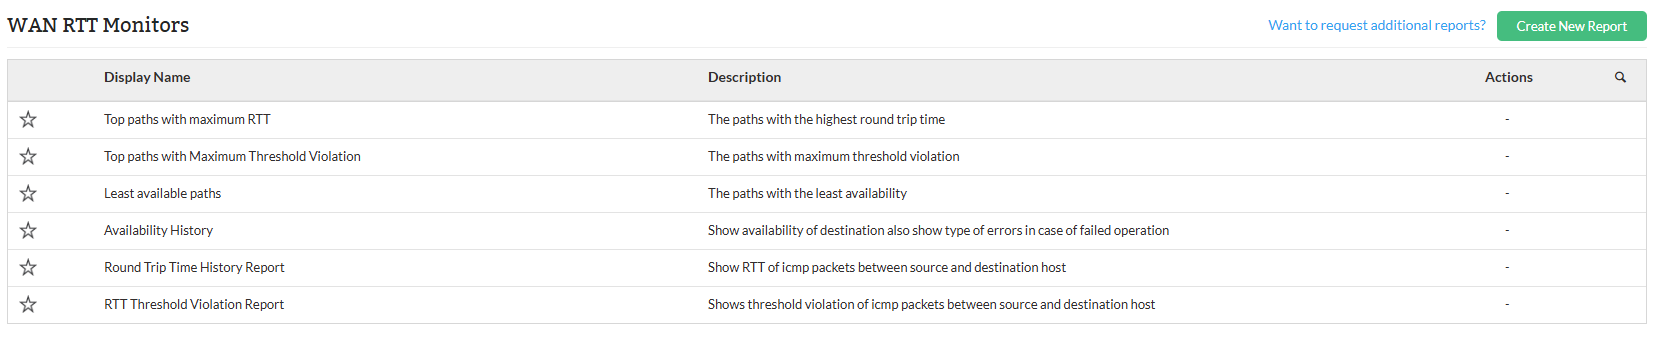
To access WAN RTT Monitor Reports, click Reports → WAN RTT Monitor Reports from the main menu bar.
WAN RTT Report types
| Report Name | Description | Available Columns | Available Filters |
|---|---|---|---|
| Top Paths with Maximum RTT | This report highlights network paths experiencing the highest round-trip time (RTT), helping to identify latency issues between source and destination points. Monitoring RTT is essential for assessing network responsiveness and diagnosing performance bottlenecks in communication paths. The report includes minimum, maximum, and average RTT values measured over time. | Source, Destination, Min. RTT, Max. RTT, Avg. RTT | Period |
| Top Paths with Maximum Threshold Violation | This report identifies network paths where the round-trip time (RTT) has exceeded predefined SLA (Service Level Agreement) thresholds most frequently. It helps in detecting unreliable or degraded network segments that may affect application performance or user experience. The report provides details on the source and destination, along with the SLA threshold and actual RTT value. | Source, Destination, SLA, RTT | Period |
| Least Available Paths | This report highlights network paths with the lowest availability, helping to identify links that may be prone to frequent outages or instability. It is useful for ensuring network reliability and prioritizing maintenance or upgrades on underperforming connections. The report includes the source, destination, and measured availability percentage. | Source, Destination, Availability | Period |
| Availability History | This report provides a time-based log of network path availability between source and destination. It helps in tracking consistent uptime and detecting any anomalies or failure patterns over specific intervals. Additional metrics such as packet drops, timeouts, data corruption, and connection errors are also recorded to give a comprehensive view of network health. | Date and Time, Source, Destination, Available, Data Corrupted, Timeout, Pack. Drop, Sequence Error, System Busy, Connection Error | Period |
| Round Trip Time History Report | This report logs round-trip time (RTT) statistics between network endpoints over specified time intervals. It is useful for monitoring latency trends and diagnosing performance fluctuations across network paths. By tracking RTT values historically, network administrators can identify periods of degraded responsiveness and investigate potential causes. | Date and Time, Source, Destination, Min. RTT, Max. RTT, Avg. RTT | Period |
| RTT Threshold Violation Report | This report monitors the success rate of round-trip time checks against defined service-level agreement (SLA) thresholds. It helps identify SLA violations and failed attempts, enabling timely response to network performance issues. Consistent success and zero violations indicate stable latency performance. | Date and Time, Source, Destination, Success, SLA Violation, Failed | Period |
To know more about the Available Filters in various reports of OpManager, Click here.
These WAN RTT reports provide visibility into a wide range of performance and availability metrics, such as:
- RTT (Round-Trip Time): Minimum, maximum, and average RTT values that indicate network latency.
- Availability: Path availability percentages, highlighting network uptime and reliability.
- Errors: Types of errors like timeouts, data corruption, packet drops, sequence errors, system busy states, and connection failures.
By reviewing these metrics, users can effectively monitor network performance, identify potential issues, and ensure that SLAs are met. They can also export reports to PDF or Excel, schedule them for automated generation within defined business hours or time windows. Click here to know more about other report types in OpManager.