Configuring Color Severity Bars for Widgets in OpManager
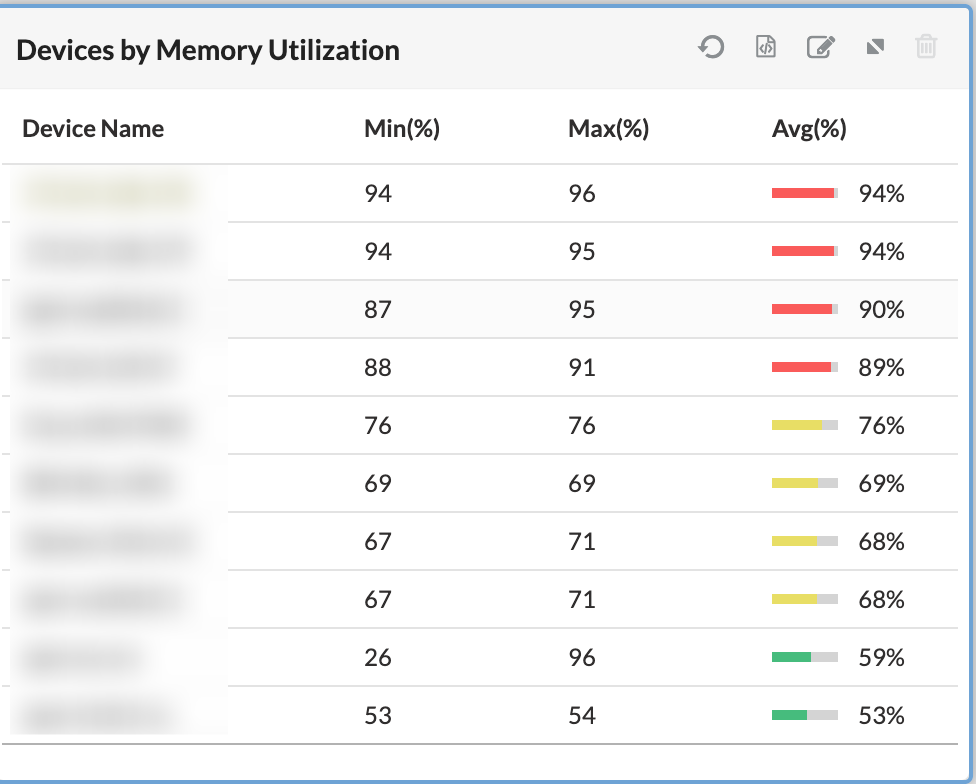
OpManager provides flexibility in visualizing performance metrics by allowing customizable color severity bars for widgets. This enables quick identification of device and monitor health statuses based on threshold settings. Devices and monitors often operate under different performance baselines, reflecting unique operational behaviors. To accommodate these variations, OpManager supports configurable color indicators for each widget. OpManager has now introduced color-coded severity bars that visually represent metric status against defined thresholds. Once thresholds are configured, these intuitive color indicators provide an at-a-glance view of performance health, making it easier than ever to monitor system status and identify issues quickly. These thresholds include:
- Green: Normal
- Orange: Warning
- Red: Critical
This enables users to easily identify performance issues without the need to analyze raw data values.
Widget threshold in OpManager includes the following indicators :
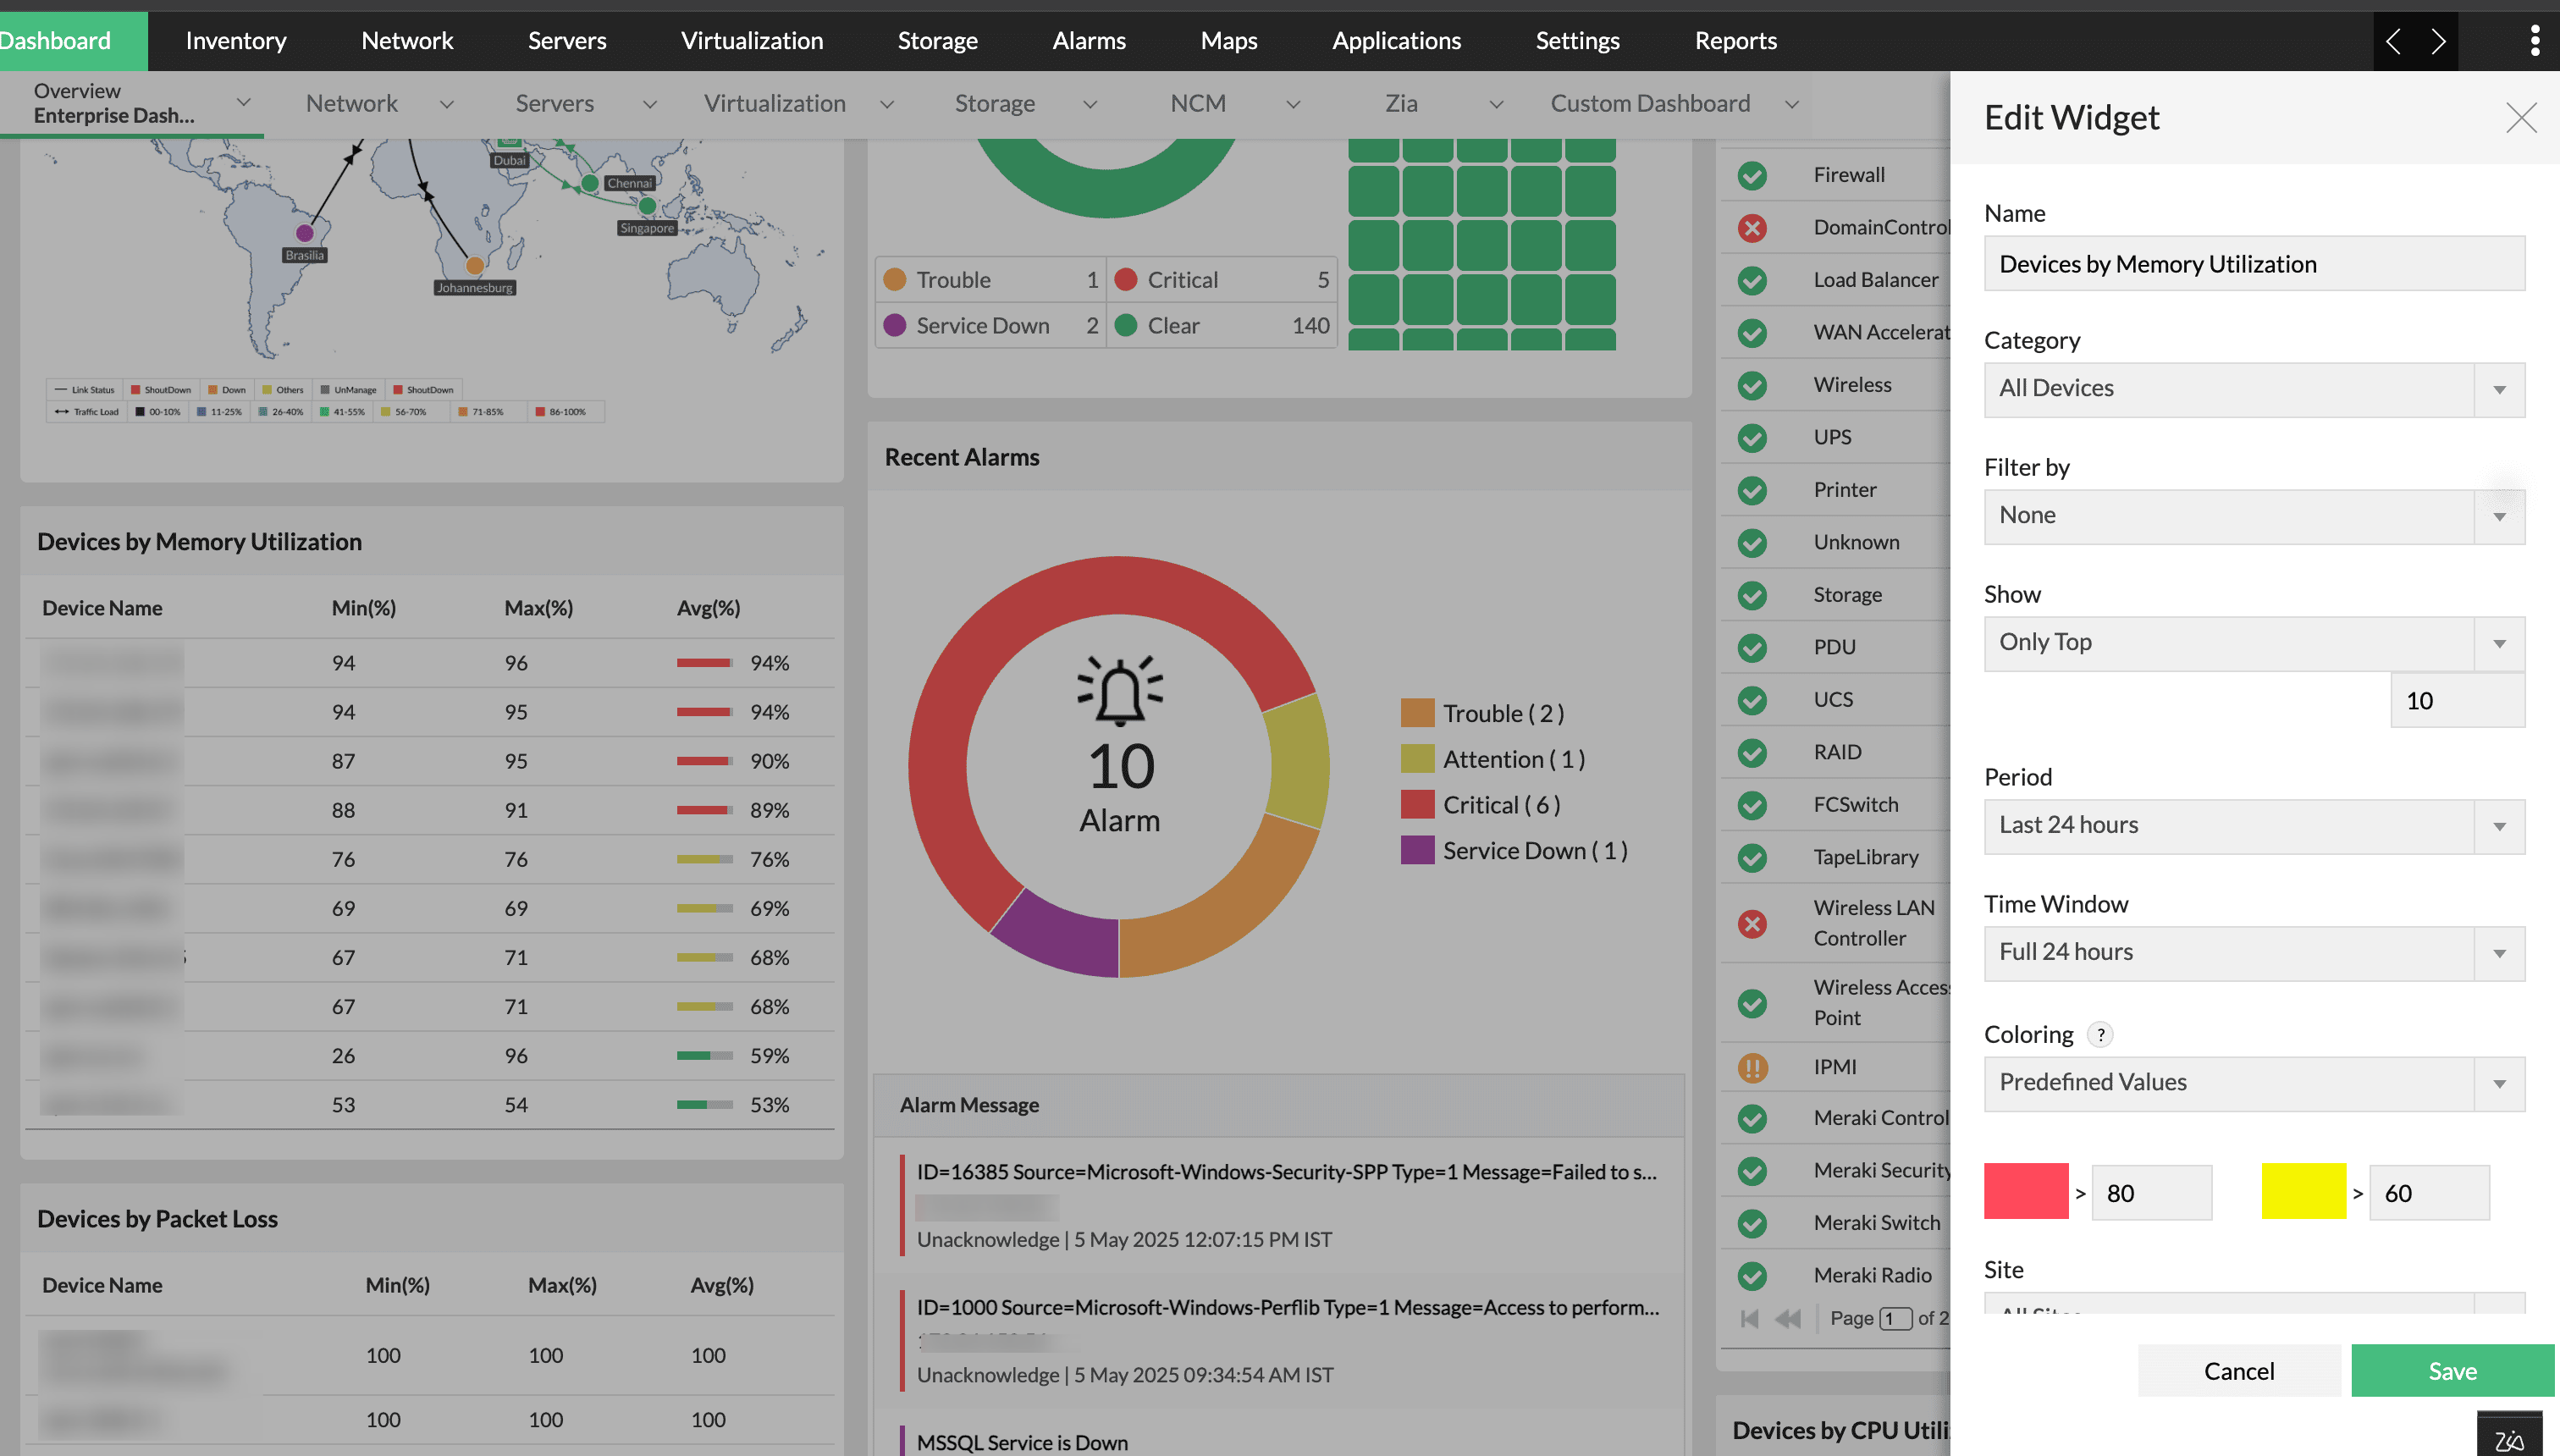
Coloring Indicators
OpManager supports three coloring behaviors in widgets, based on configuration:
Case 1: Predefined Values
OpManager applies predefined threshold values for coloring logic by default. The values include:
- Red: Value > 80
- Orange: Value between 60 and 80 (modifiable)
- Green: Value ≤ 60
These predefined values can be modified and configured based on requirements. This ensures widgets provide visual cues even without manual threshold setup.
Case 2: Configured Thresholds
When a user has defined specific thresholds for a monitor, the widget will use those values to determine color severity:
- Thresholds for Attention, Trouble, and Critical states are used to define the appropriate color.
- If thresholds are not configured, then coloring will be shown as green.
- For Adaptive Thresholds configured monitors, the coloring will be shown as green.
Case 3: No Coloring
If the coloring feature is explicitly disabled for a widget:
- The widget will only display numeric values.
- No color bar or severity indication will appear.
Best Practices
- Always review and configure thresholds relevant to your infrastructure’s baseline behavior.
- Use coloring for widgets that monitor critical metrics to enable faster visual diagnosis.
- For simpler dashboards or reporting needs, consider disabling color bars to reduce visual clutter.