
Network performance management is not solely dependent on network devices and servers, and is highly reliant on network traffic congestion. NetFlow Analyzer add-on, ManageEngine’s bandwidth monitoring and network traffic analysis solution, simplifies network management by saving network admins the trouble of juggling multiple tools to manage network traffic health. It is a flow-based add-on that supports a wide range of flow formats and devices. The NetFlow Analyzer add-on monitors your network to provide in-depth visibility into your network devices, interfaces, applications, users, bandwidth usage, and network traffic, making bandwidth management easier and more efficient.
Enable add-onThe seamless addition of NetFlow Analyzer add-on to ManageEngine OpManager makes network monitoring easier by centralizing a comprehensive view of your network’s bandwidth utilization, network traffic trends, and your entire wireless network into a single console.
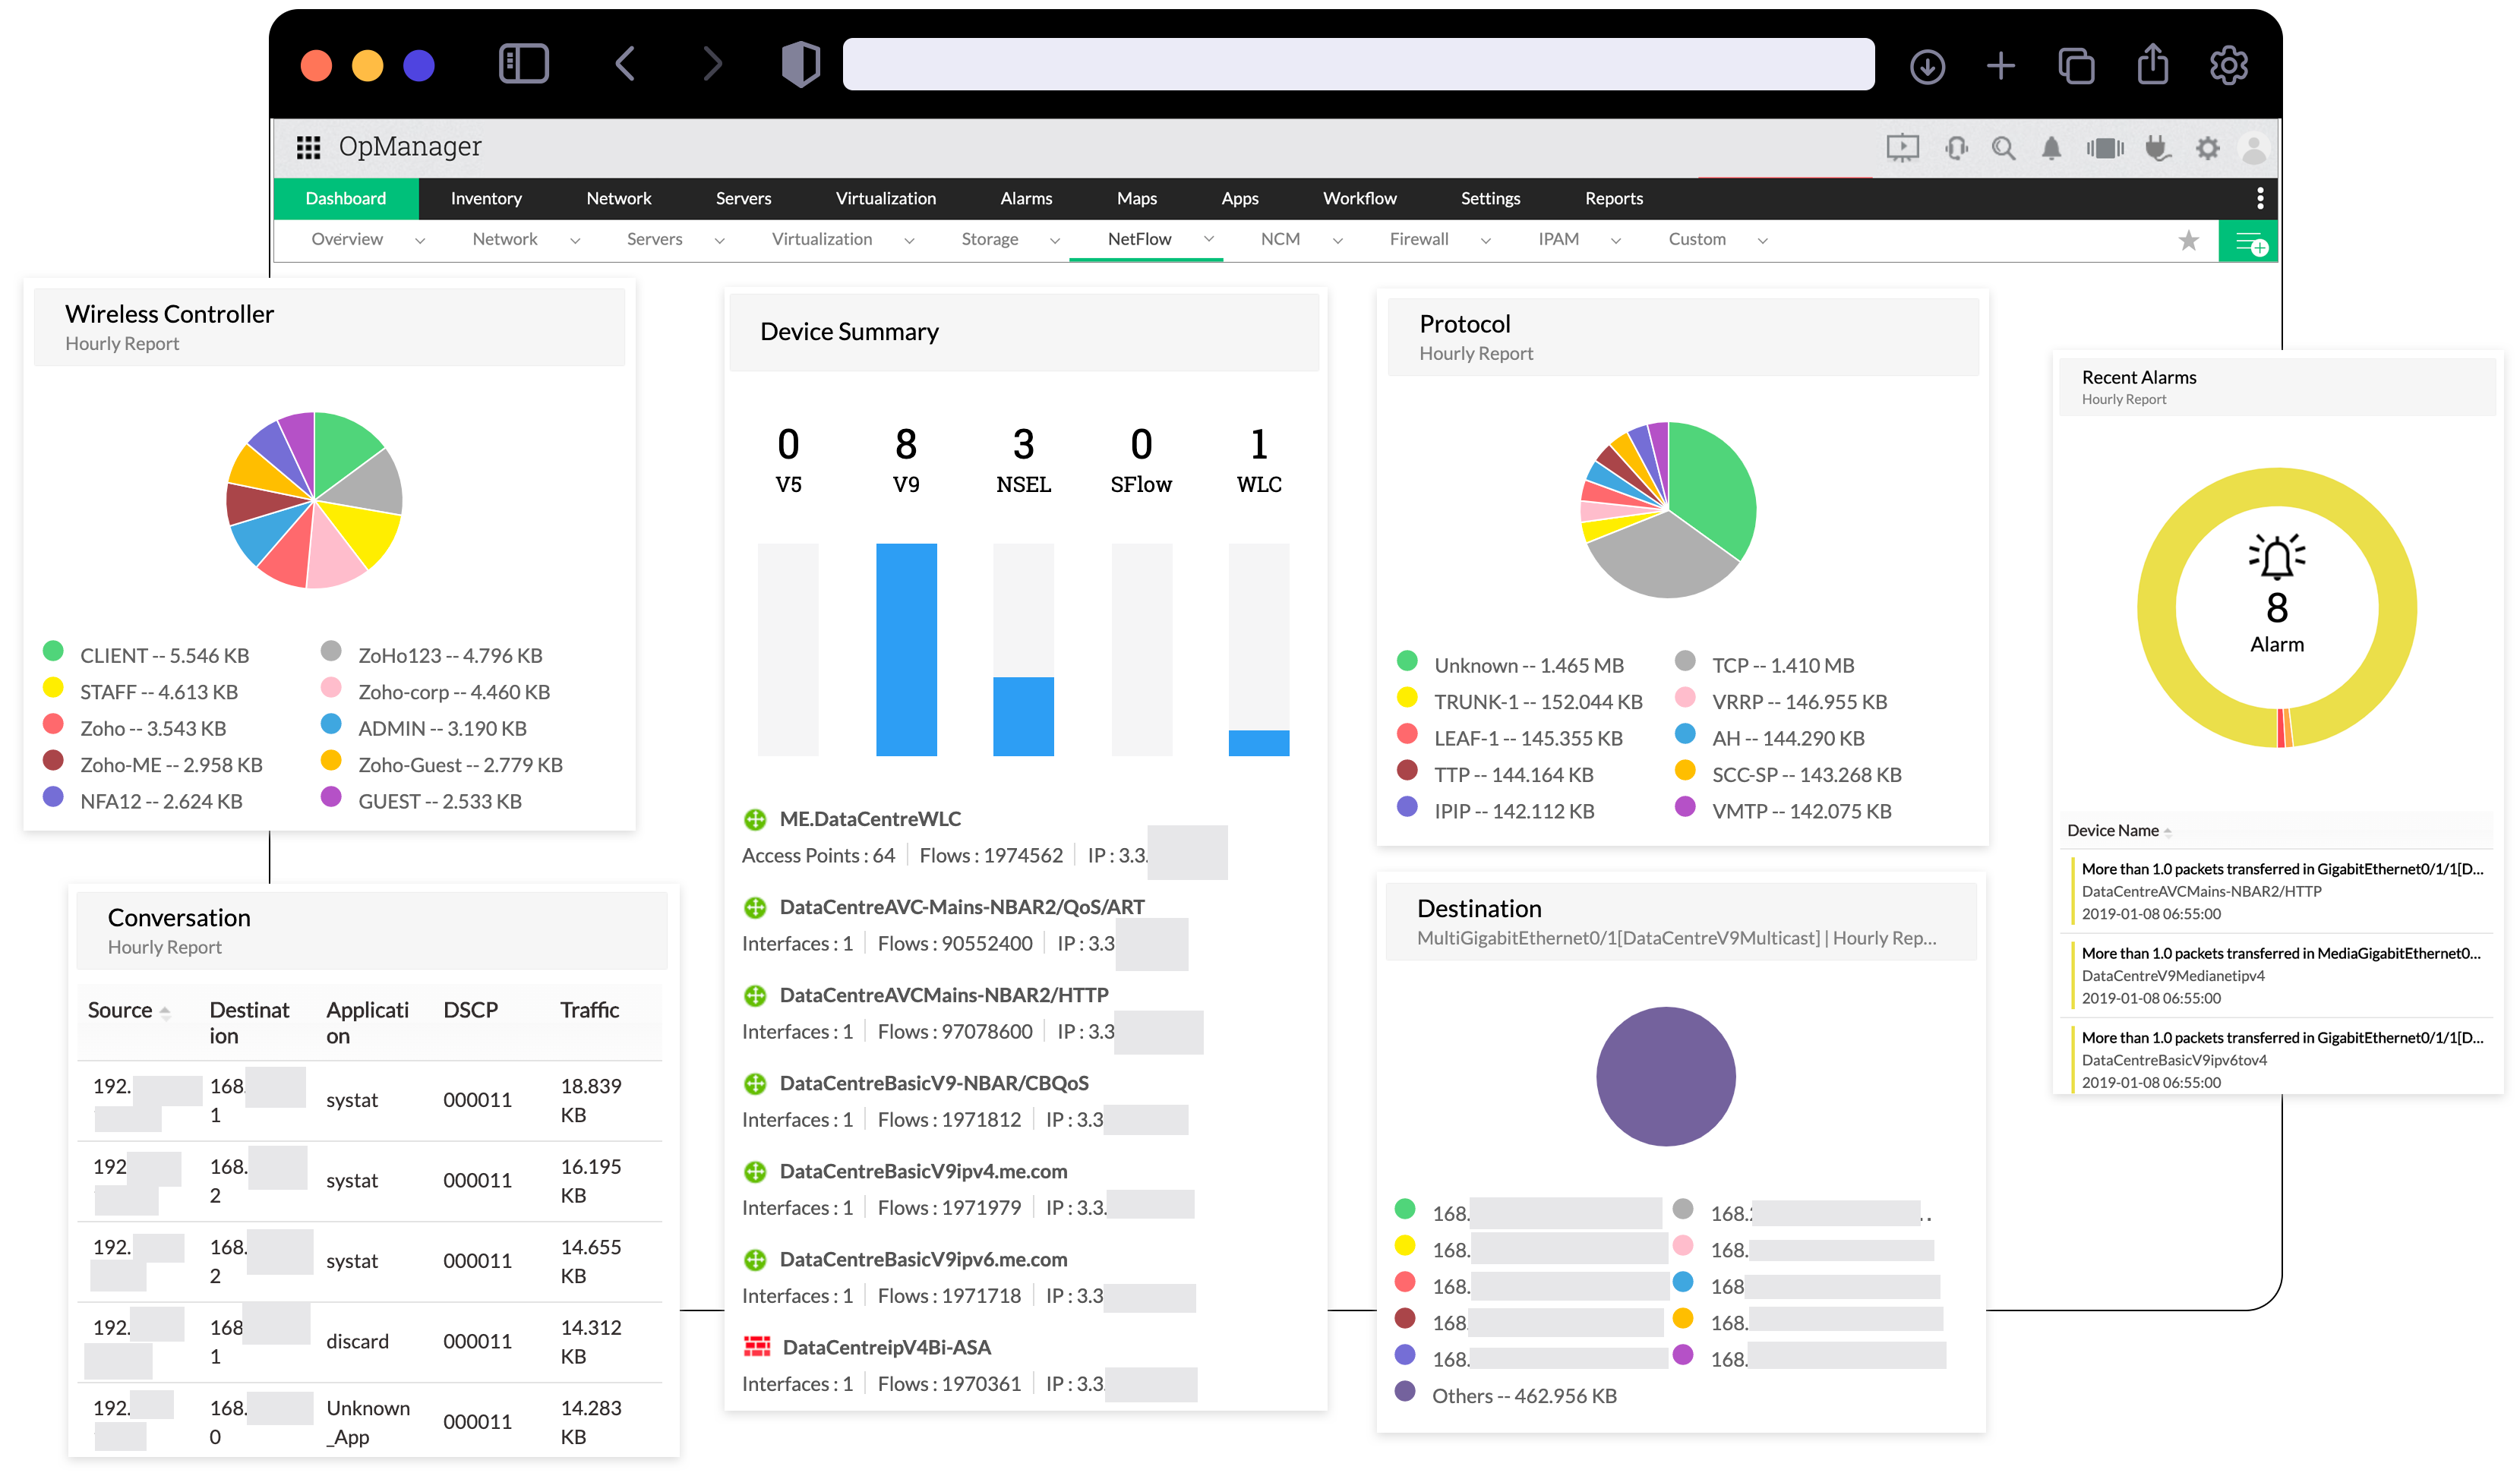
Monitor network traffic and bandwidth usage by application, protocol, IP address groups, and more with multi-vendor support. Create custom dashboards with traffic charts, bandwidth trend reports, heat maps, and top lists.
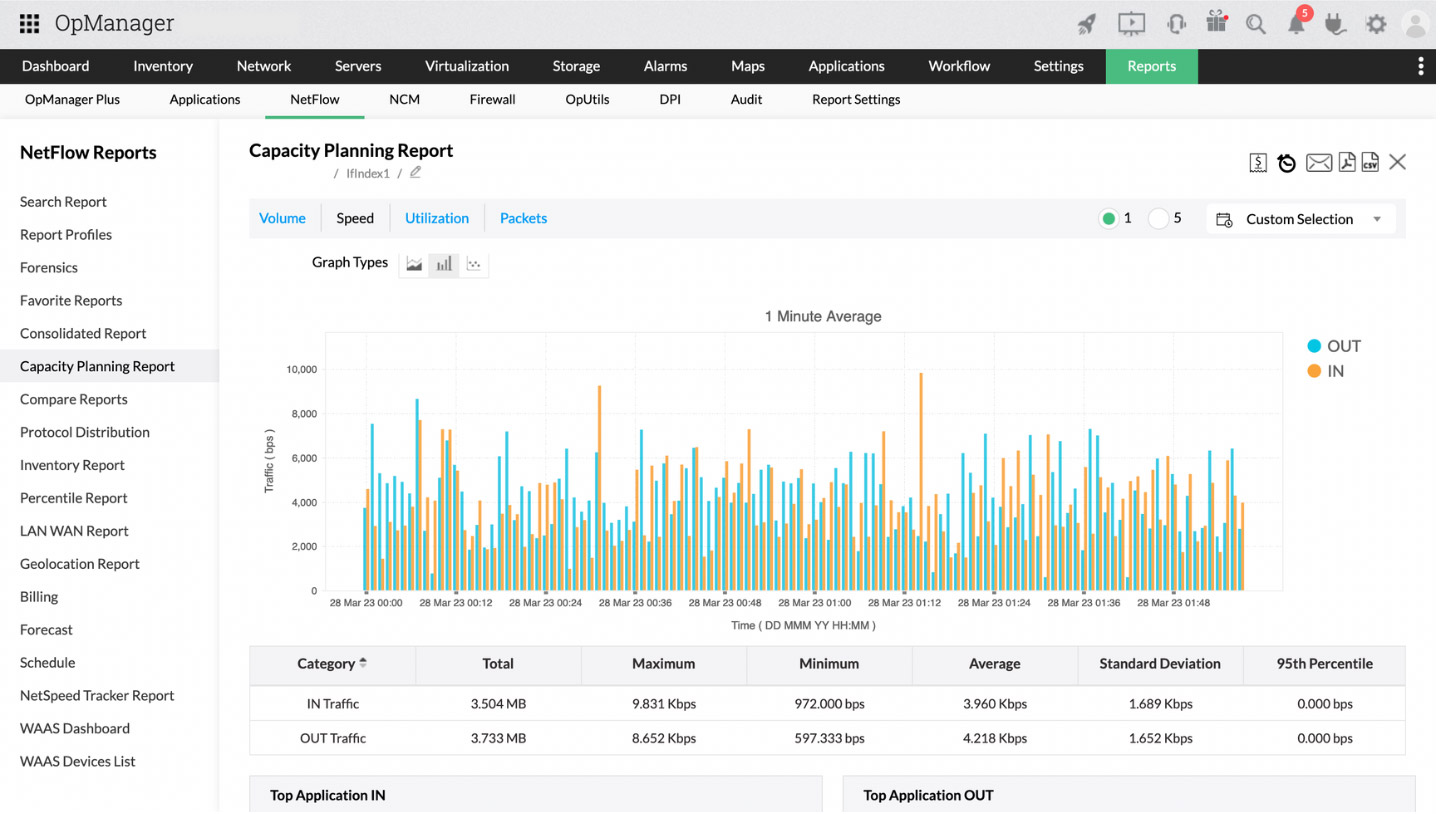
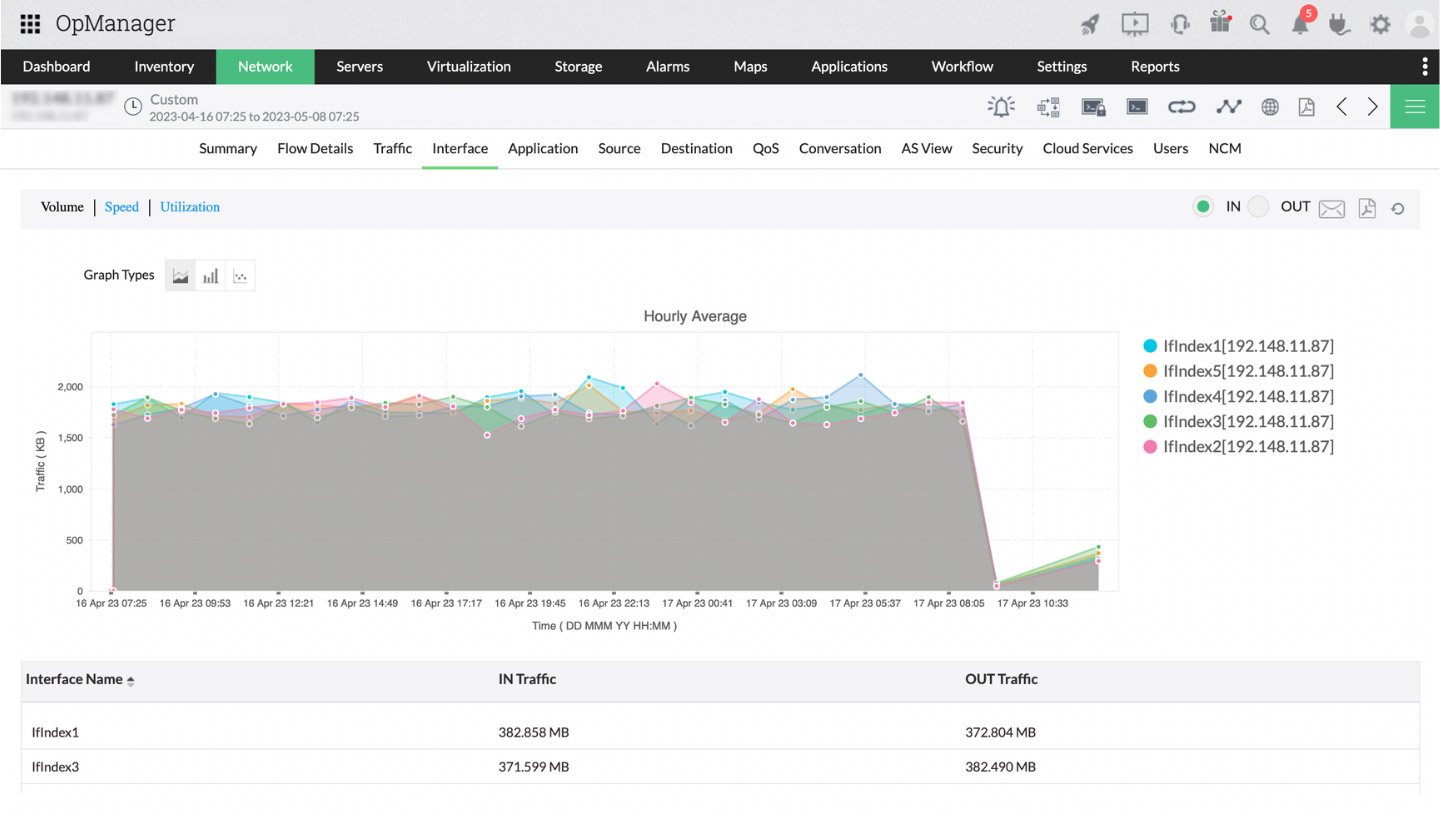
Utilize NetFlow Analyzer’s advanced reports and graphs to detect every activity, device, interface, and application among other network elements in your network. Forecast bandwidth utilization trends, and plan bandwidth capacity trends and IT requirements to avoid being caught off guard.
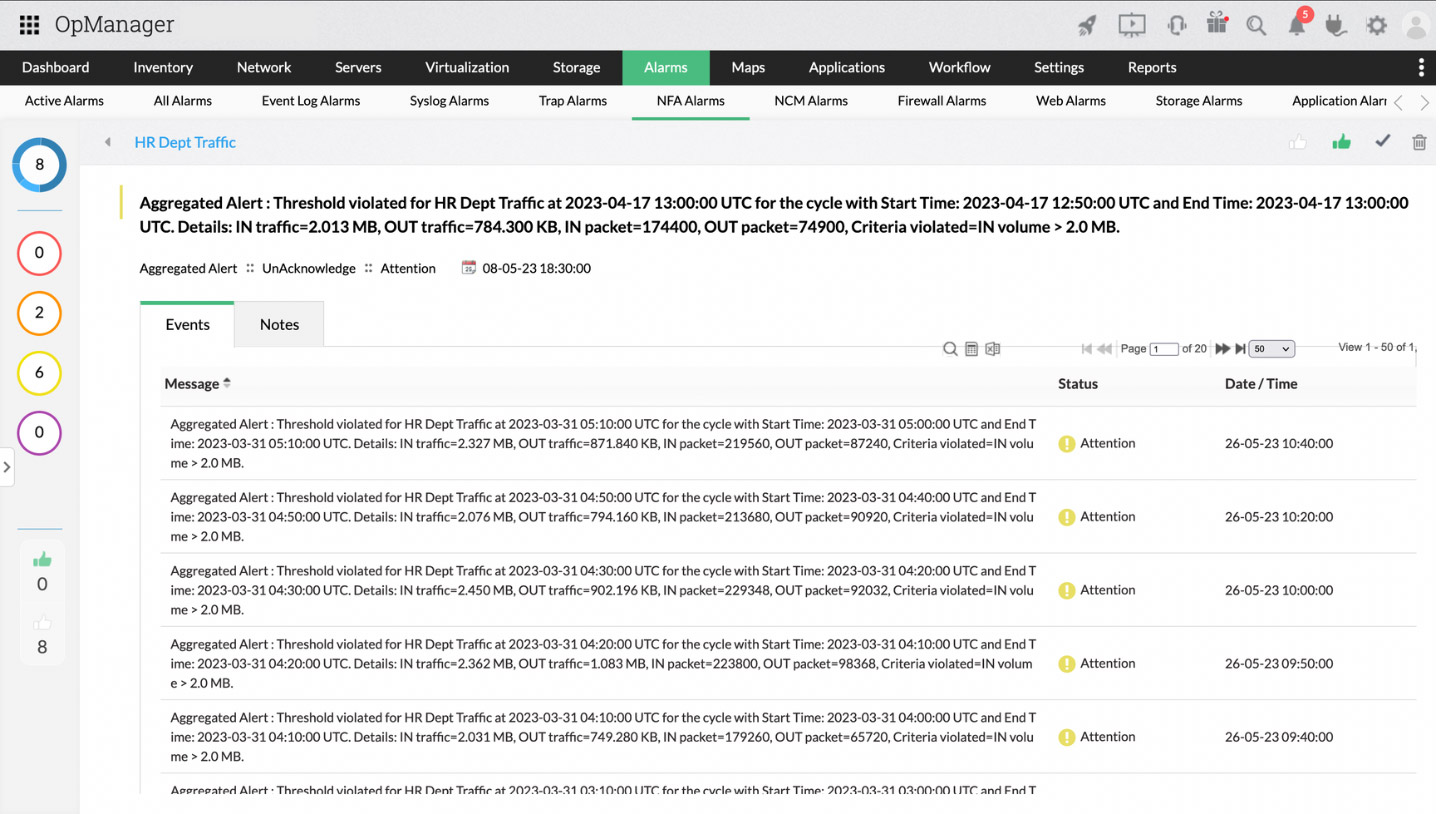
Set alerts with multicriteria-based thresholds to detect traffic anomalies and usage violations to avoid alarm floods. Receive alerts via chat, SMS, email, alarms, traps, and tickets so you're enabled to provide prompt resolutions.
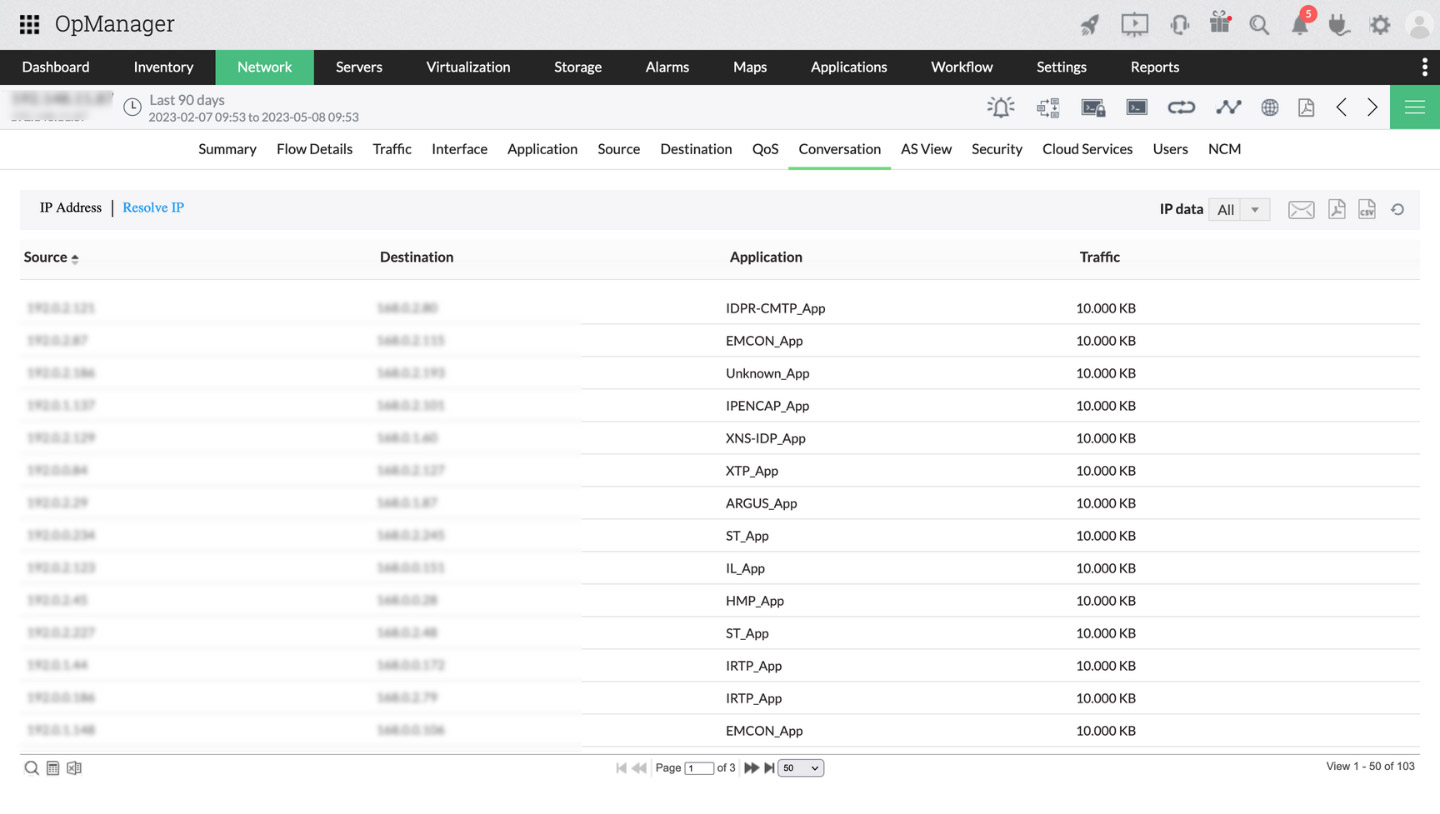
Identify bottlenecks, manage and track top talkers, conversations, and IPs. Monitor your entire wireless network including controllers, SSIDs, access points, and QoS and gain an overview of your distributed network from a single, centralized console to ensure you're always aware of network traffic activities.
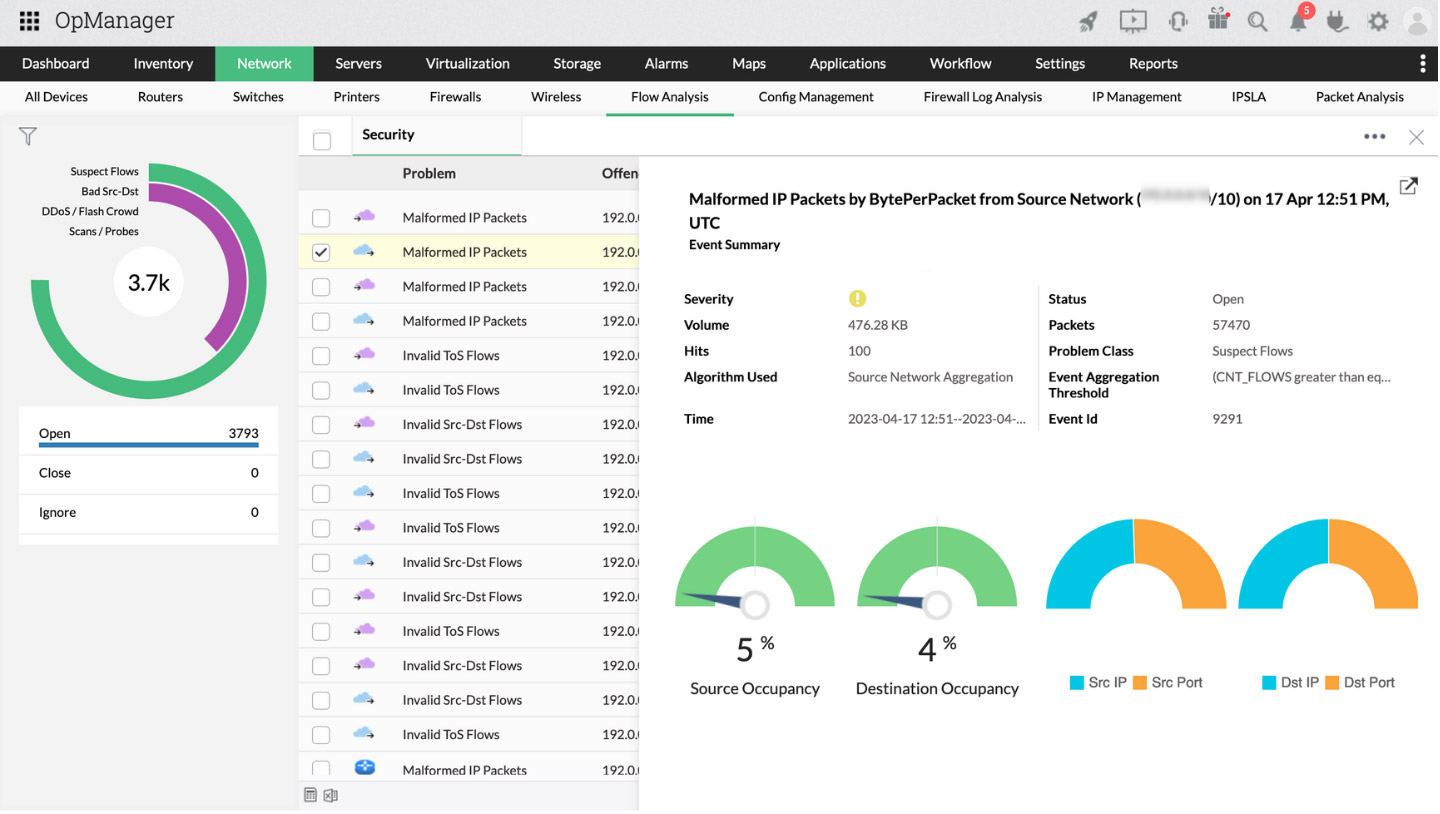
Monitor and analyze bandwidth usage trends and behavioral patterns to proactively detect anomalies in network traffic, and navigate the cause of bottlenecks, generate real-time forensic analytics on interfaces, apps, and conversations with intuitive reports that quantify who is using your network, how much, and why.
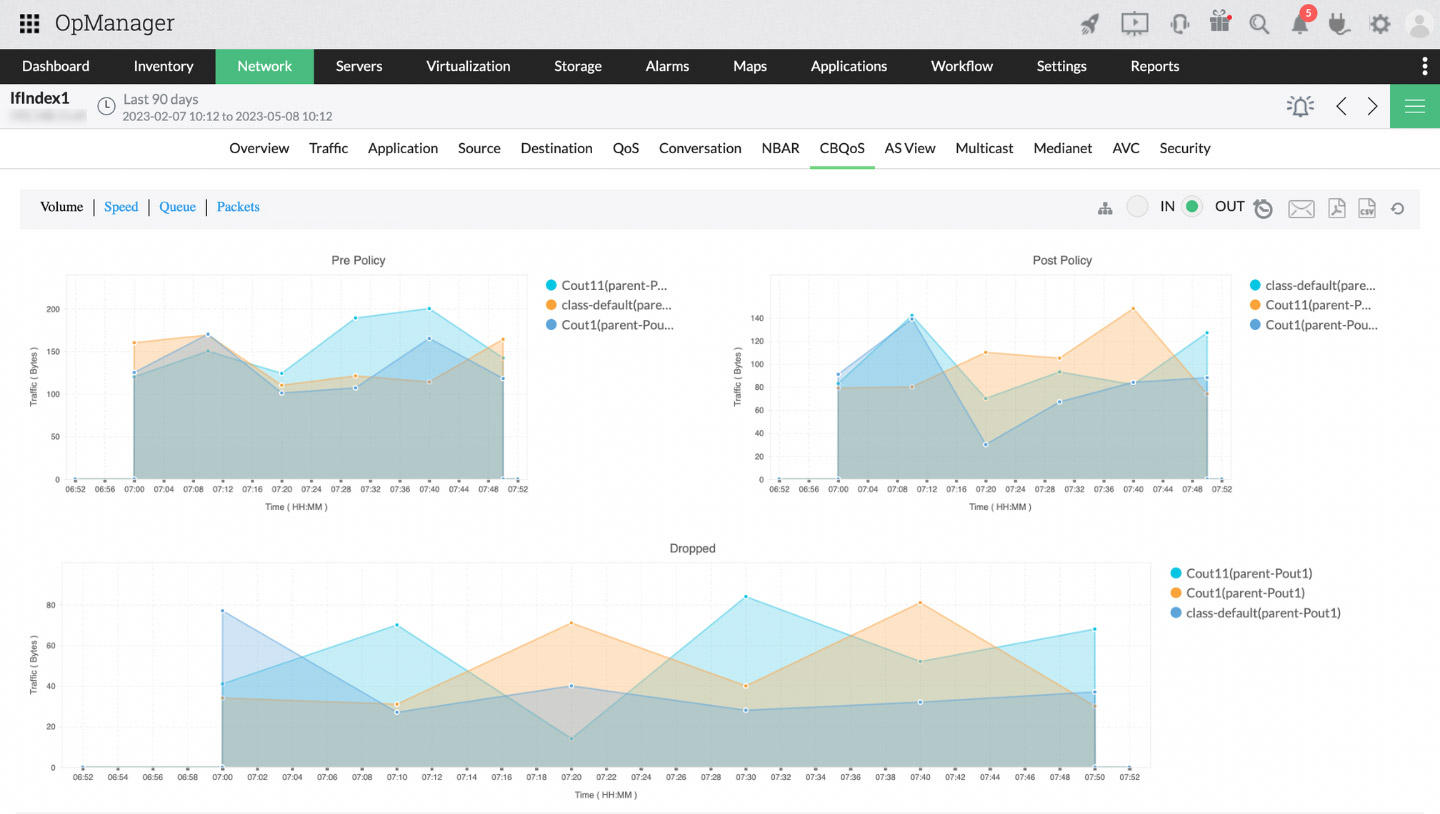
Build, audit, and optimize QoS policies to ensure smooth access and functioning of media traffic and mission critical applications. Track application traffic and usage, and receive detailed statistics about applications running in your network. Map custom applications and set policies to shape app traffic, and deny or limit access to bandwidth hogs.
The network traffic monitoring add-on can be enabled via two options:
a) The free, 30-day trial of the add-on
b) The full license activation of the add-on
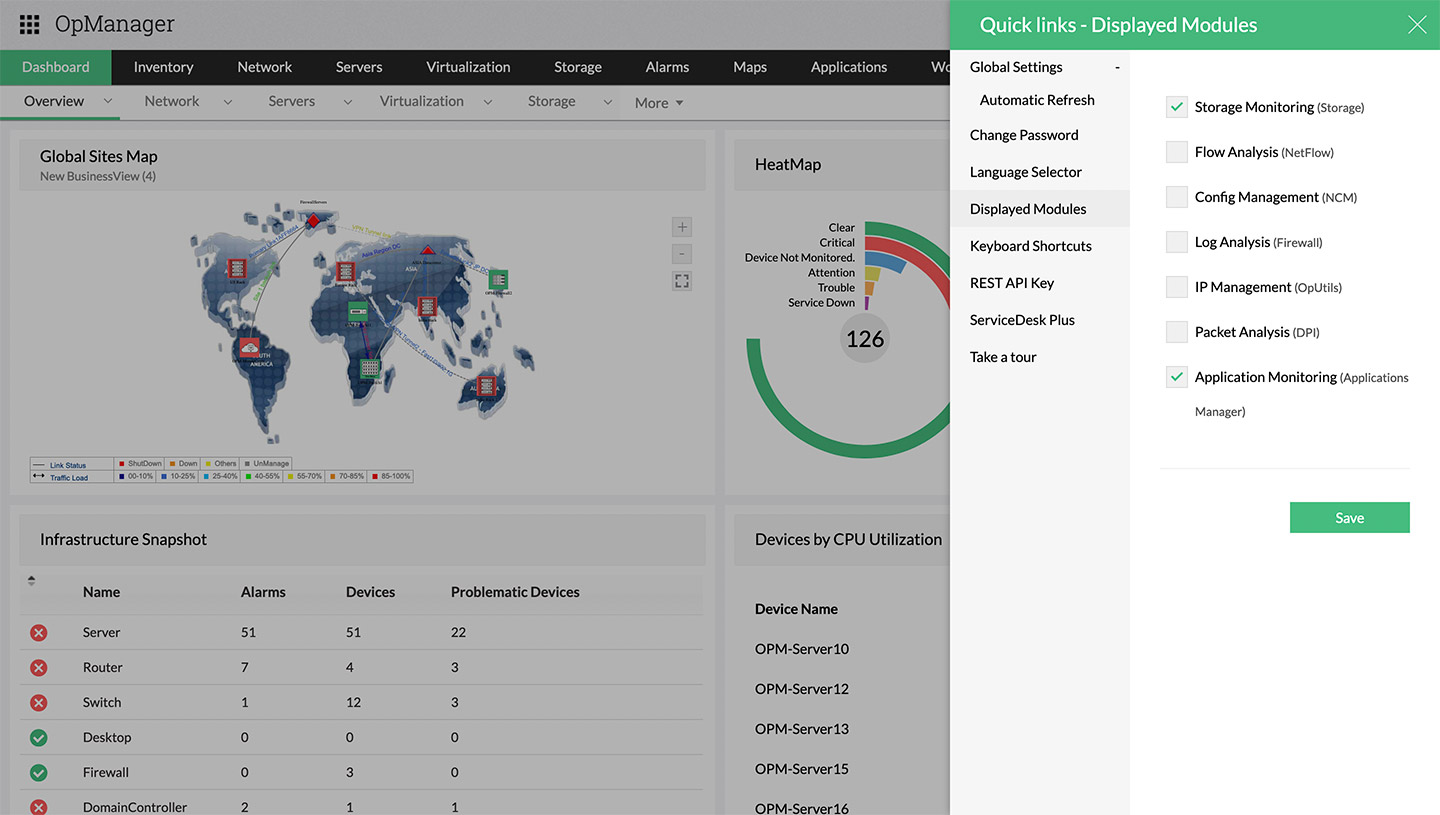
To enable the free, 30-day trial of the add-on, go to Settings > Display Modules. Select Flow Analysis and click Save.
Another method is to click any of the network devices and select the NetFlow tab. There you will find sample data along with a message to enable the add-on as a free, 30-day trial.
You have the option to choose the number of device packs for the NetFlow Analyzer add-on and acquire them, which will activate the add-on right away.
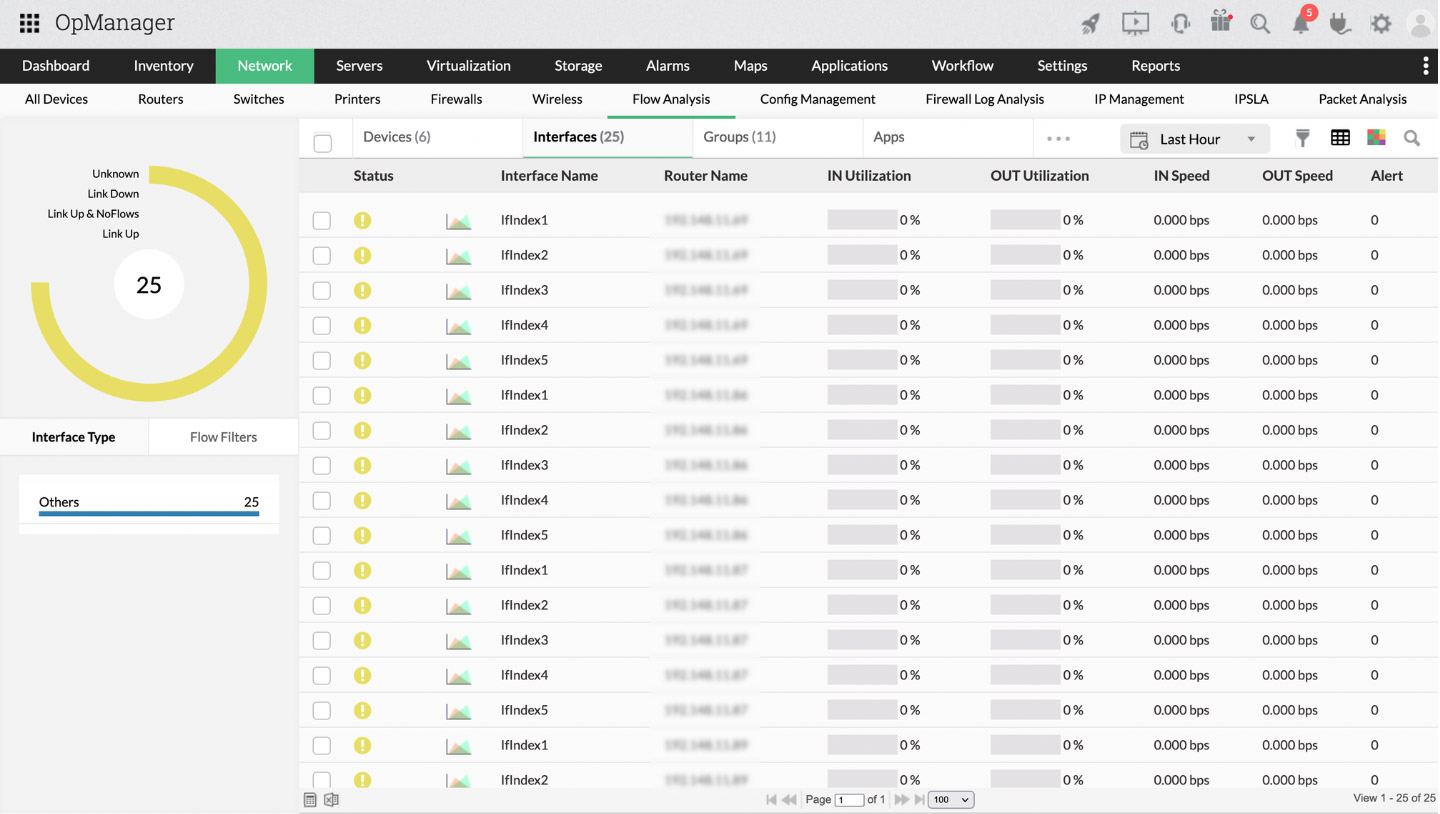
After enabling the add-on, access backups, firmware management, compliance, and other features by going to Network > Flow Analysis.
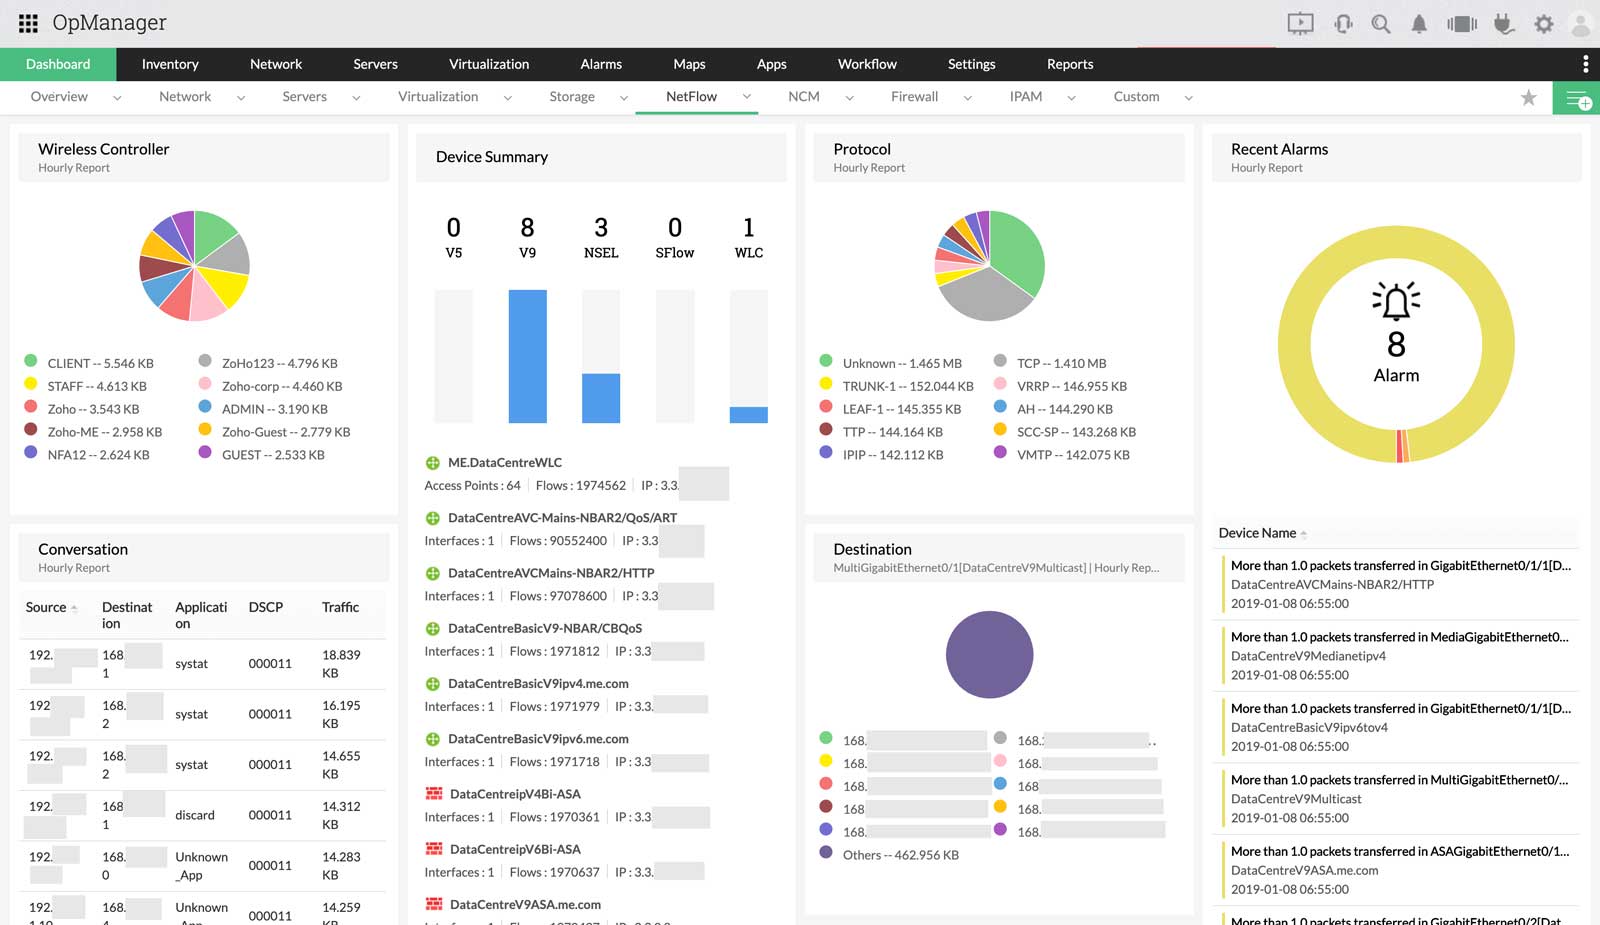
To view the dashboard of the NetFlow add-on, go to Dashboard > NetFlow.
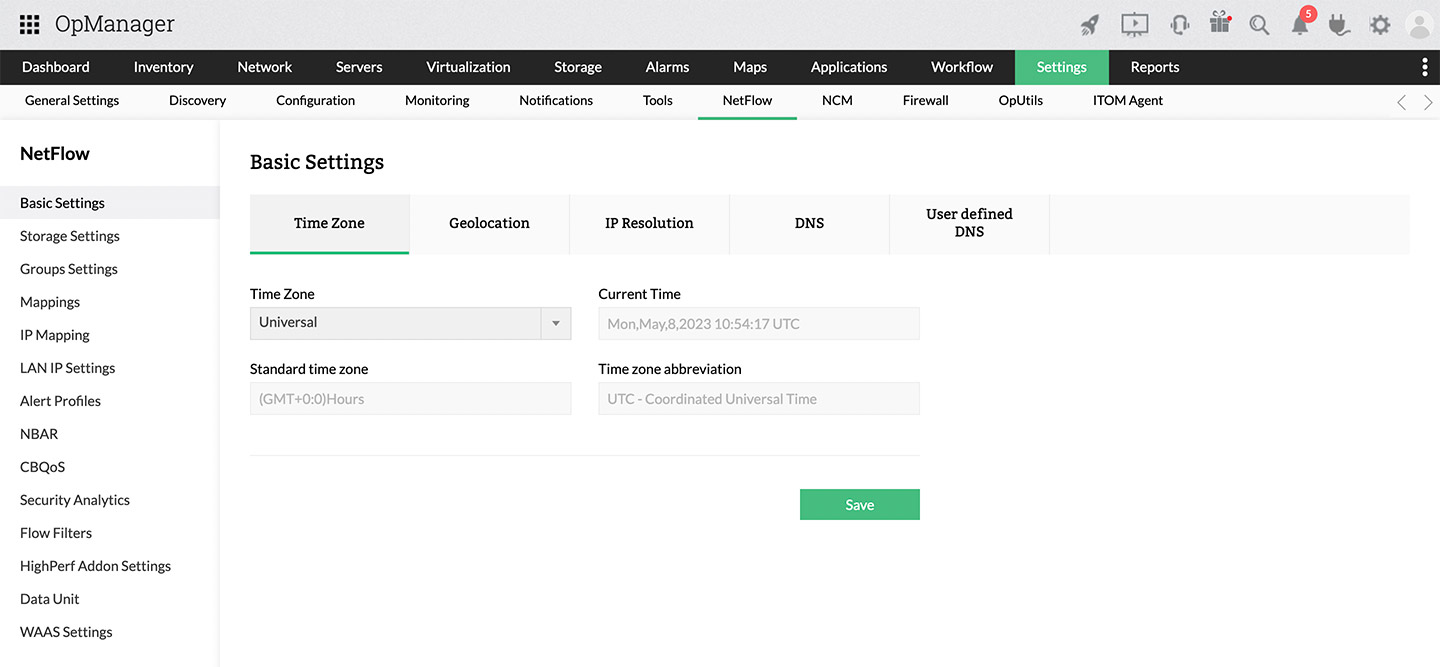
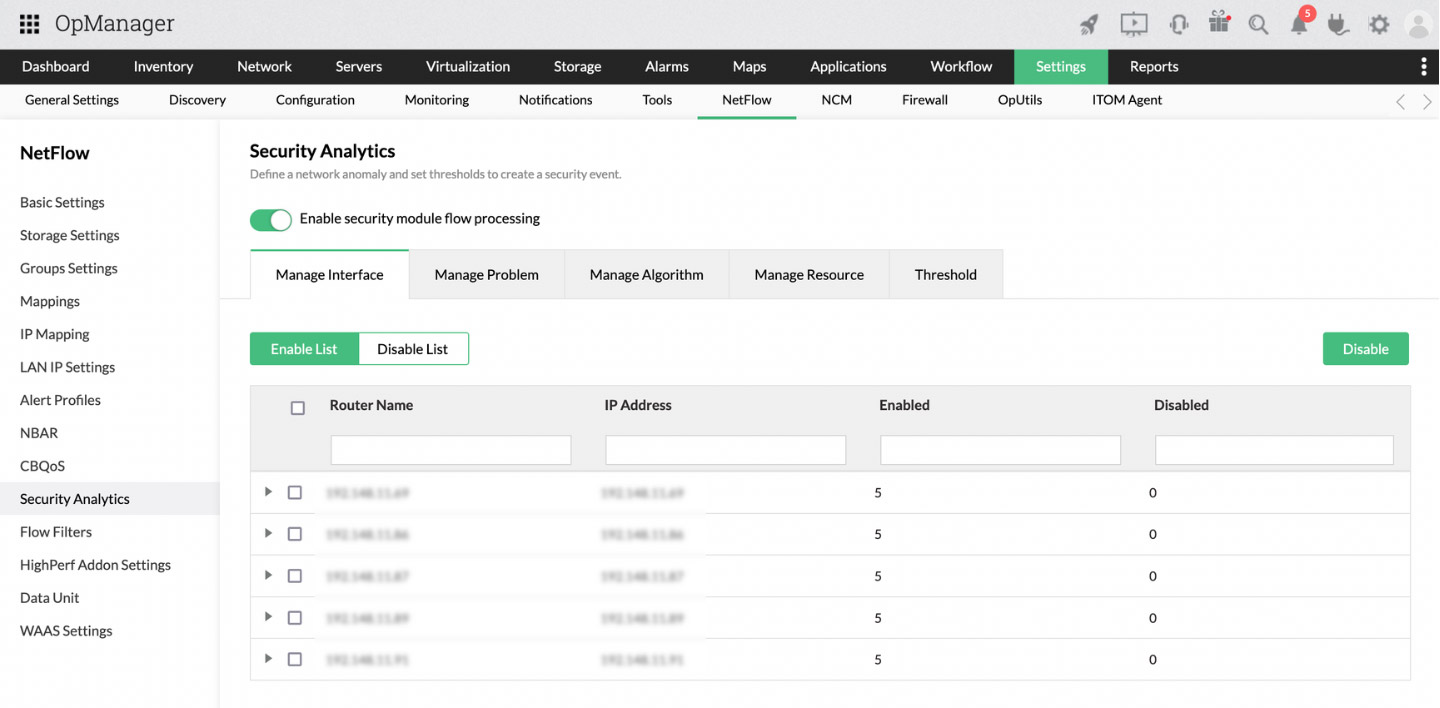
Also, access the NetFlow add-on's settings by going to Settings > NetFlow. There you will find a range of configuration options on the left-hand side of the UI.
Access and configure the various features of the network traffic monitoring add-on by going to Settings > NetFlow > Integration.
