More alerts don't mean more clarity. A single core switch failure in a modern enterprise network doesn't just raise one alert — it cascades into reachability, interface-down, and performance alerts across dozens of dependent devices, making the root cause harder, not easier, to find. For Ops teams, this means wading through fifty or more individual notifications that all stem from one root cause, often investigating the same failure from multiple angles without realizing it. The result is slower MTTR, alert fatigue, and duplicate incident tickets.
Consider a banking network during end-of-month processing, when transaction volumes are at their highest. A misconfigured network switch can cascade into dozens of alerts across payment gateways, authentication servers, and database nodes simultaneously. Instead of chasing each notification, OpManager's correlation engine surfaces them as a single, consolidated Problem, helping the Operations team isolate the misconfiguration quickly and prevent a wider service outage.
This is how Problem and Event Correlation in OpManager becomes essential, especially for NOC teams, IT Ops, and incident response teams who need to act quickly under pressure.
Adaptive Correlation Engine
OpManager's Event Correlation engine automatically groups related alerts into a single Problem under Alarms → Problems, so your team resolves the underlying issue instead of chasing individual notifications.
Intelligent Alert Grouping
When alerts arrive, the correlation engine processes them through two complementary methods, ML-based grouping and rule-based correlation, to identify which alerts belong together.
Machine learning correlation
The engine uses a continuous learning model that maps relationships between events across devices within a defined group, retraining every three hours to refine its pattern recognition baseline and evaluating new alerts every three minutes to correlate related events in real time. It also uses your network topology map to understand device dependencies, so when a parent device fails, downstream alerts are recognized as consequences rather than independent failures.
For scenarios where pattern learning alone isn't sufficient, such as new infrastructure or uncommon failure modes, the engine applies rule-based correlation. Rules detect the same metric firing across multiple devices, a single device generating multiple metric alerts, alerts sharing a common upstream parent, or a metric rapidly toggling between normal and alert states. Each rule can be individually enabled, disabled, or tuned.
Once a correlated set is identified, a Problem is created automatically and updated as new matching alerts arrive. Problem severity updates dynamically based on the highest severity alert in the group, and matching alerts merge into existing open Problems rather than creating duplicates.
Gen AI Root Cause Analysis
Once alerts are grouped into a Problem, OpManager's Gen AI engine analyzes the full incident context, including all correlated alerts, affected device details, network topology, and the event timeline, to identify the root cause and suggest remediation steps.
The output is a human-readable summary that tells your team what broke, why the alerts are related, and what to do next. To run this analysis, click Analyse with AI from within any open Problem.
Consolidated Problem Overview
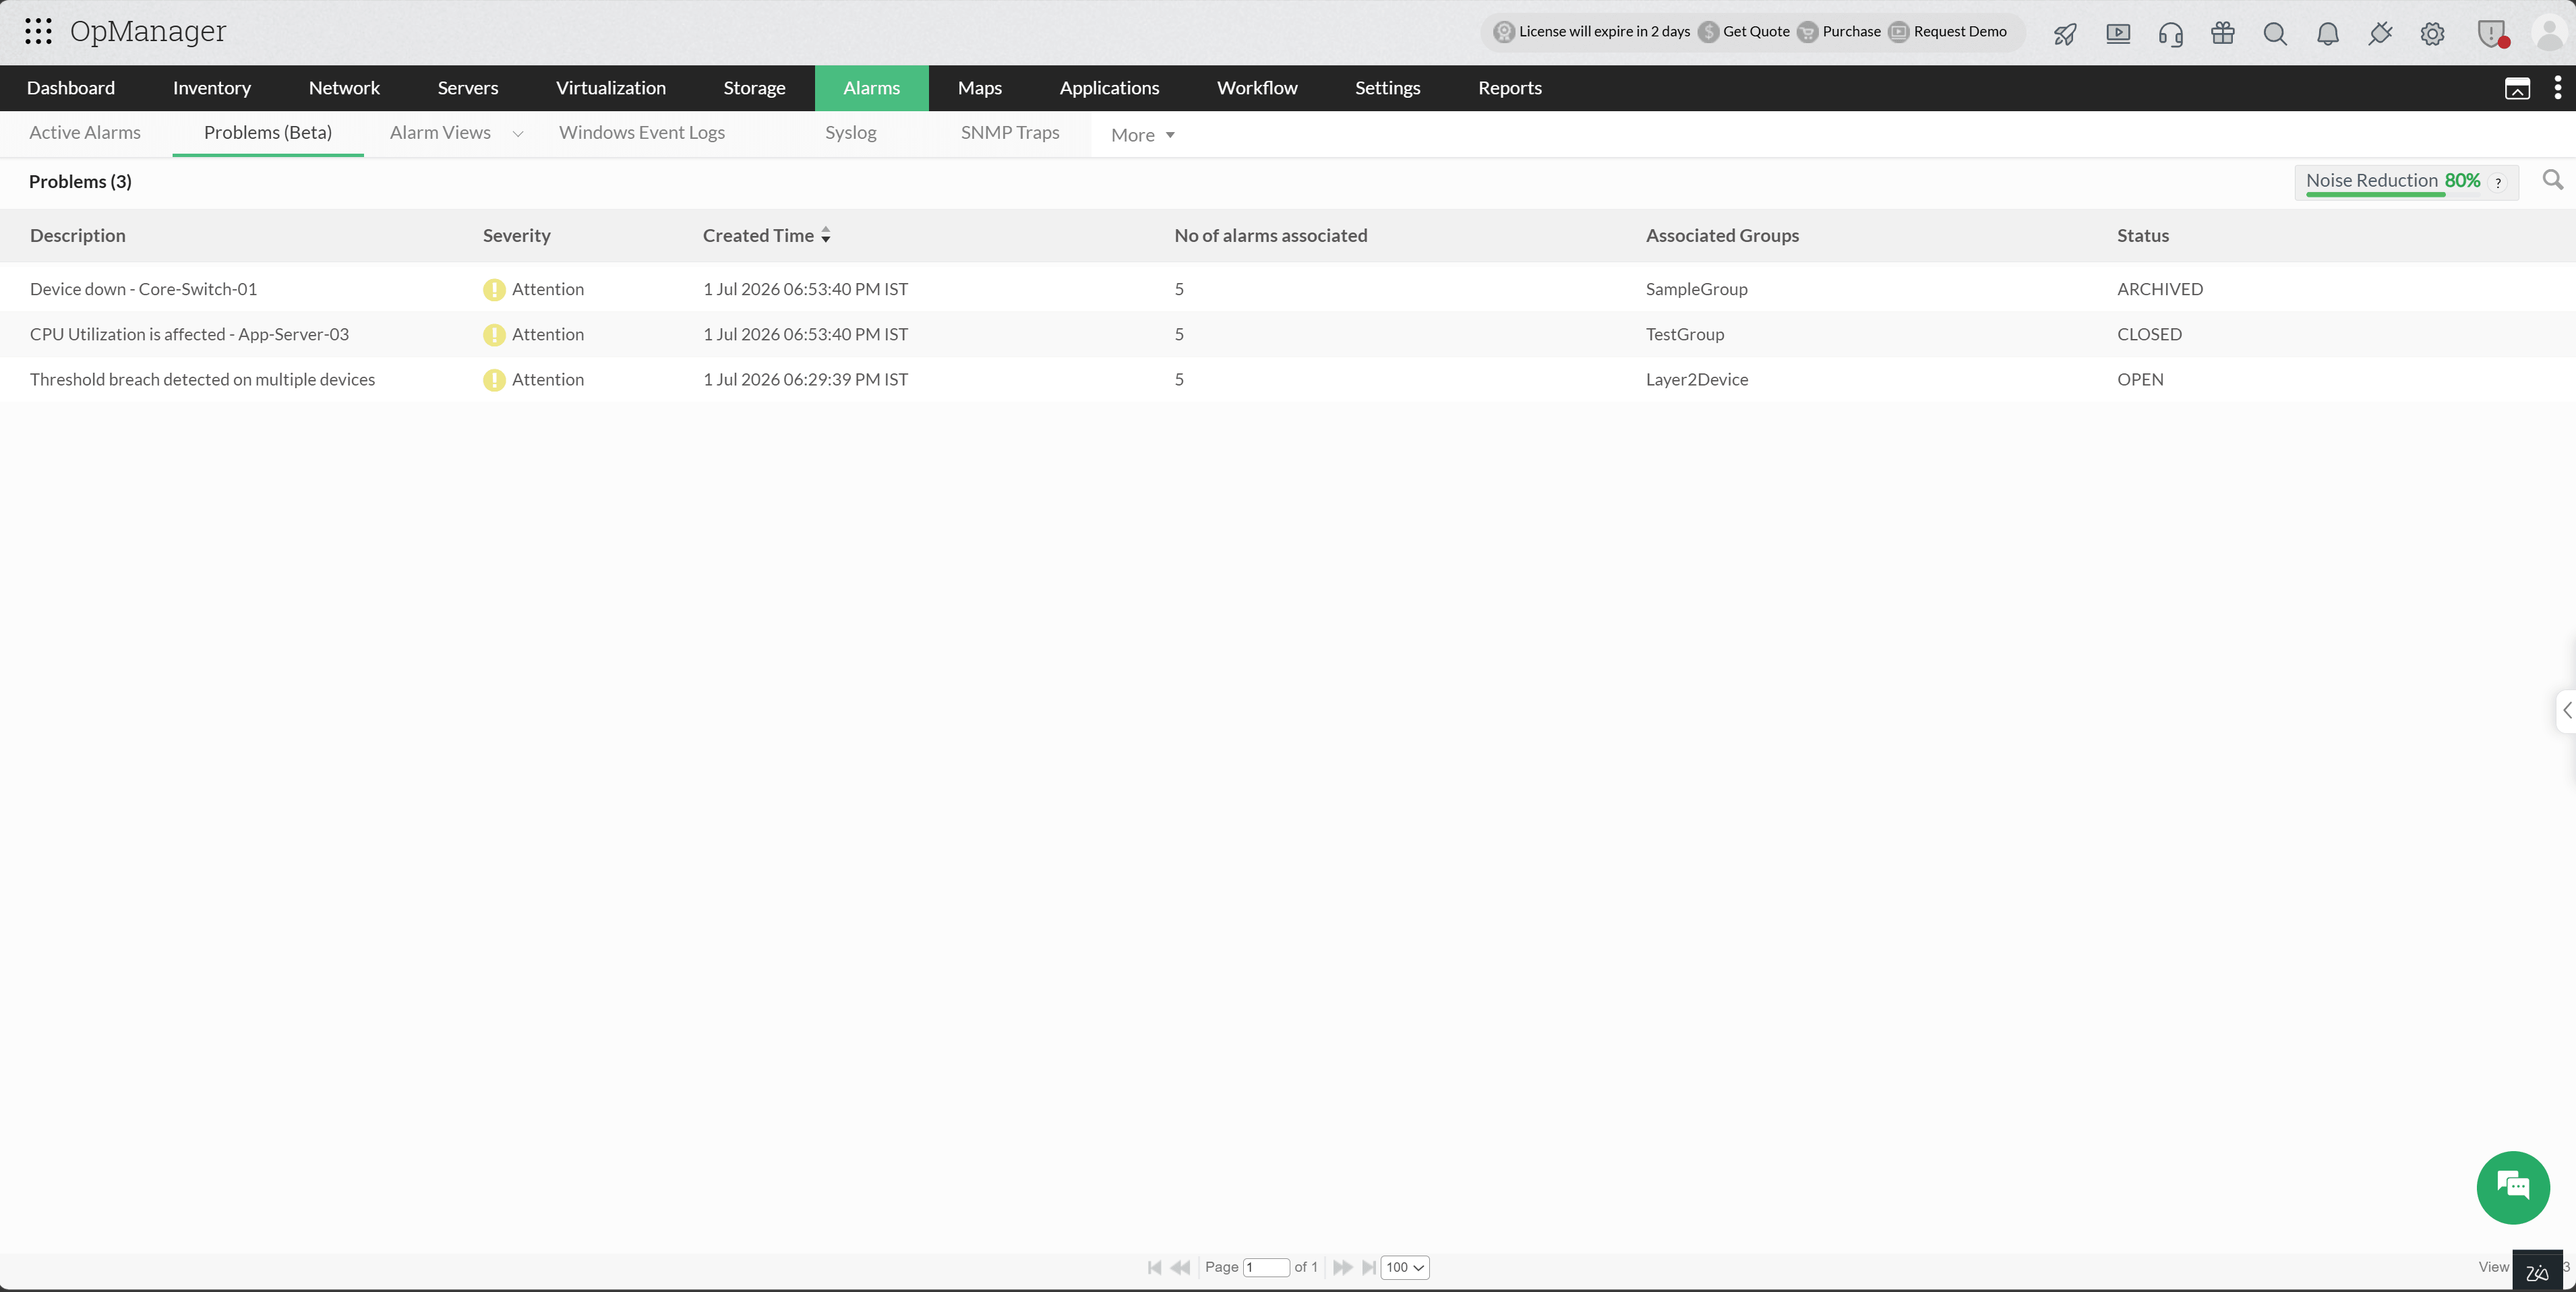
Once Event Correlation is enabled, all detected Problems are surfaced in a single dedicated view under Alarms → Problems. Each Problem displays its Severity, Creation Time, Number of Associated Alerts, Group, and Current Lifecycle Status, giving your team full visibility at a glance. Each Problem also supports an editable title and description; clicking into any Problem gives direct access to all related alerts, with one-click navigation to individual Alarm detail pages for deeper troubleshooting.
Problem Lifecycle
A Problem is formed when the real-time evaluation cycle identifies incoming alerts as related based on the current learned model. Those alerts are either grouped into a new Problem or merged into an existing one if a matching cluster is already active. Once every three hours, when the model retrains, clusters can split or merge as new patterns emerge, affecting the Problems tied to them. The table below summarizes how these changes are reflected in Problem status:
| Status | Meaning |
|---|---|
| Open | Active and unresolved |
| Closed | Most associated alerts have cleared or been resolved |
| Archived | Alert relationships could not be reconfirmed after a retraining cycle |
Intelligent Noise Reduction
As your network environment scales, alert volume grows, bringing with it the risk of treating symptoms as individual incidents rather than recognizing a shared root cause. Event Correlation collapses that volume by correlating related alerts into unified Problems, giving teams a cleaner, more actionable signal.
Problems Widget: Each Group under Inventory now includes a dedicated Problems widget, surfacing all open Problems generated by alerts from devices within that group. Rather than scanning a flat alert list, operators get an immediately readable snapshot of correlated issues scoped to the relevant devices, bringing the Problems that require attention together, at a glance.
Notification Profiles for Problem Alerts: Notification profiles now extend to Problem-level alerting, with a subject-line variable, Impacted Sources, to clarify the list of affected devices directly in your inbox, without needing to open the console first. Integration is supported with ServiceDesk Plus, ServiceNow, Slack, Microsoft Teams, email, SMS, and webhooks.
Noise Reduction: The Problems tab surfaces a noise reduction percentage: a direct measure of how much alert noise has been absorbed through correlation. A higher percentage reflects a quieter, more signal-rich environment where you spend less time triaging duplicates.
- A device-down alert produces a device-focused name.
- A threshold violation uses the metric or graph context, such as CPU, memory, or partition usage.
- An interface issue uses the affected interface details.
- A URL or service issue uses the monitored endpoint or service context.
- Device down - Core-Switch-01
- CPU Utilization is affected - App-Server-03
- Multiple issues detected on Database-Server-01
- Threshold breach detected on multiple devices
Per-Group Configuration
Event Correlation can be enabled or disabled at the logical group level, across device groups and locations. This gives teams granular control over where and how correlation is applied.
For example, ML-based grouping can be enabled for production infrastructure where alert patterns are well-established, while rule-based correlation is more appropriate for lab or staging environments with less historical data. For device groups where independent alert visibility is preferred, such as isolated monitoring zones or compliance-scoped segments, correlation can be disabled entirely without affecting the rest of the deployment.
How Problem Names Are Created
OpManager does not assign a generic title when a Problem is created. It analyzes the alerts inside the Problem and selects the one alert that best represents the incident, then uses that alert to generate the final Problem name.
The naming flow follows three levels of priority:
| Priority layer | How OpManager decides |
|---|---|
| Vertical context | Application alerts are prioritized over Network alerts, and Network alerts are prioritized over Infrastructure alerts. |
| Incident type | Availability issues are prioritized first, followed by Performance, Configuration, Capacity, Flapping, and Security events. |
| Severity | If two alerts still rank equally, the alert with the higher severity is used as the naming source. |
This ensures the Problem name reflects the most meaningful symptom in the group instead of an arbitrary alert.
Once the representative alert is chosen, OpManager builds a human-readable name based on the alert type:
For rule-based correlation, OpManager generates rule-aware names. If multiple metrics fail on the same device, the Problem name highlights that multiple issues were detected on that device; if the same issue appears across multiple devices, the name is generalized to reflect that the issue affects multiple sources. If no specialized naming pattern is available, OpManager falls back to the original alert message so every Problem still gets a meaningful, readable title.
For example:
Learn more about how to configure Event Correlation in OpManager. For a technical demo of the product assisted by our experts, fill out this form.
Learn more about OpManager.