Unified Proxmox infrastructure monitoring with OpManager
Proxmox Virtual Environment (VE) is an open-source virtualization platform that combines KVM-based (Kernel-based Virtual Machine) hypervisors and Linux containers (LXC) into a single, efficient solution. With built-in storage, centralized networking, and an easy-to-use management interface, Proxmox VE provides a scalable and cost-effective virtualization stack for modern IT environments.
However, managing virtual environments without proper monitoring can lead to significant challenges. Performance issues go undetected, resource allocation becomes inefficient, and troubleshooting becomes time-consuming when administrators lack visibility into cluster health, node performance, and individual VM metrics. Without comprehensive monitoring, IT teams often struggle to prevent downtime, optimize resource utilization, and maintain peak performance across their virtual infrastructure.
To ensure peak performance and availability across Proxmox virtual environments, IT teams need end-to-end visibility—from physical nodes to VMs and containers. ManageEngine OpManager offers deep, real-time monitoring of your entire Proxmox VE infrastructure from a single console.
Key features of OpManager’s Proxmox monitoring
With OpManager, Proxmox monitoring becomes seamless and efficient:
- Unified visibility across clusters, nodes, and VMs. Monitor your entire Proxmox environment from a single console. OpManager consolidates performance and availability data across nodes, virtual machines, and containers. This unified monitoring helps administrators quickly assess overall infrastructure health and identify bottlenecks without delays.
- Automated updating of virtual resources. OpManager leverages Proxmox’s REST API to automatically detect and map all nodes, VMs, and containers in your environment. As your infrastructure scales, new resources are discovered and updated in real time, ensuring your inventory always stays accurate and complete. VM migrations are also captured, helping administrators maintain an up-to-date view of their virtual environment. This reduces manual tracking effort and minimizes the chances of configuration errors.
- Comprehensive historical data and baselines. OpManager maintains detailed performance histories for all monitored Proxmox components. These baselines help IT teams analyze long-term trends, troubleshoot recurring issues, and forecast resource requirements. Having access to extended performance data allows for better capacity planning and more effective decision-making.
- Proactive performance alerting. Set custom thresholds and receive real-time alerts when performance metrics deviate from expected ranges. OpManager not only detects issues early but also integrates with workflows and notifications to help teams act before they impact users. This proactive monitoring reduces downtime risk and supports SLA compliance across your Proxmox infrastructure.
OpManager ensures complete visibility and faster resolution of issues, helping teams maintain optimal service availability.
OpManager: A complete Proxmox monitoring solution
OpManager uses Proxmox's native REST API to automatically discover and monitor clusters, nodes, virtual machines, and containers with minimal configuration. Once discovered, these resources are categorized under a dedicated Proxmox VE tab in the Virtualization section, offering a structured and contextual overview of your infrastructure.
With OpManager, IT teams can monitor performance, availability, and resource consumption in real time, detect anomalies early, and proactively resolve issues before they affect end users.
Discover your entire Proxmox infrastructure in minutes
OpManager simplifies onboarding with Proxmox's REST API. Using a single node's IP and user credentials, it discovers the entire cluster, including all connected nodes, VMs, and containers. It automatically maps VMs already monitored in OpManager as virtual devices to avoid duplication.
Configuring discovery is quick and simple. Just provide the REST API credentials, select the auto-discovery options, and start monitoring—no agents required. If the QEMU Guest Agent is installed on the VM, OpManager also auto-fetches the VM's IP address for seamless integration.
In-depth monitoring across clusters, nodes, VMs, and containers
OpManager delivers real-time performance monitoring across all levels of your Proxmox infrastructure:
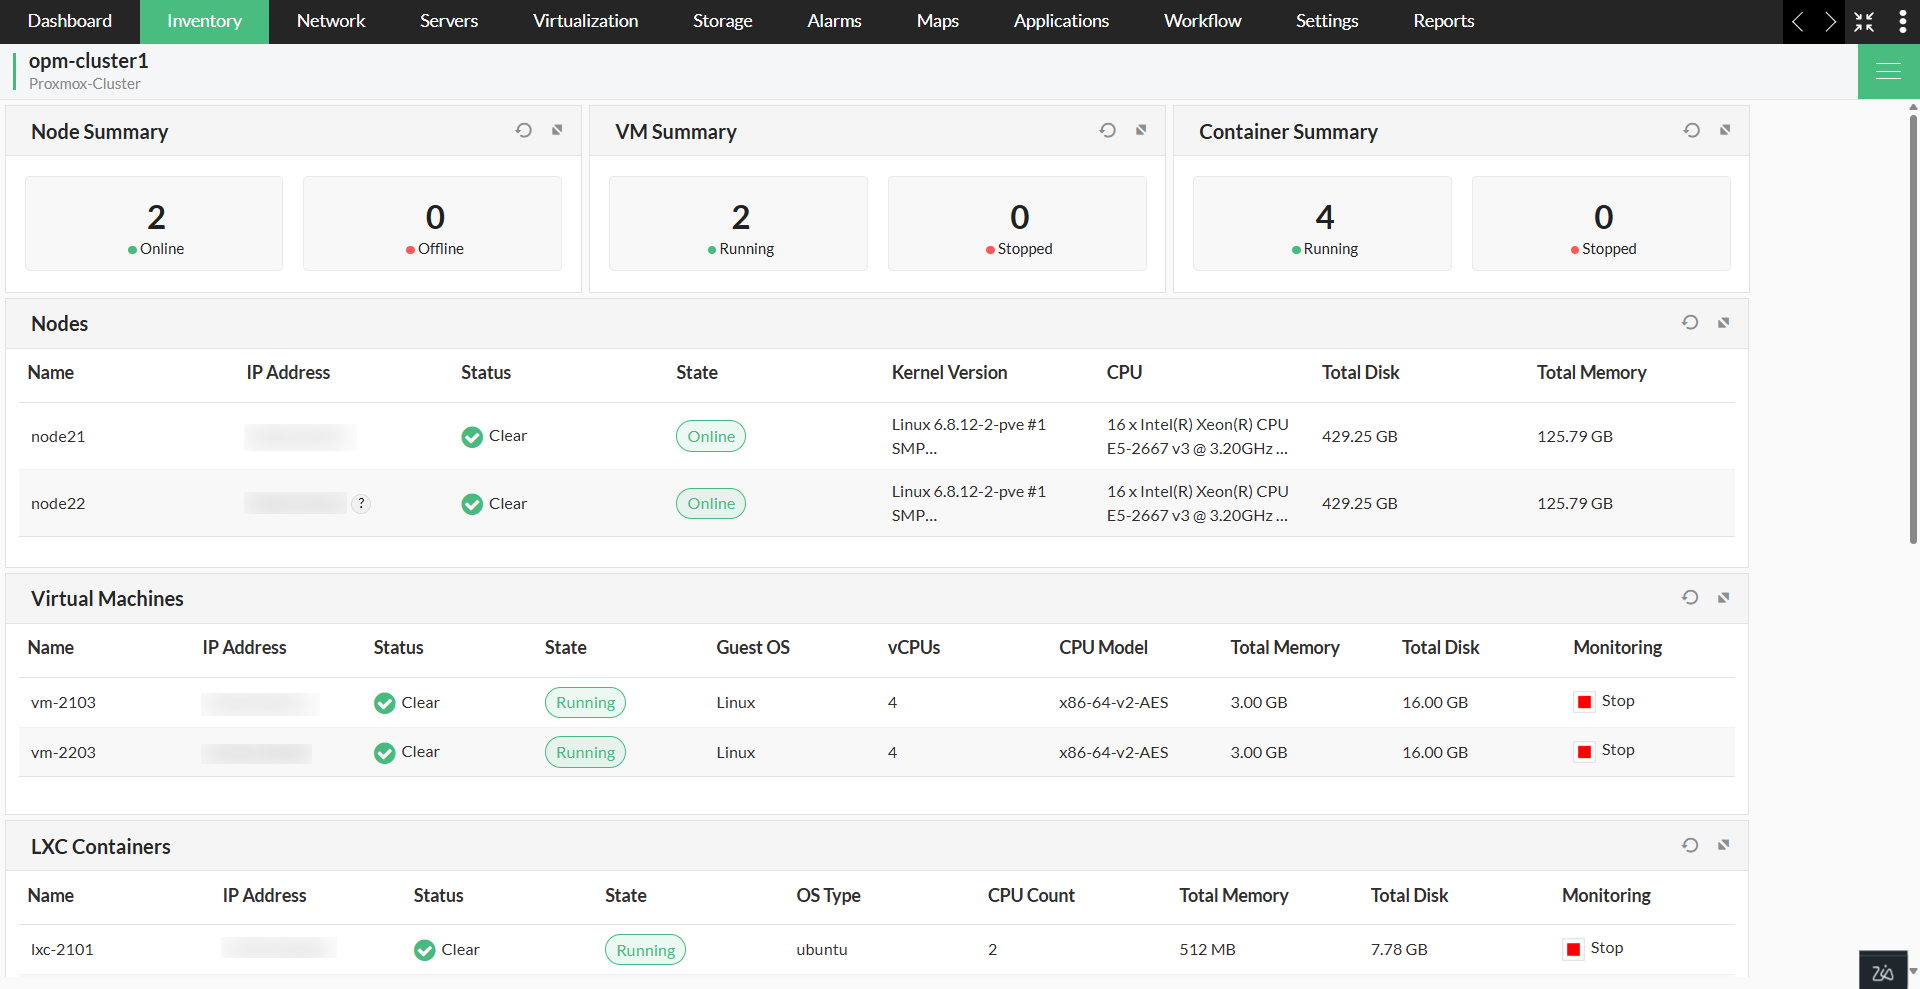
- Clusters: Get a holistic view of your Proxmox cluster, including active nodes, storage pools, VMs, and containers. Rediscover clusters to update inventory as your environment scales.
- Nodes: Monitor CPU load, memory utilization, disk capacity, network traffic, and interface status. View alarms, associate workflows, and drill down into individual VMs and containers from the node snapshot page.
- Virtual Machines: Track resource usage, uptime, availability, and packet loss for each VM. OpManager automatically displays CPU, memory, and I/O metrics using customizable dials and thresholds.
- Containers (LXC): View real-time container performance data and associate specific monitors for granular tracking. Container snapshots provide visibility into IP, CPU, memory, and storage usage.
All these layers are equipped with detailed monitoring, alert profiles, and notification integrations to reduce mean time to resolution (MTTR) and improve operational efficiency.
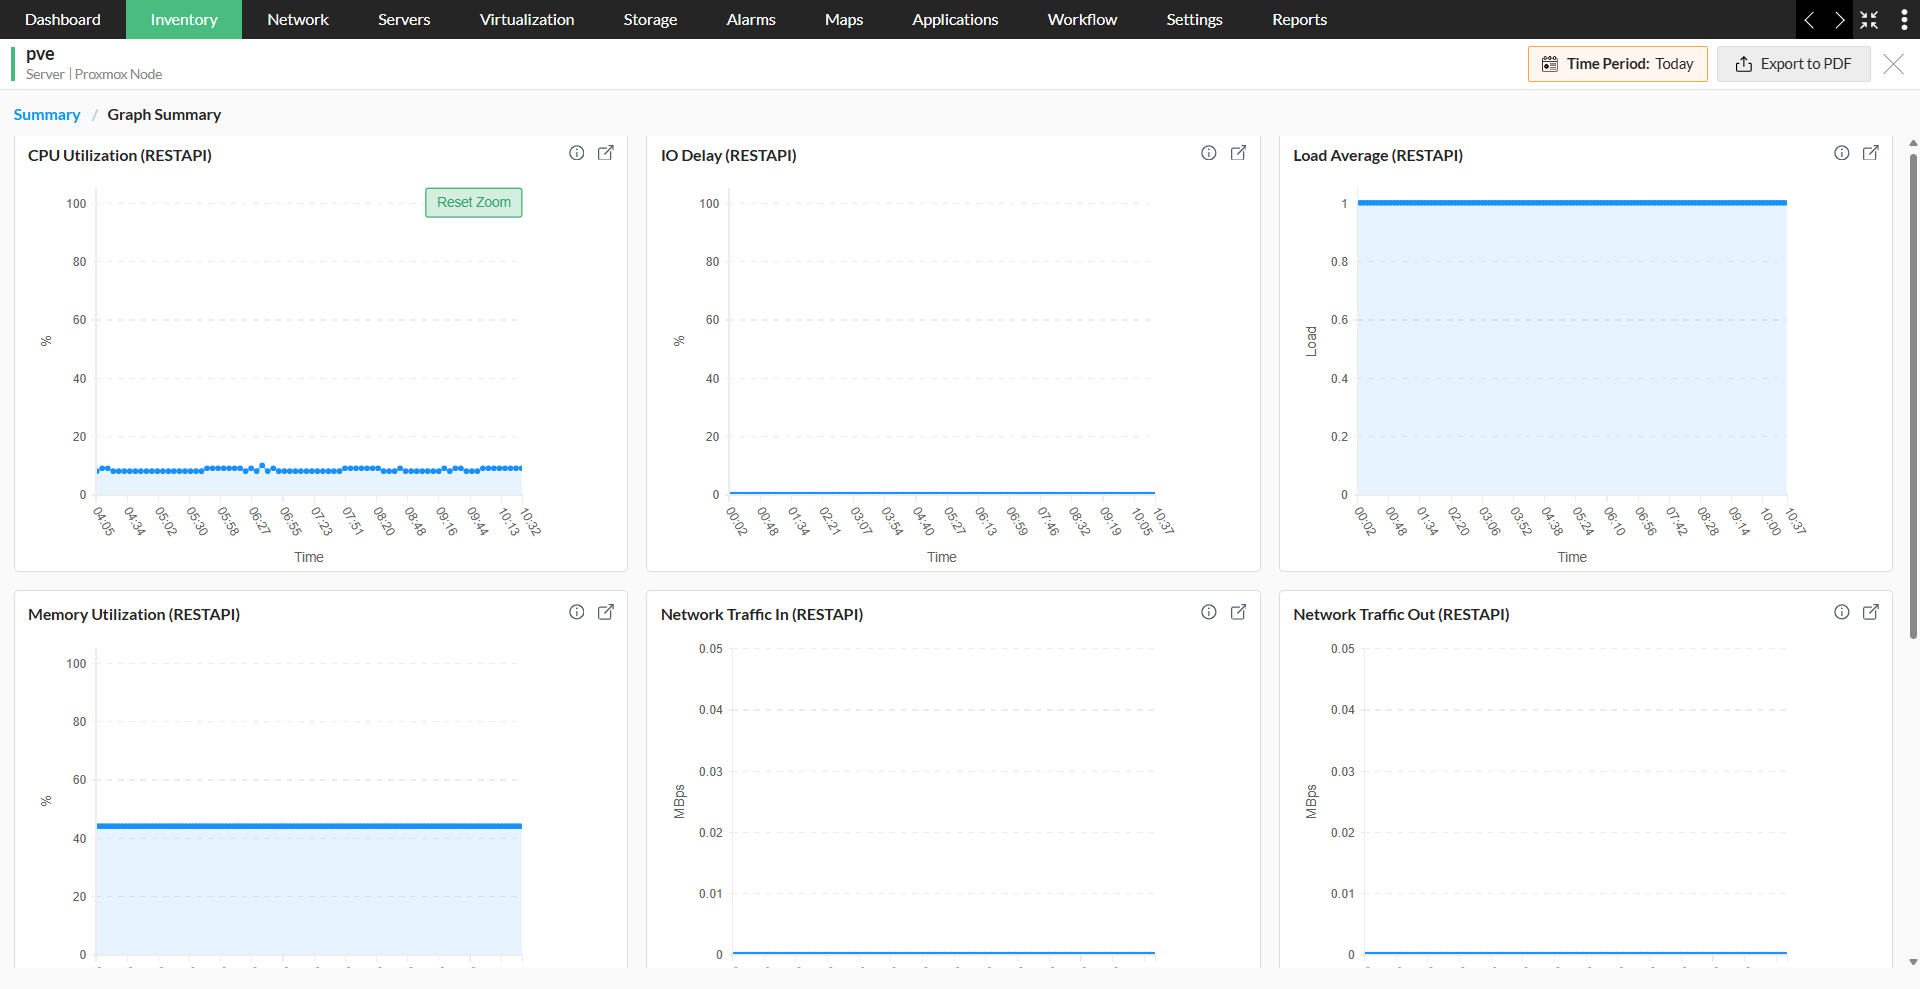
Get real-time visibility into performance metrics
Once your Proxmox clusters, nodes, and VMs have been added to OpManager, the relevant performance monitors are automatically associated. By default, OpManager provides a wide range of metrics for Proxmox performance monitoring—including CPU and memory utilization, network traffic, and load average—which are collected directly through the Proxmox REST API. Thresholds can be defined for these metrics to trigger real-time alerts when performance deviates from expected levels, while adaptive thresholds automatically learn from historical data to set intelligent baselines and reduce false alarms.
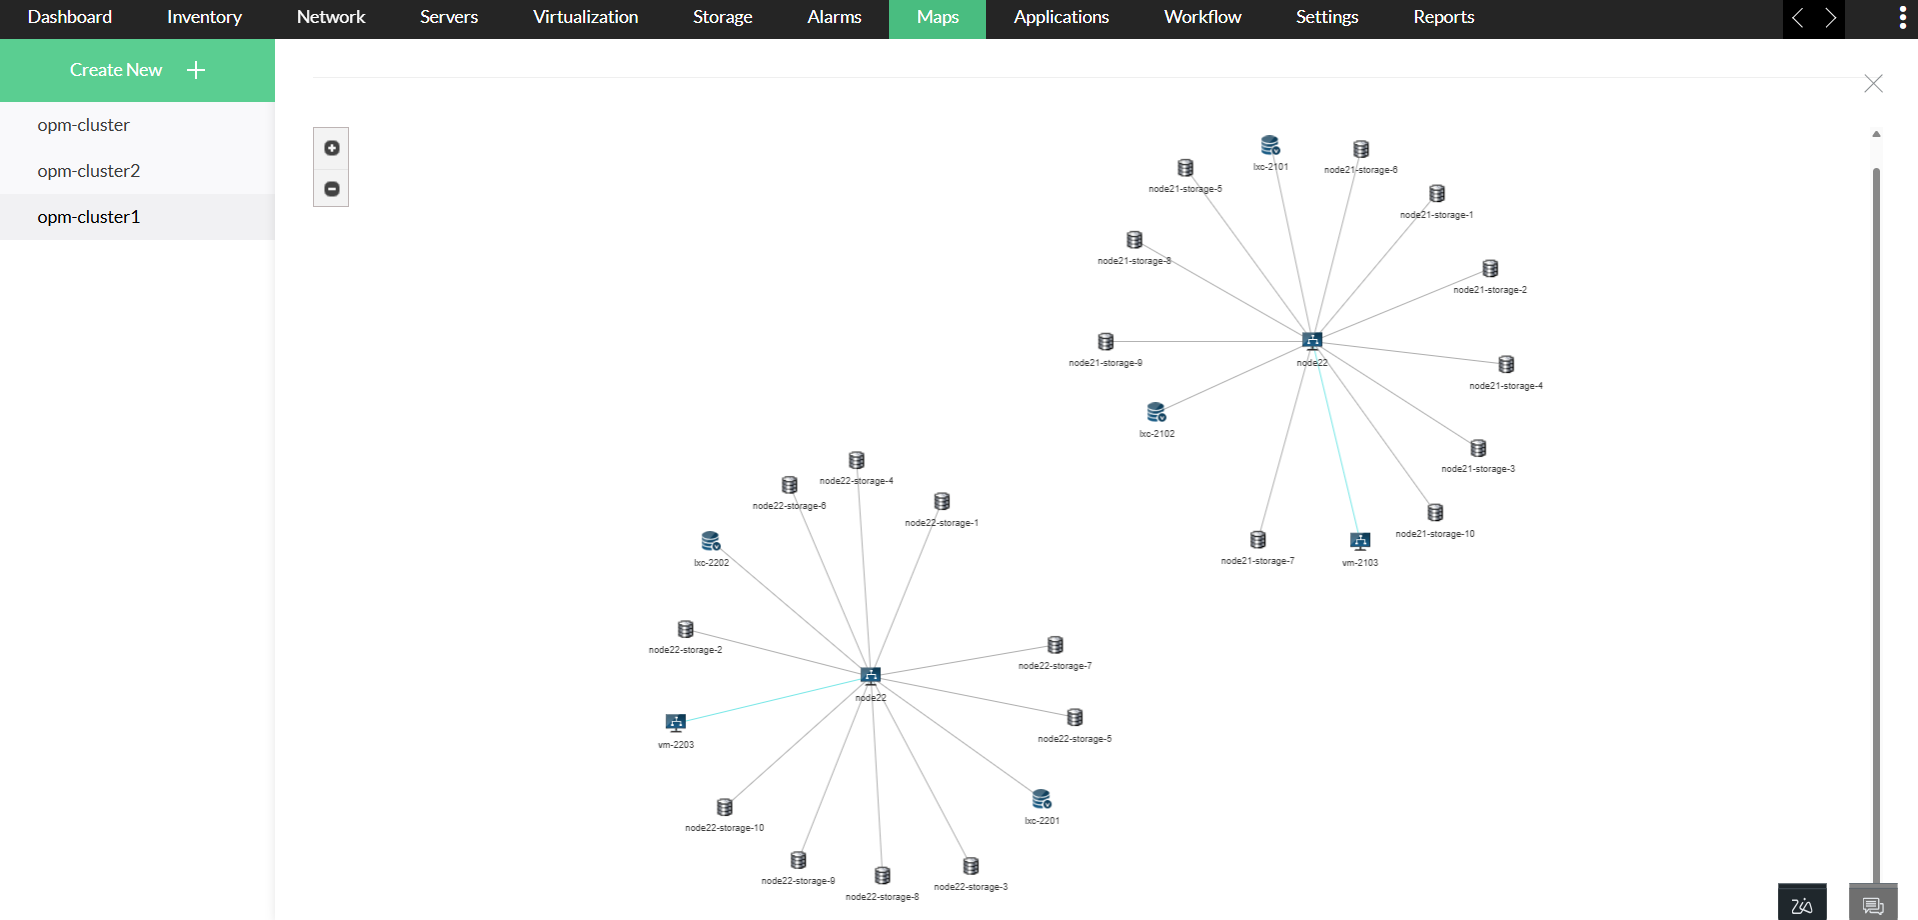
Visualize your Proxmox infrastructure
OpManager provides visual context to your monitoring data through filtered inventory views:
- Cluster view: OpManager offers a consolidated view of your Proxmox clusters, displaying all associated nodes, VMs, and containers in one place. From a single interface, you can assess how resources are distributed, monitor performance metrics in real time, and track the health of each component—making it easier to manage infrastructure at scale.
- Device view: Filter devices based on Proxmox-specific attributes, helping teams focus on priority elements in complex infrastructures.
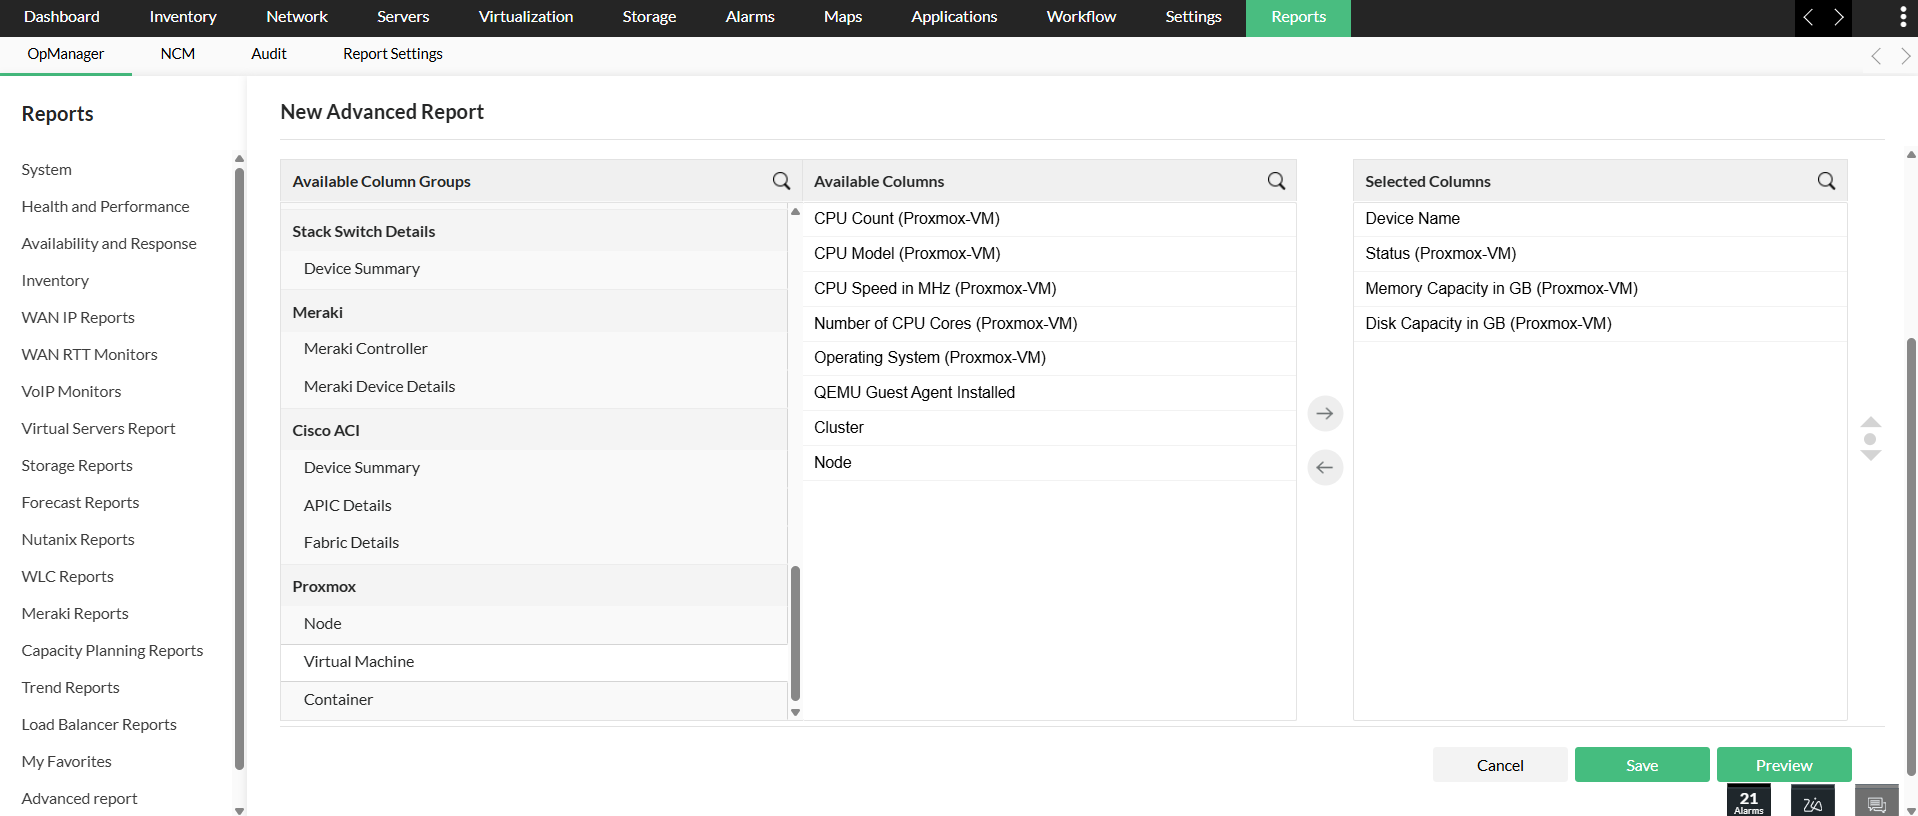
Dashboards and reports tailored for Proxmox
OpManager’s out-of-the-box dashboards and reports provide complete visibility into your Proxmox infrastructure:
- Virtualization dashboard: Displays real-time widgets that highlight resource utilization, performance trends, and overall status across Proxmox nodes, VMs, and containers.
- Advanced report: Generate detailed reports to analyze historical performance, track SLA compliance, and forecast resource requirements. Proxmox VMs are also listed in the All Virtual Machines report under the Virtual Servers category.
Why choose OpManager for Proxmox monitoring?
With native Proxmox support, automated discovery, efficient alerting, and intelligent visualizations, OpManager enables IT teams to gain complete visibility across their virtual and physical infrastructure. Whether you manage a few hosts or a full-scale virtualized datacenter, OpManager scales effortlessly with your environment—helping you optimize resources, ensure uptime, and stay ahead of performance issues.
Ready to transform your Proxmox monitoring experience? Try OpManager's comprehensive virtualization monitoring with a free, 30-day trial and discover how unified infrastructure visibility can optimize your virtual environment performance.
OpManager also provides complete visibility into Nutanix environments with insights into clusters, hosts, and VMs, along with real-time performance metrics. Read more about Nutanix monitoring.
Simplify Proxmox monitoring with OpManager.
Download 30-day free trialCustomer reviews
Case Studies - OpManager
Awards & Honors
- Recognized as a May 2019 Gartner Peer Insights Customers' Choice for Network Performance Monitoring and Diagnostics Software
- Recognised as an April 2019 Gartner Peer Insights Customers' Choice for IT Infrastructure Monitoring Tools.
- Network Management and Monitor Vendor of the Year 2018, 2019
- Entered the 2019 Gartner NPMD Magic Quadrant.
- Ranked #2 in the Infotech Research Software Reviews Data Quadrant 2018.