SAN management
Data has become an essential part of today's business and it's only growing exponentially. With the increased rise in data creation, transmission and usage, the need to preserve such data and prevent latency also has grown. Since storage latency is directly related to application performance, and connected with business operations, maintaining the network throughput and further enhancing the data accessibility is vital. The role of a storage area network (SAN), which creates an exclusive, high-speed network separated from local area network (LAN), provides block-level storage by pooling storage devices.
Monitoring SAN with a dedicated SAN management tool like ManageEngine's OpManager is crucial to ensure optimum availability, health, and performance of SAN devices.
SAN management with OpManager
ManageEngine's OpManager is an integrated storage monitoring system which ensures SAN devices availability, and reduces or prevents storage latency, by performing threshold-based monitoring and prompt alerting. It monitors and manages various SAN components, such as RAIDs, tape libraries and FC switches, from a unified console, aiding for an effortless SAN management. OpManager's comprehensive reporting on growth trends and capacity utilization helps you make an informed decision on storage purchases, thereby making it the best storage monitoring software in the IT market.
SAN inventory and performance monitors:
OpManager supports more than 30 storage system vendors, to discover and fetch extensive information of storage devices such as RAIDs, tape libraries, and FC switches, through vendor-specific APIs or MIBs. OpManager presents the fetched device data in the inventory and even automatically updates it with periodical scans, aiding in effective SAN management.
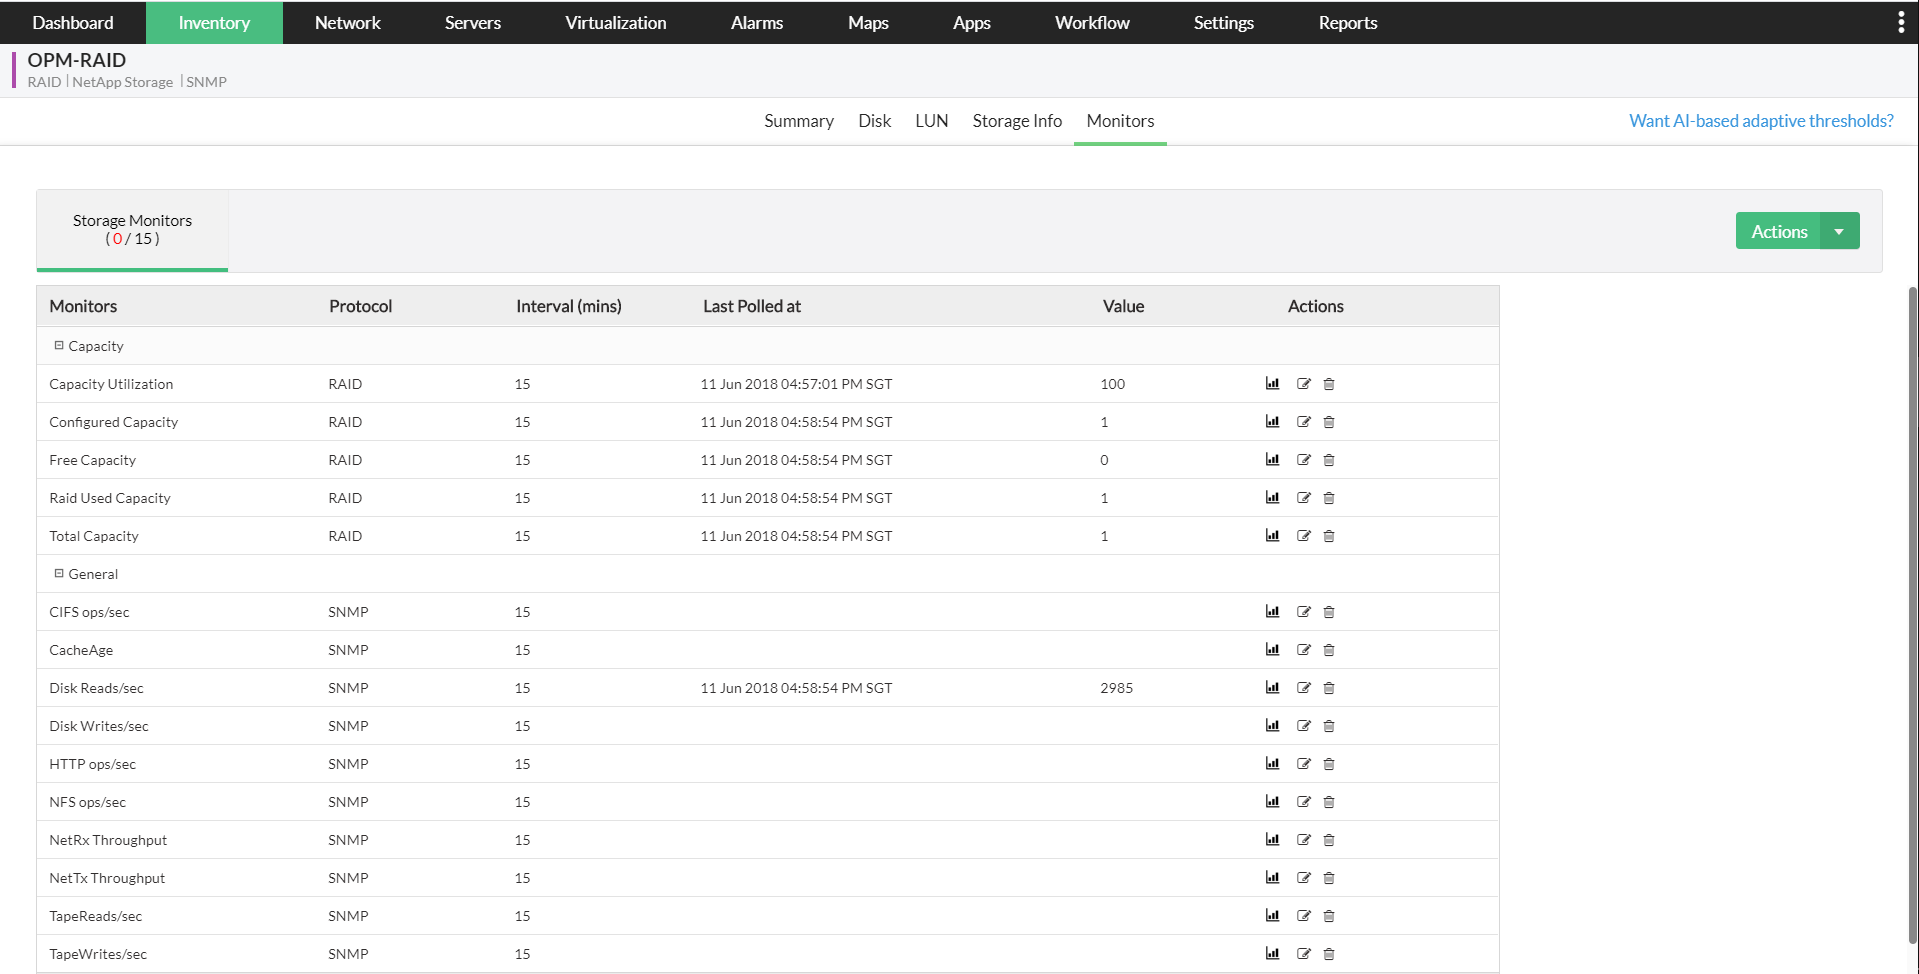
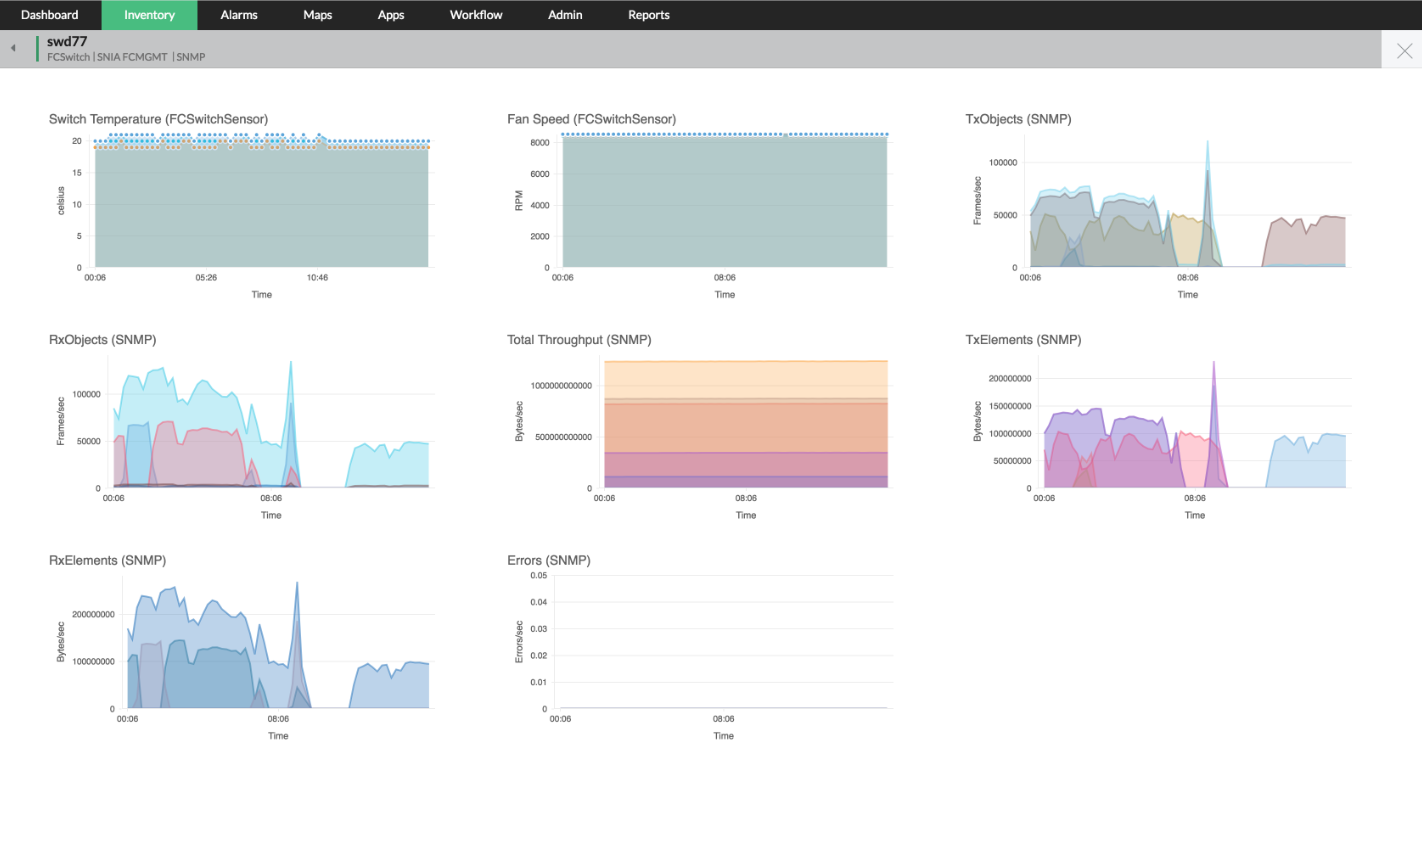
With OpManager's predefined storage templates, SAN devices are automatically associated with storage monitors upon discovery and can immediately begin monitoring. The SAN performance monitors scrutinize all the performance metrics at the defined intervals, including Throughput, Latency, Volume, Disk write/read related metrics, Capacity utilization, port status, hardware related metrics and more, and provides real-time graphs too. When you require more than default monitors, you can quickly and efficiently deploy others needed in your infrastructure from the wide selection of SAN performance monitors supported by OpManager.
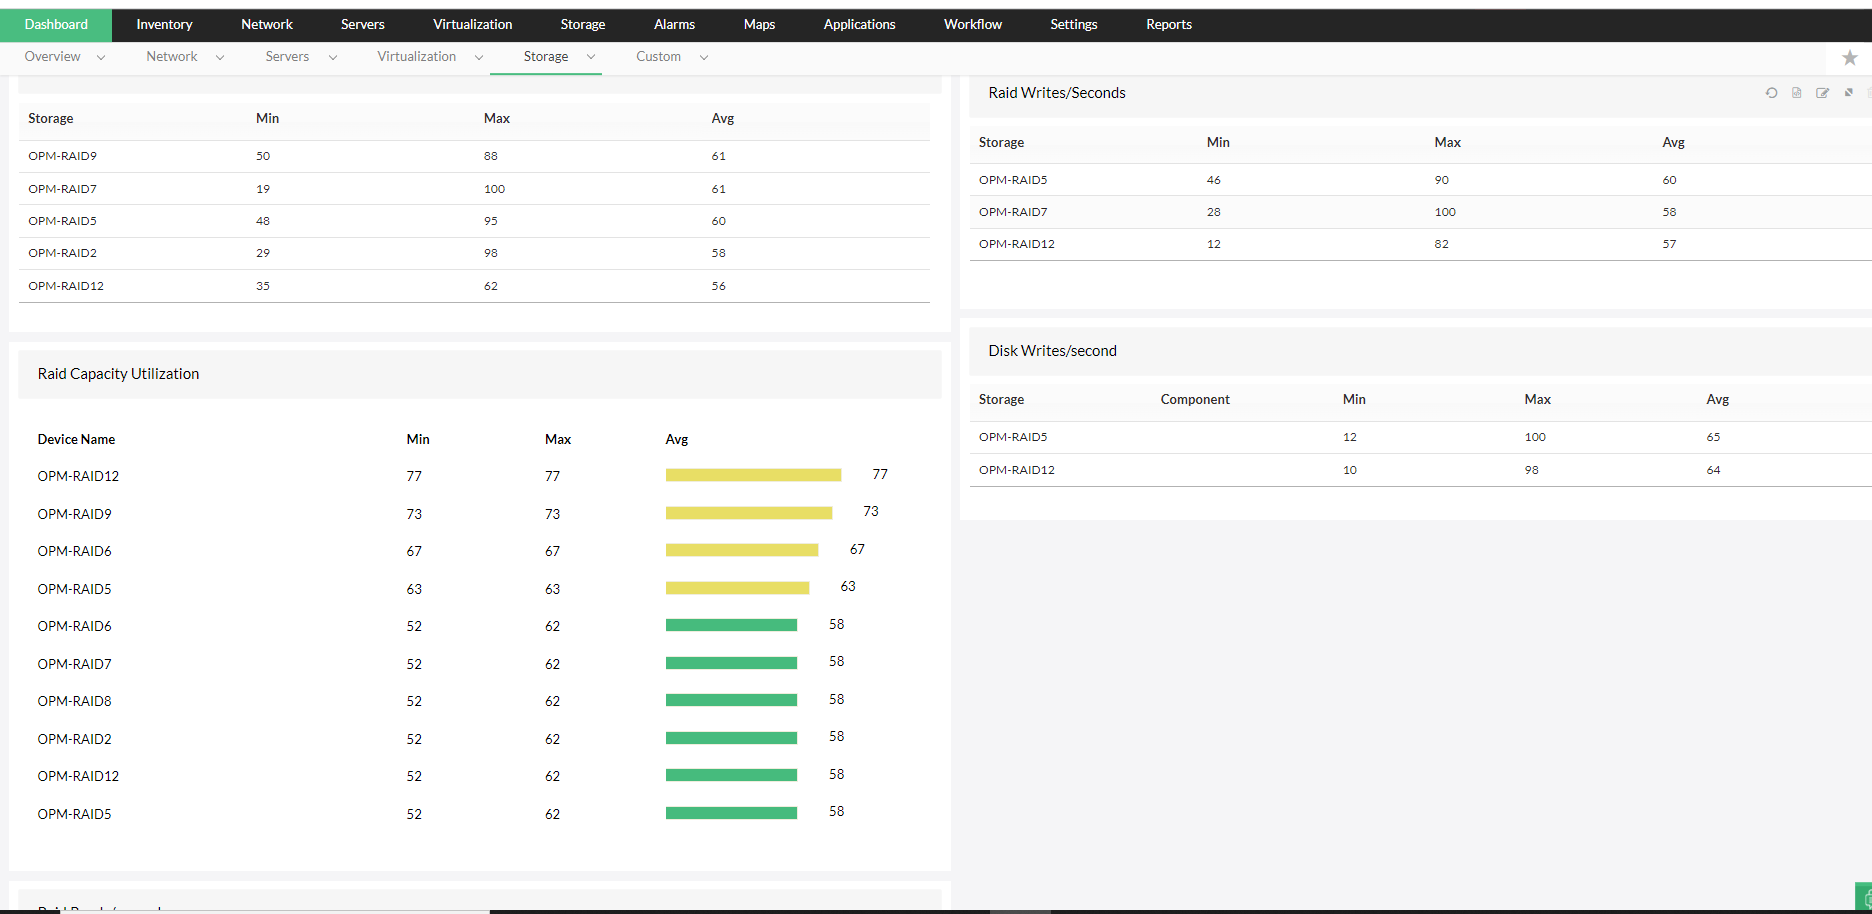
You can also configure and utilize custom SAN monitors that address your infrastructure's unique requirements. You can also view the data collected from each SAN performance monitor under storage reports, and perform detailed analysis of your storage environment.
Centralized SAN management with a dedicated SAN dashboard
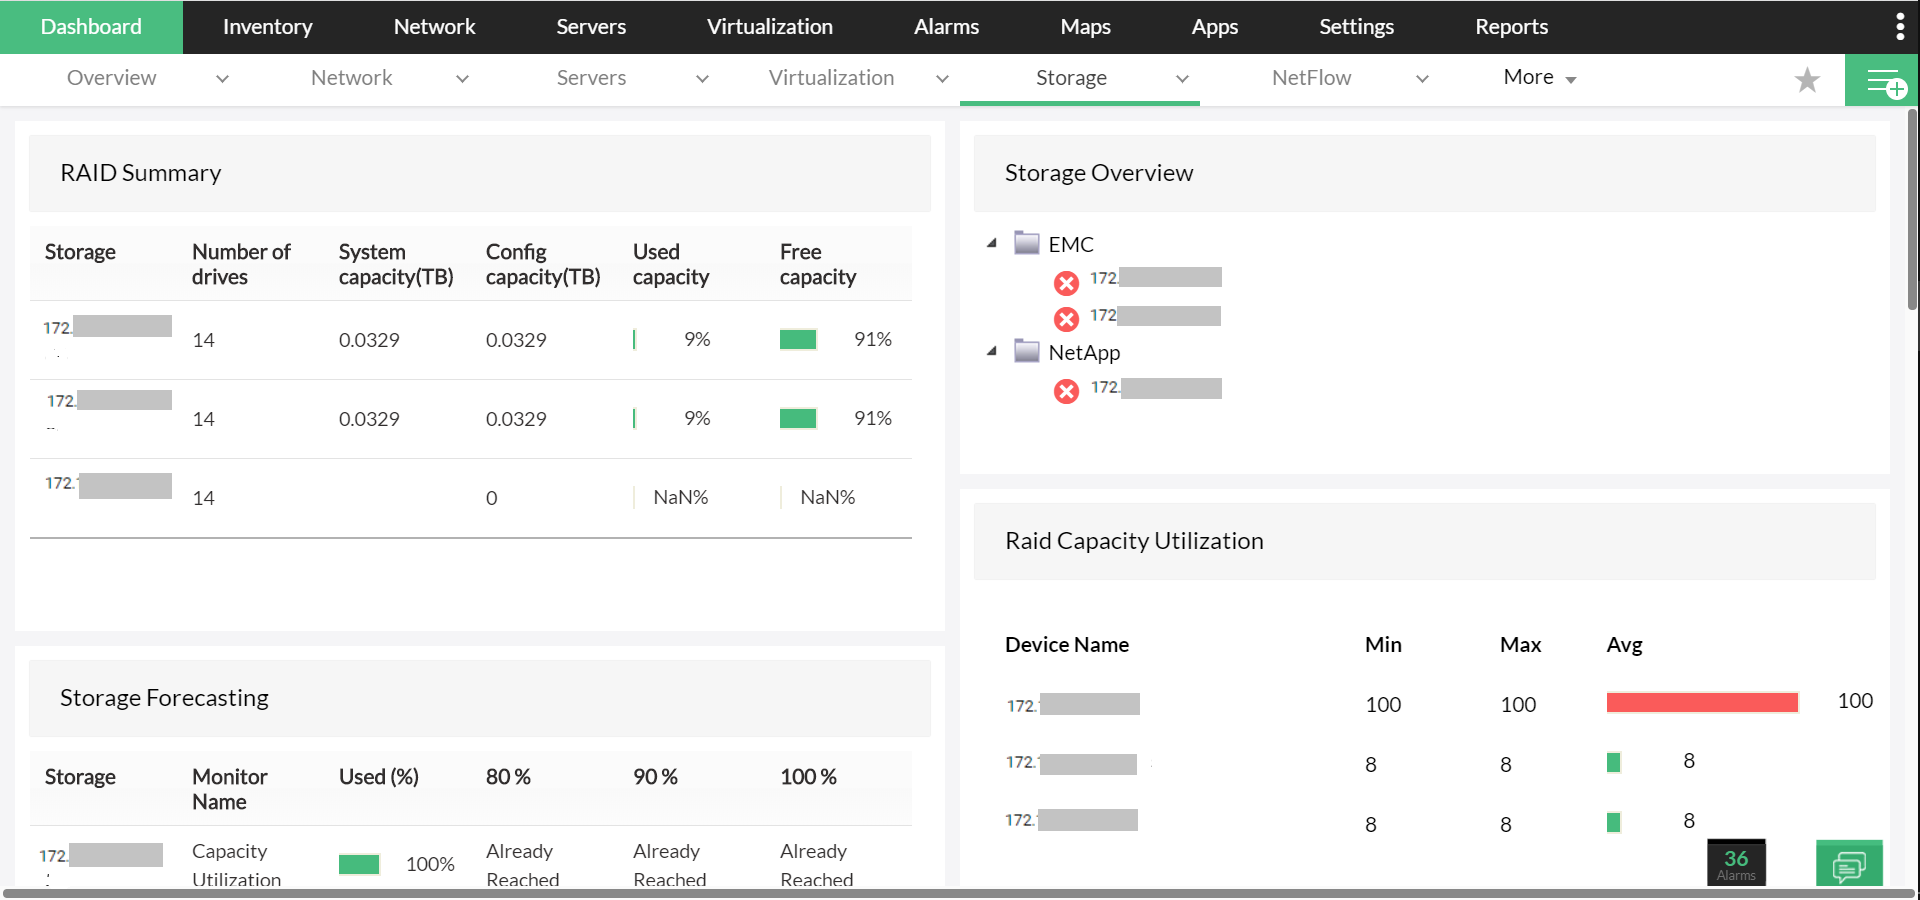
With a dedicated dashboard for SAN management, tracking the SAN health and performance is easy. The dashboard features availability, response, performance, and other key metrics for storage arrays, and RAID groups. Centralized SAN management is enabled by monitoring metrics both individually or in an overview - all from a single console.
- The storage overview lists all the storage devices present in your SAN, along with the vendor details, so you can keep an eye on storage devices that join or leave your network.
- With each SAN performance monitor displaying minimum and maximum usage or rate-related stats, you'll gain a clear picture of when the RAID or tape library needs to be resource reallocated, upgraded or replaced
- Adding to the dashboard the alarm widget, which displays recent alarms, unacknowledged alarms, and web alarms, you can quickly identify performance bottlenecks in the storage infrastructure and initiate troubleshooting process
- You can customize the SAN dashboard to take advantage of a wide range of widgets of different categories, including availability and response, health and performance, real time graphs, map views, alarms and events, and more.
SAN fault management system with alarms
OpManager enables you to initiate fault management best practices by promptly alerting you when they breach the set thresholds. These thresholds for hardware issues include battery failure, fan failure, power supply failure, drive failure, and for software issues include service breakdown or process failure, and sensor faults of SAN devices. You can check these alerts on your storage dashboard and under "Storage Alarms", which displays all the web alarms related to storage issues in a color-coded fashion, indicating severity. This way, you can easily identify and prioritize troubleshooting critical storage issues and prevent server latency.

Apart from these web alarms, OpManager notifies you about storage issues also via email, SMS, Slack channels, and more, so you can manage your SAN environment from wherever you are. You can also configure settings to escalate critical alarms to alternate persons when you are on vacation or busy with other critical tasks.
Storage capacity forecasting and planning with Reports
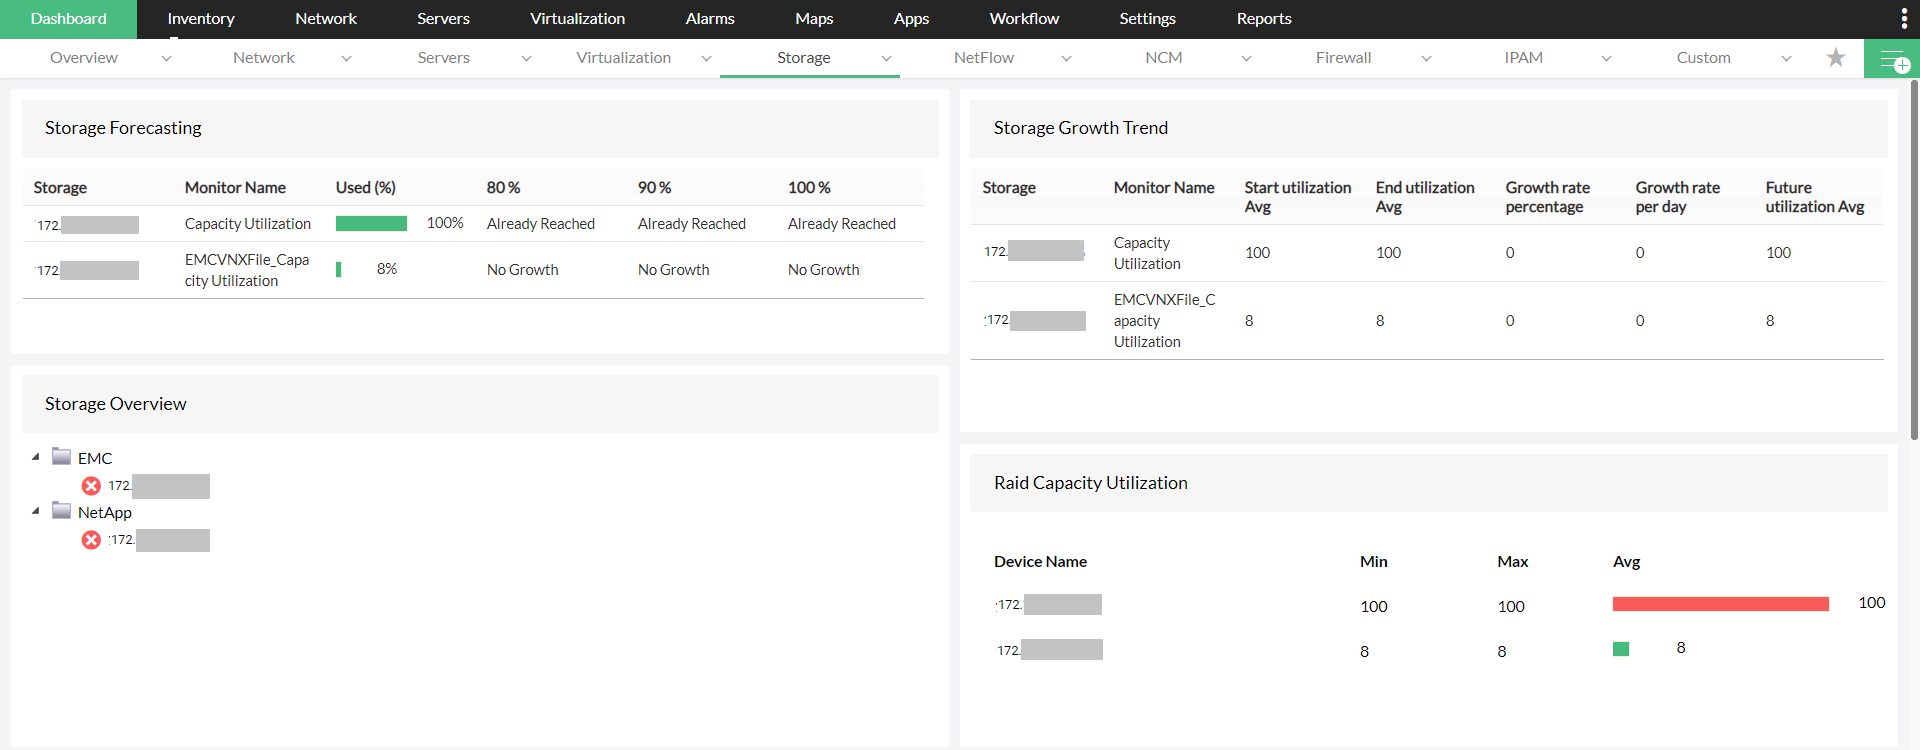
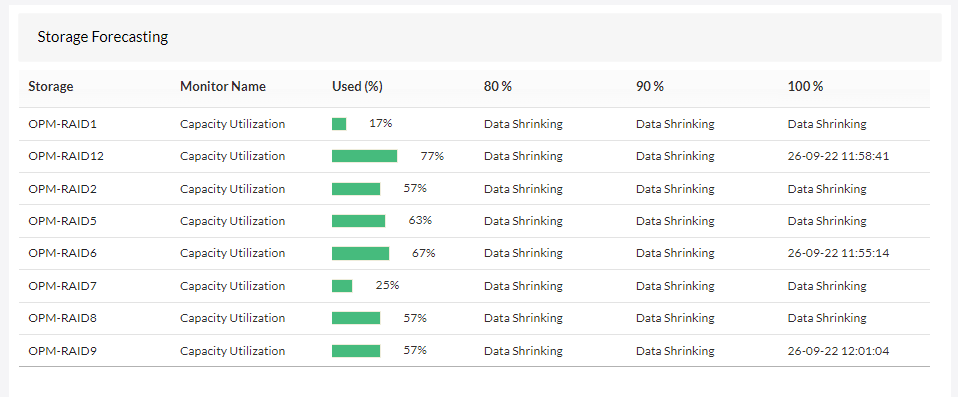
With ML-based algorithms, OpManager performs storage capacity forecasting and planning considering growth trends and data from capacity utilization monitor. Utilizing OpManager, you can generate reports reports that help you manage your SAN environment's future storage needs and make judicious storage purchase decisions. The report on "Storage Capacity Forecast by Utilization" uses historical growth trends to forecast when the SAN devices would reach 80%, 90%, and 100% of total allocated storage. The report on "Storage Capacity Forecast by Growth trends" stores storage details of SAN devices over a period so you can analyze their data growth patterns and predict future storage consumptions.

You can schedule reports on capacity trends to stay on top of storage operations anytime, and also set alerts on capacity utilization to take necessary actions, preventing unforeseen capacity issues.
Gain deeper visibility into SAN environment
Understanding the topological connectivity of your SAN arhcitecutre is easier with OpManager's network maps. With a link table displaying link name, source, destination, and color-coded icons depicting switch and interconnection status, understanding the topological connectivity of your SAN architecture is easier than before. This also helps you drill down to the root cause of storage or performance issues and act quickly, enabling proactive SAN management.
Need to know more about how OpManager's SAN monitor effectively manages the SAN environment and prevents storage issues with comprehensive monitoring? Download our 30-day, free trial, now!