Fabric Switch Management
ManageEngine OpManager manages Fabric switches based on SNIA's standard Fabric switch management MIBs. In addition, vendor specific MIBs and APIs are used to provide fine-grained monitoring capabilities. OpManager automatically discovers fabric switches in your environment.
OpManager provides out-of-box reports spanning inventory, performance and availability as given below.
Inventory Reports
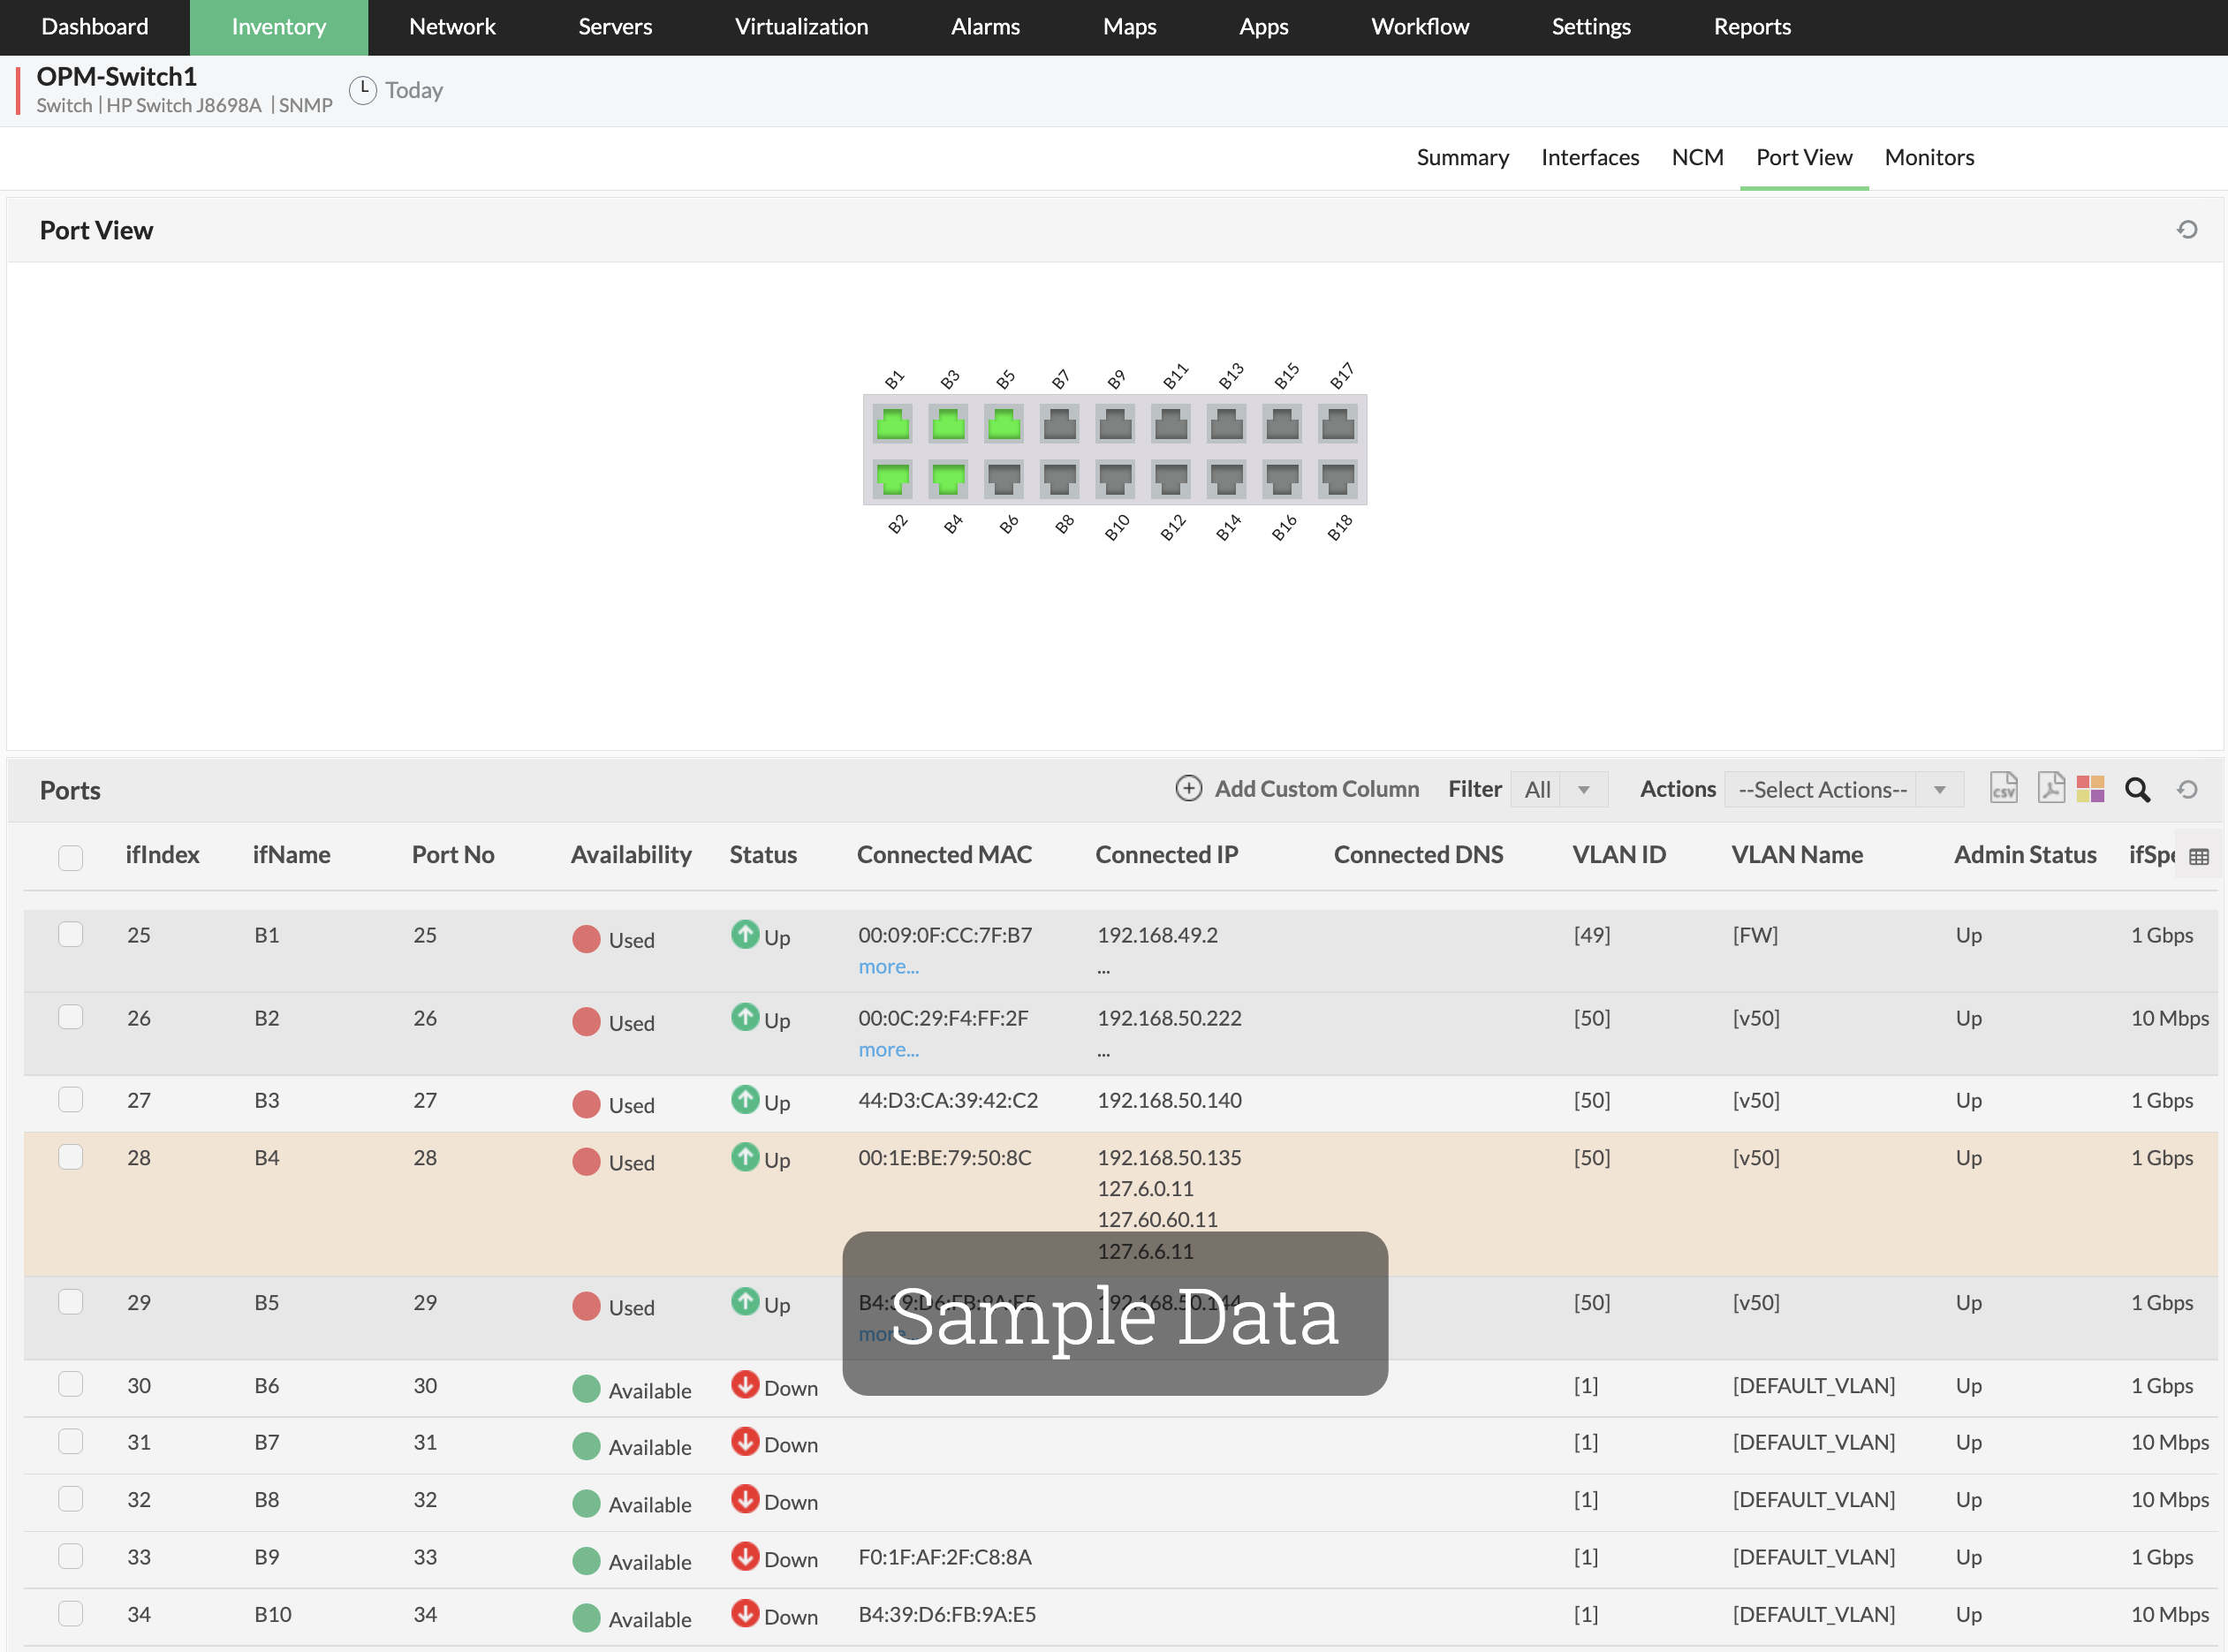
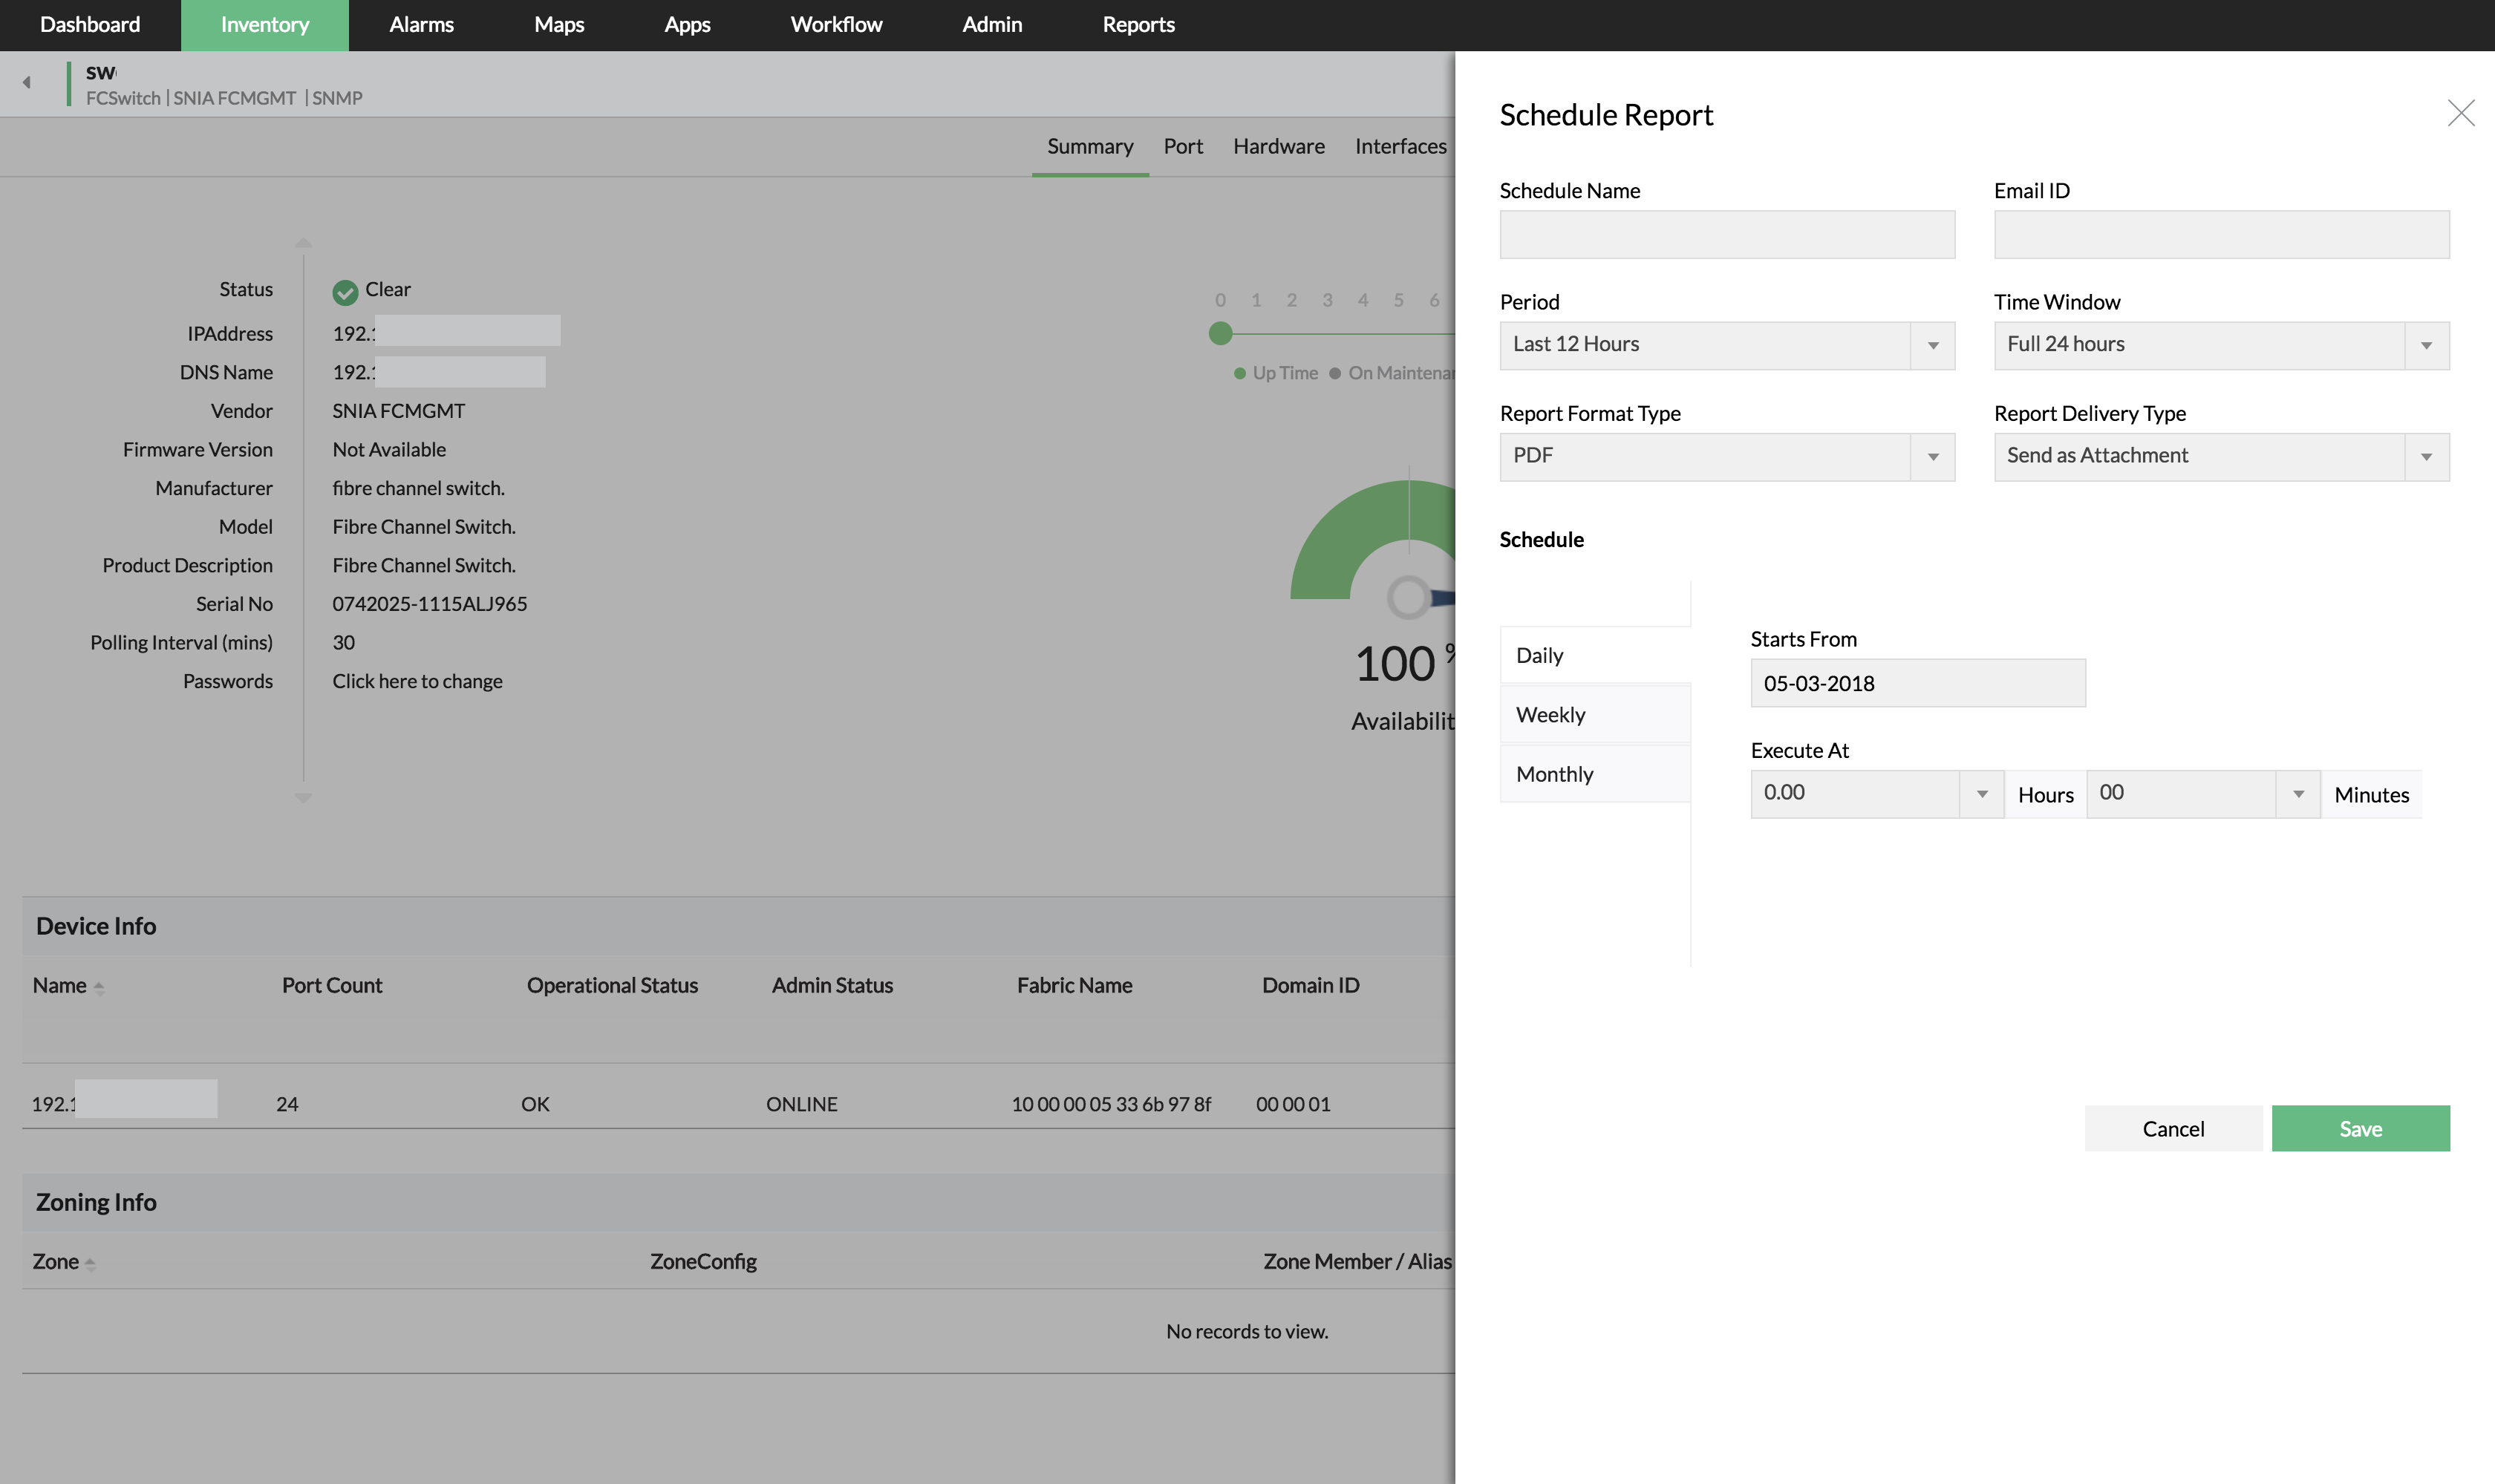
Once the Fabric Switches are discovered, an additional detailed scan is performed to capture the complete set of asset, capacity, performance, and configuration details of the switches.
- Fabric Switches summary
- Switch Port details
- WWN - Interconnect information
- Zoning information
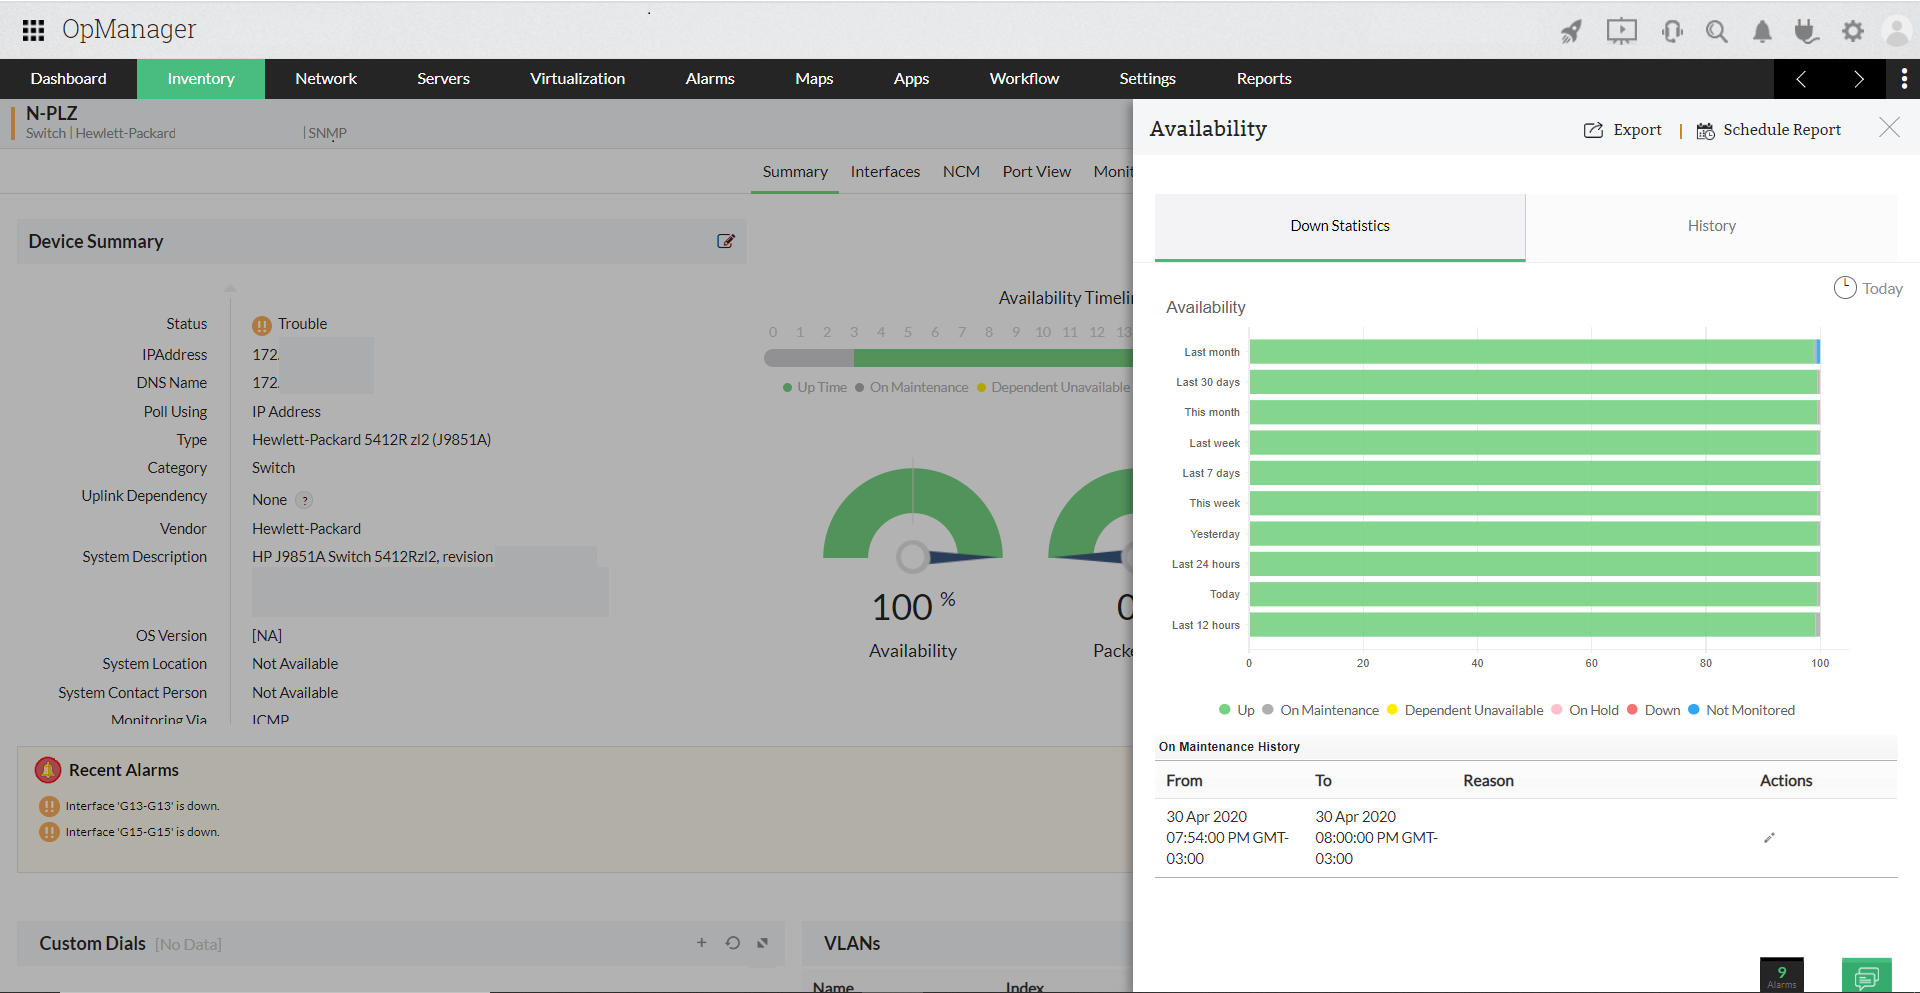
- Switch availability reports
Visualization
- Topological map shows switches and their interconnections.
- Link details table shows link name, source, and destination.
- Color-coded icons depict switch and interconnection status.
- Drill-down views - Switch Sub-map views
Alarm Management
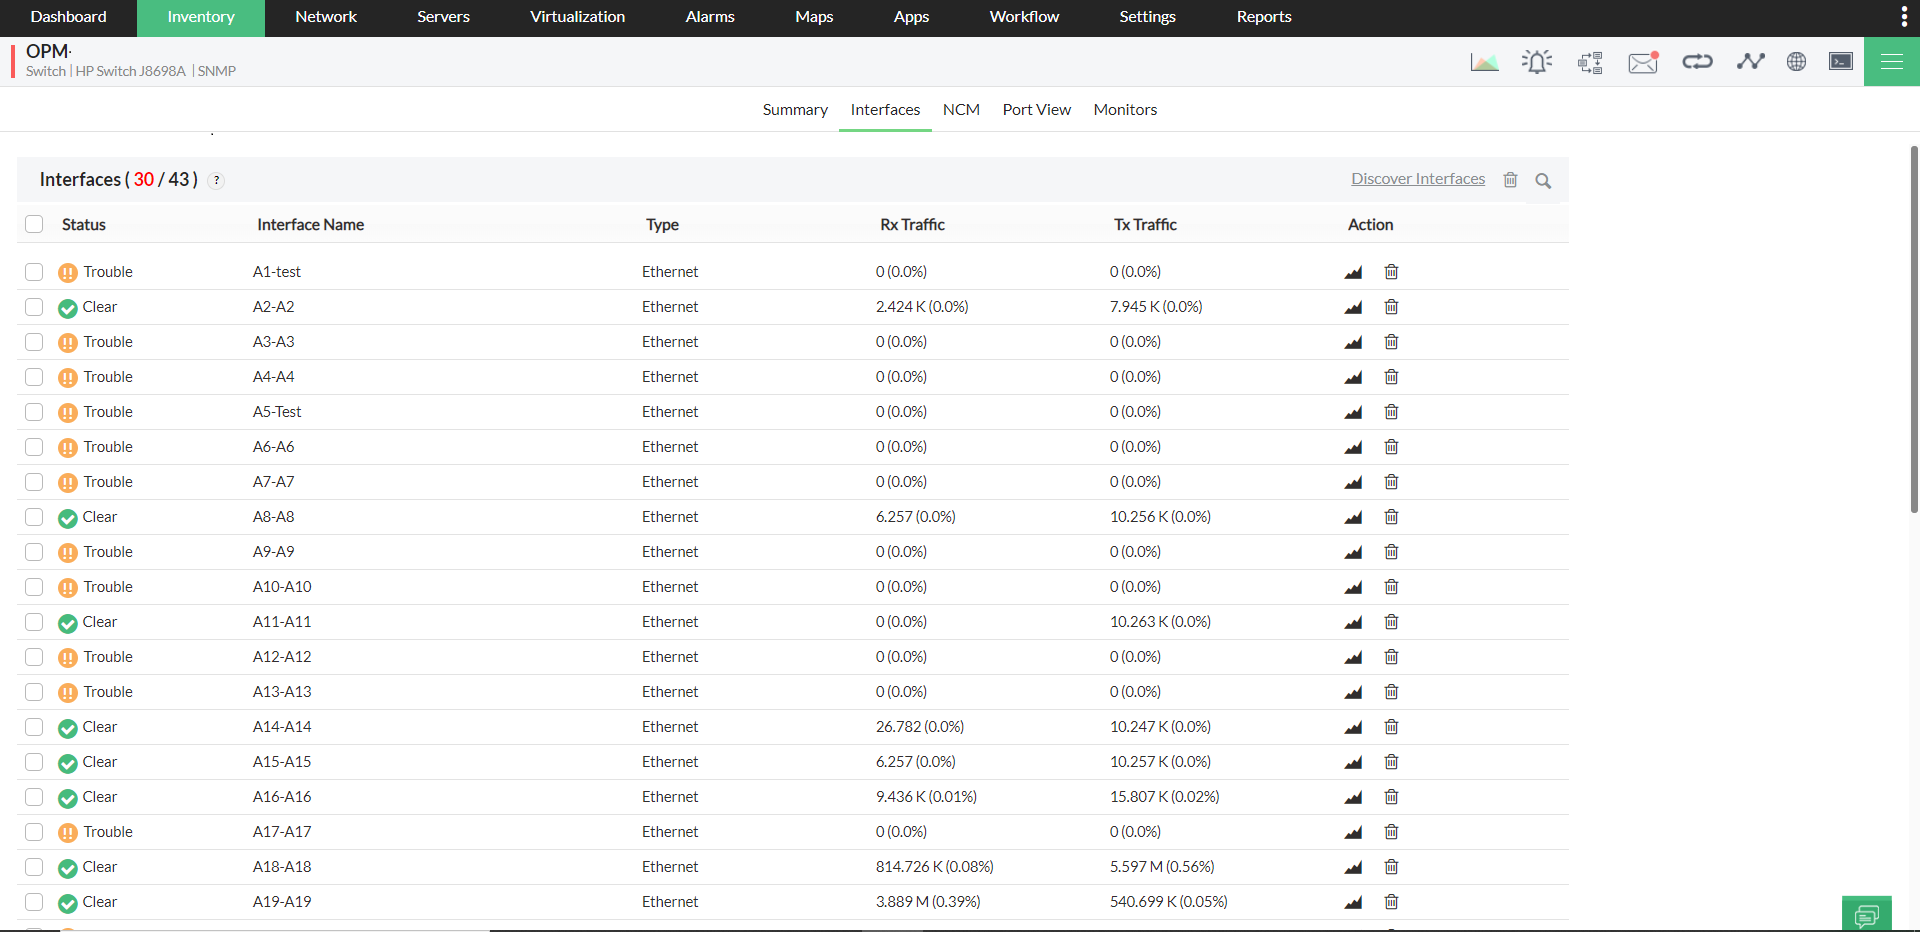
OpManager monitors status of switches and the ports and raises alarms whenever there is a change in the state. SNMP traps from the SAN switch are also captured and appropriate alarm is generated.
- Captures Switch & Port Status Change Notifications.
- Management functions such as assign owner, annotate, clear, and delete.
- Reports alarms to administrators through email or SMS messages based on customizable rules.
- Escalates unattended alarms to higher ups based on pre-defined rules.
Real-time Graphs
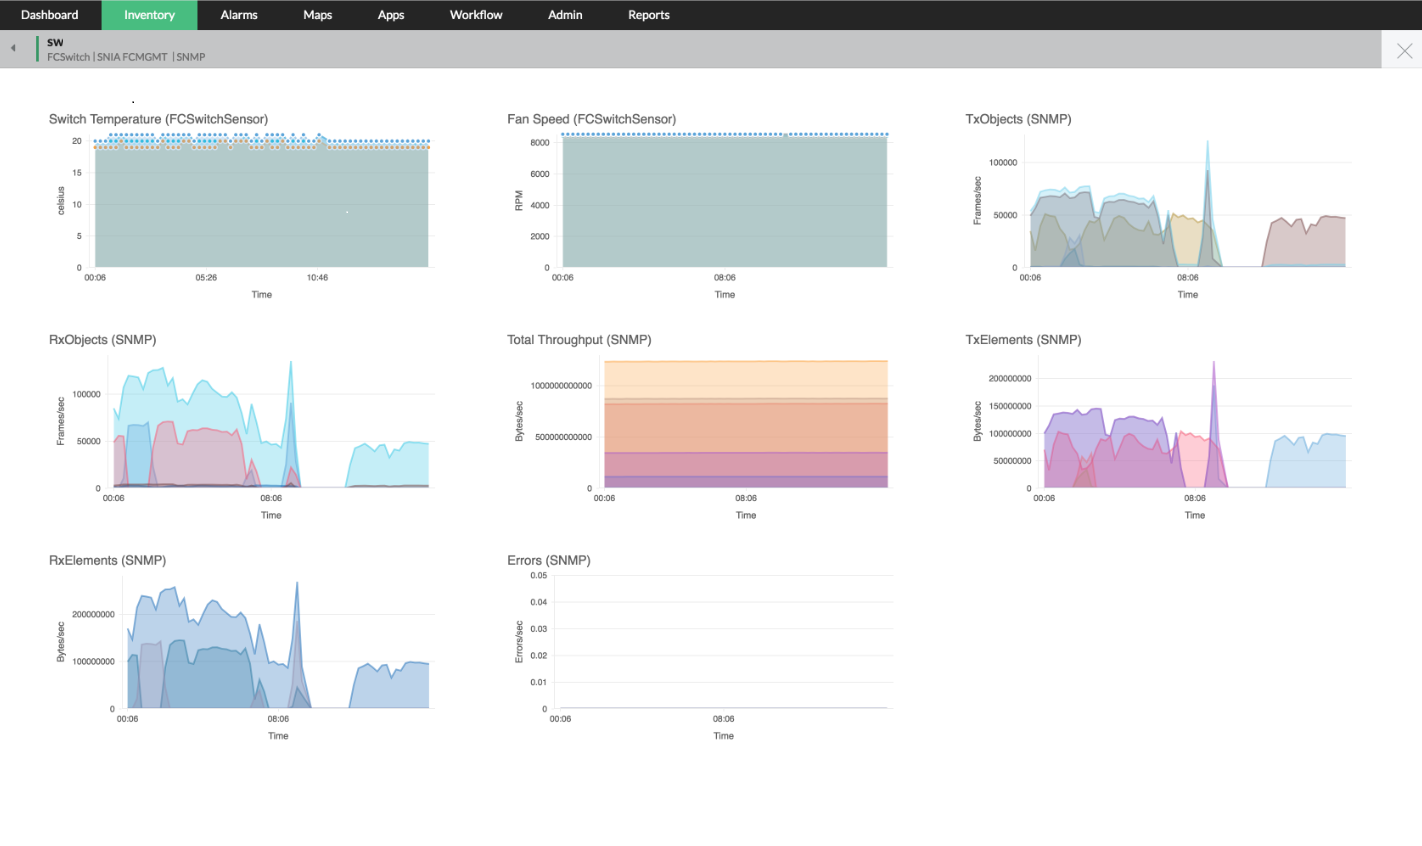
With OpManager, one can perform port level troubleshooting and diagnostics using non-intrusive, SNMP based live graphs capability. Real-time data is collected from the ports and plotted in graphs.
- Closely monitor specific port data live, for brief period, for troubleshooting.
- SNMP based, non-intrusive, Fibre Channel port level data collection.
- Queries the Fibre Channel statistics and graphs each port on the switch.
- Plots graphs with live data.
- Auto refresh GUI to show the update.
Port Performance Reports

The following Port Performance statistics are computed for each port at periodic intervals and reports generated to provide trend analysis.
- Rx Throughput
- Tx Throughput
- Total Throughput
- Rx traffic
- Tx traffic
- Errors
Reports of Top N performing switches / ports and Top N available switches / ports based on the above parameters can also be generated.
Further, comparison reports of ports based on the above parameters are also available.
- Sends daily and weekly alarm reports.
- Helps IT team analyze trends, utilization, etc.
- Reports to identify ports that are over or under utilized.
OpManager supports SAN switches from the following vendors.
- Brocade Silkworm Series
- McData Sphereon Series
- EMC Connectrix Series
- Cisco MDS Series
- QLogic SANbox Series
- HP SAN Switches
- LightSand Switches