Convenient
Scan and draw network maps in minutes. Schedule network scans to update topology changes. Track device and interface status from maps.


Maps provide visibility into the network by representing network components, their performance, and their topology in visually appealing formats. IT teams can combine this visibility with a network monitoring solution to correlate events, detect the root cause of network issues, and maintain their IT infrastructure.
OpManager combines network mapping and monitoring in its unified console for this very reason. You can leverage OpManager's network protocols to automatically scan and map networks, add monitored devices to custom maps, visualize critical network segments, and oversee large networks spread across multiple locations. Let's explore OpManager's network mapping features.
Mapping the LAN
Mapping Data centers
Mapping critical business flows
Mapping WAN links
Mapping virtual networks
Google and Zoho maps in OpManager
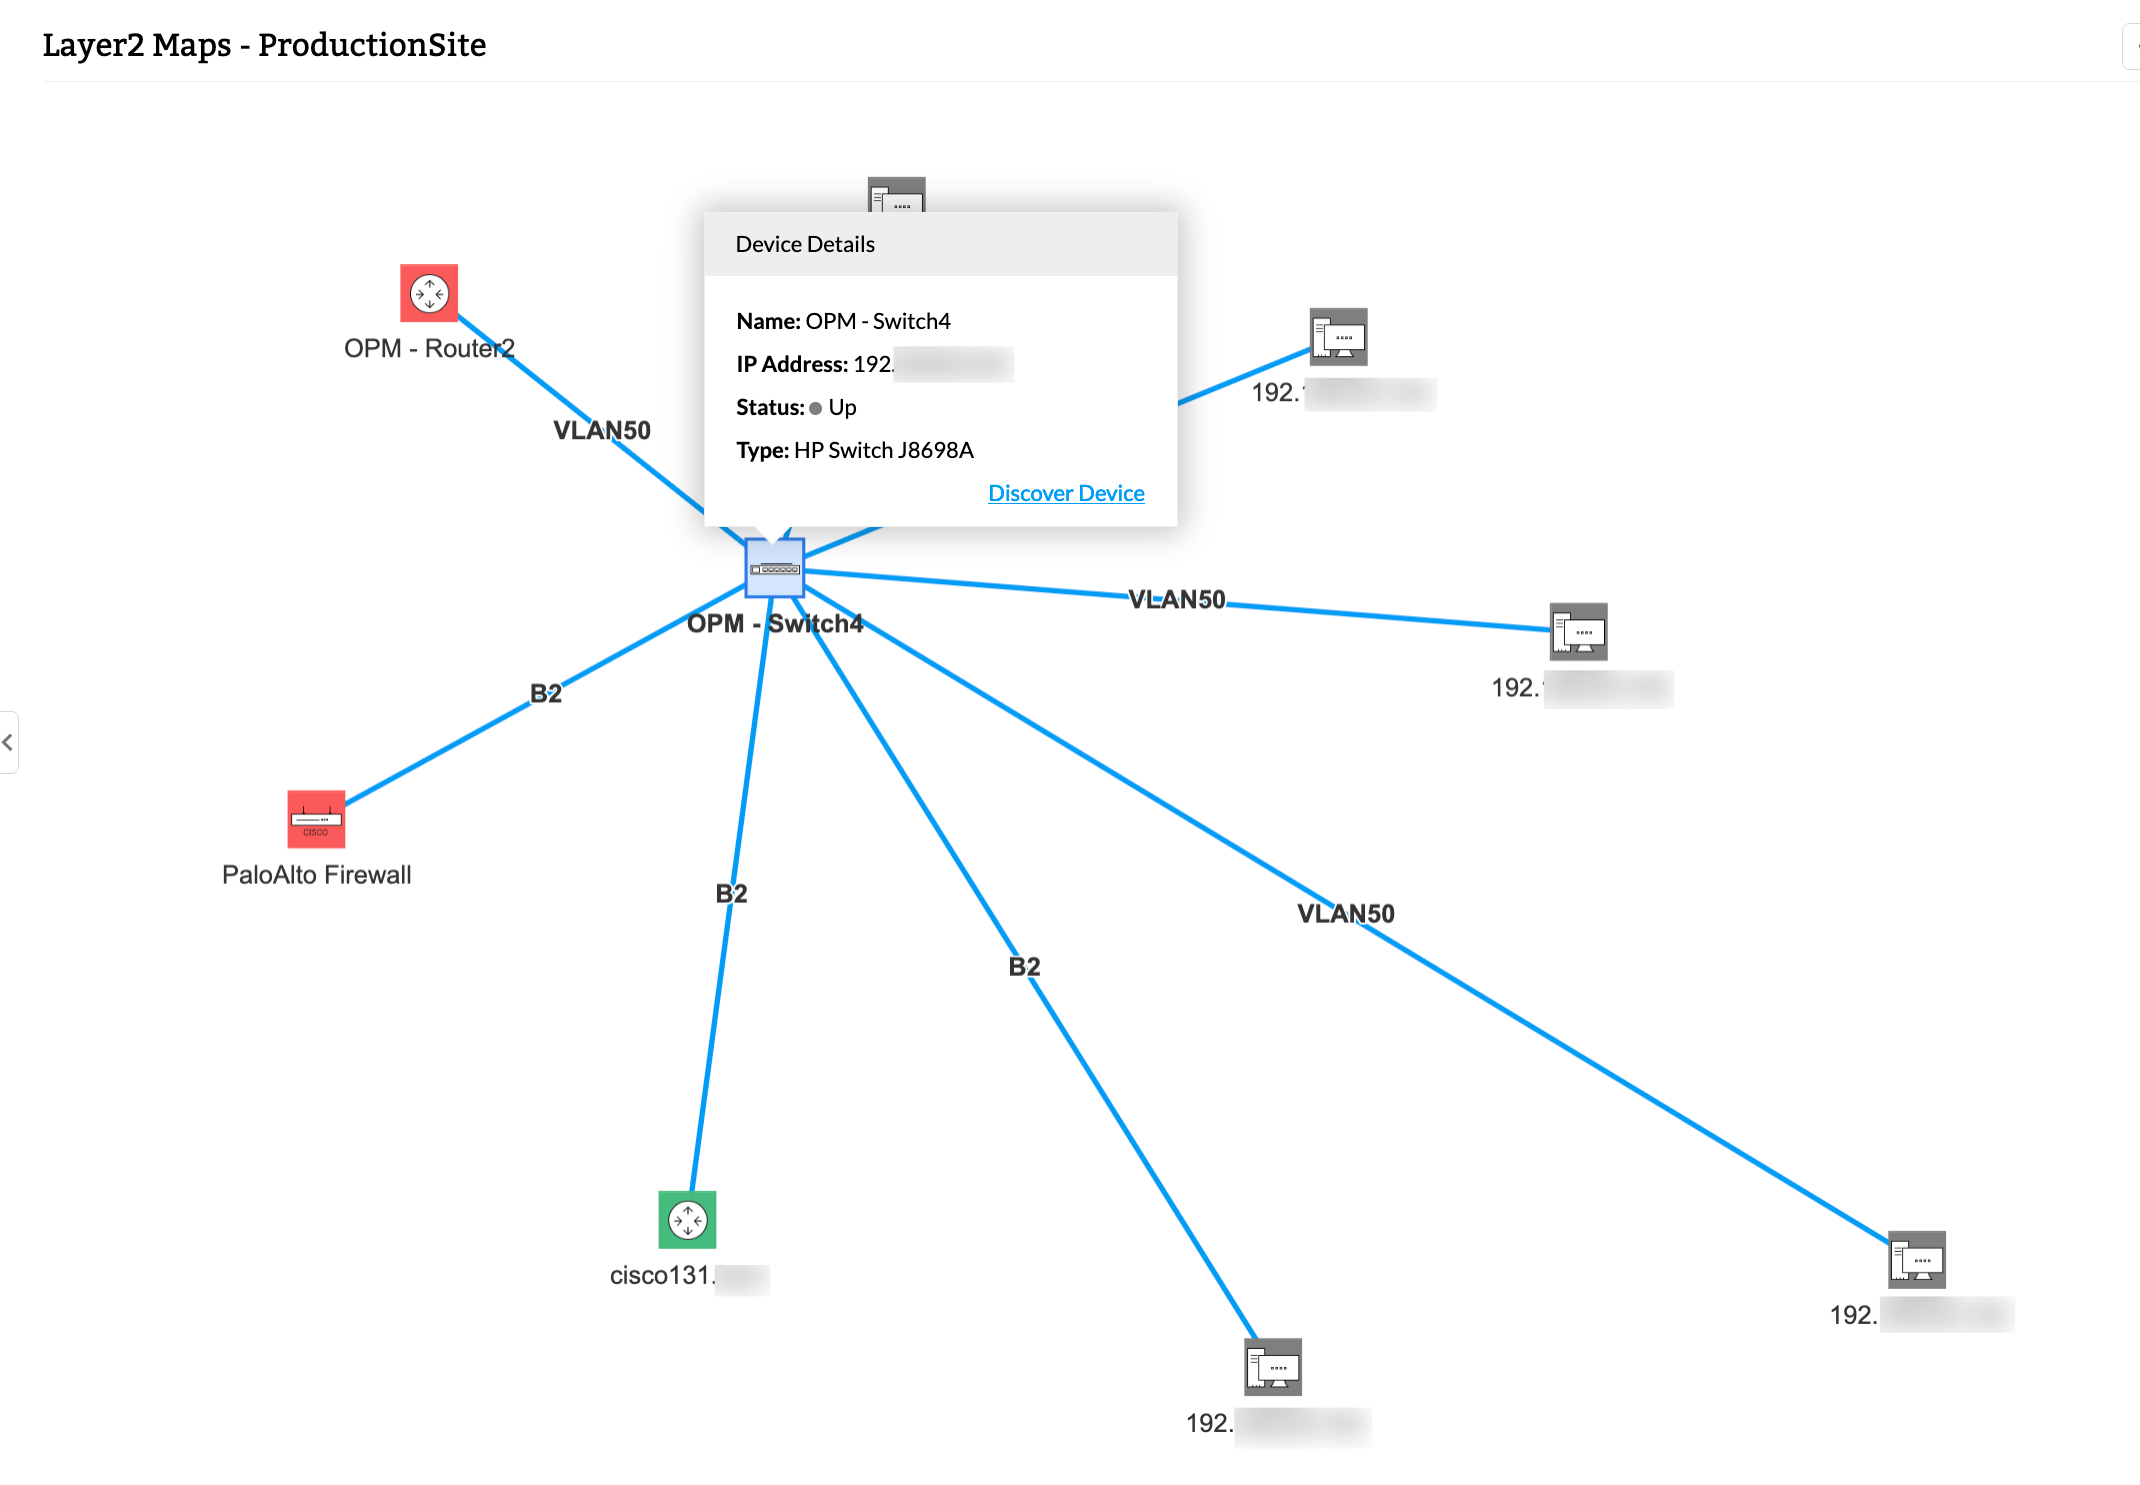
OpManager leverages network protocols like LLDP, FDB, ARP, and CDP to scan and draw your LAN. From a single IP address of a central router, you can scan connected network devices and draw a topology map. You can configure a rediscovery frequency to ensure that the map is updated and set up device dependencies between nodes in the map.
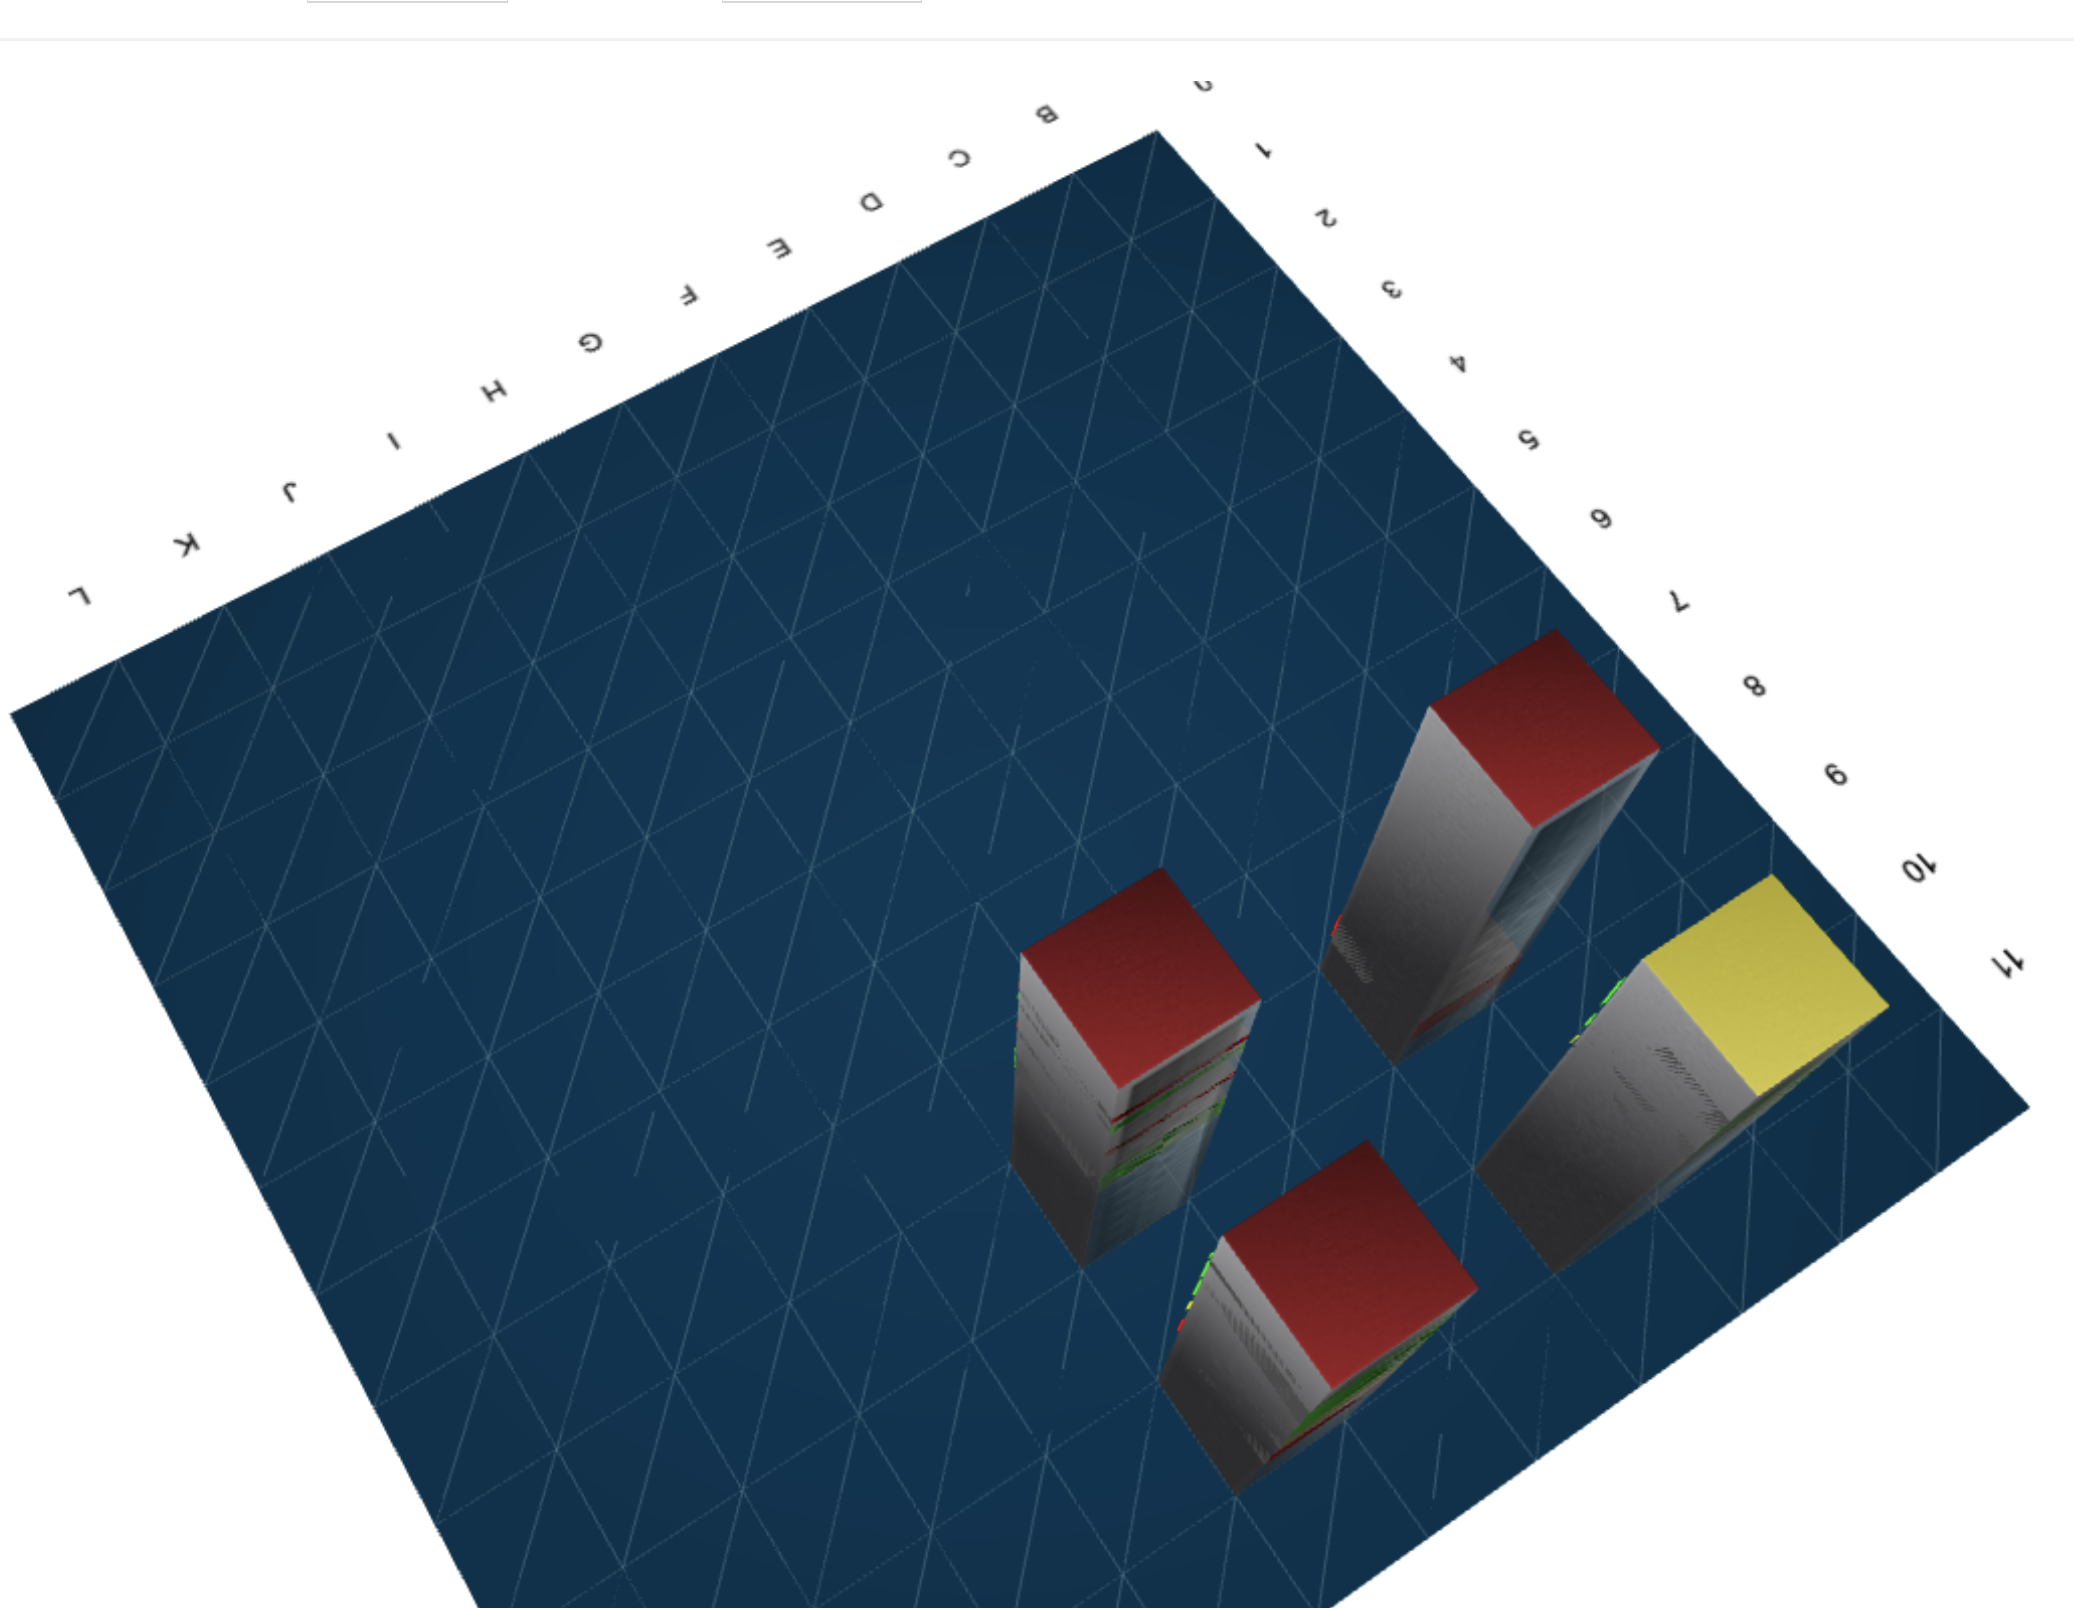
With OpManager, you can visualize your remote data centers using server rack views and 3D floor views. You can add monitored devices to a rack view and add racks to a 3D floor representation of a data center. To direct network technicians from afar, or visualize server racks on-site logically, data center network mapping is beneficial.
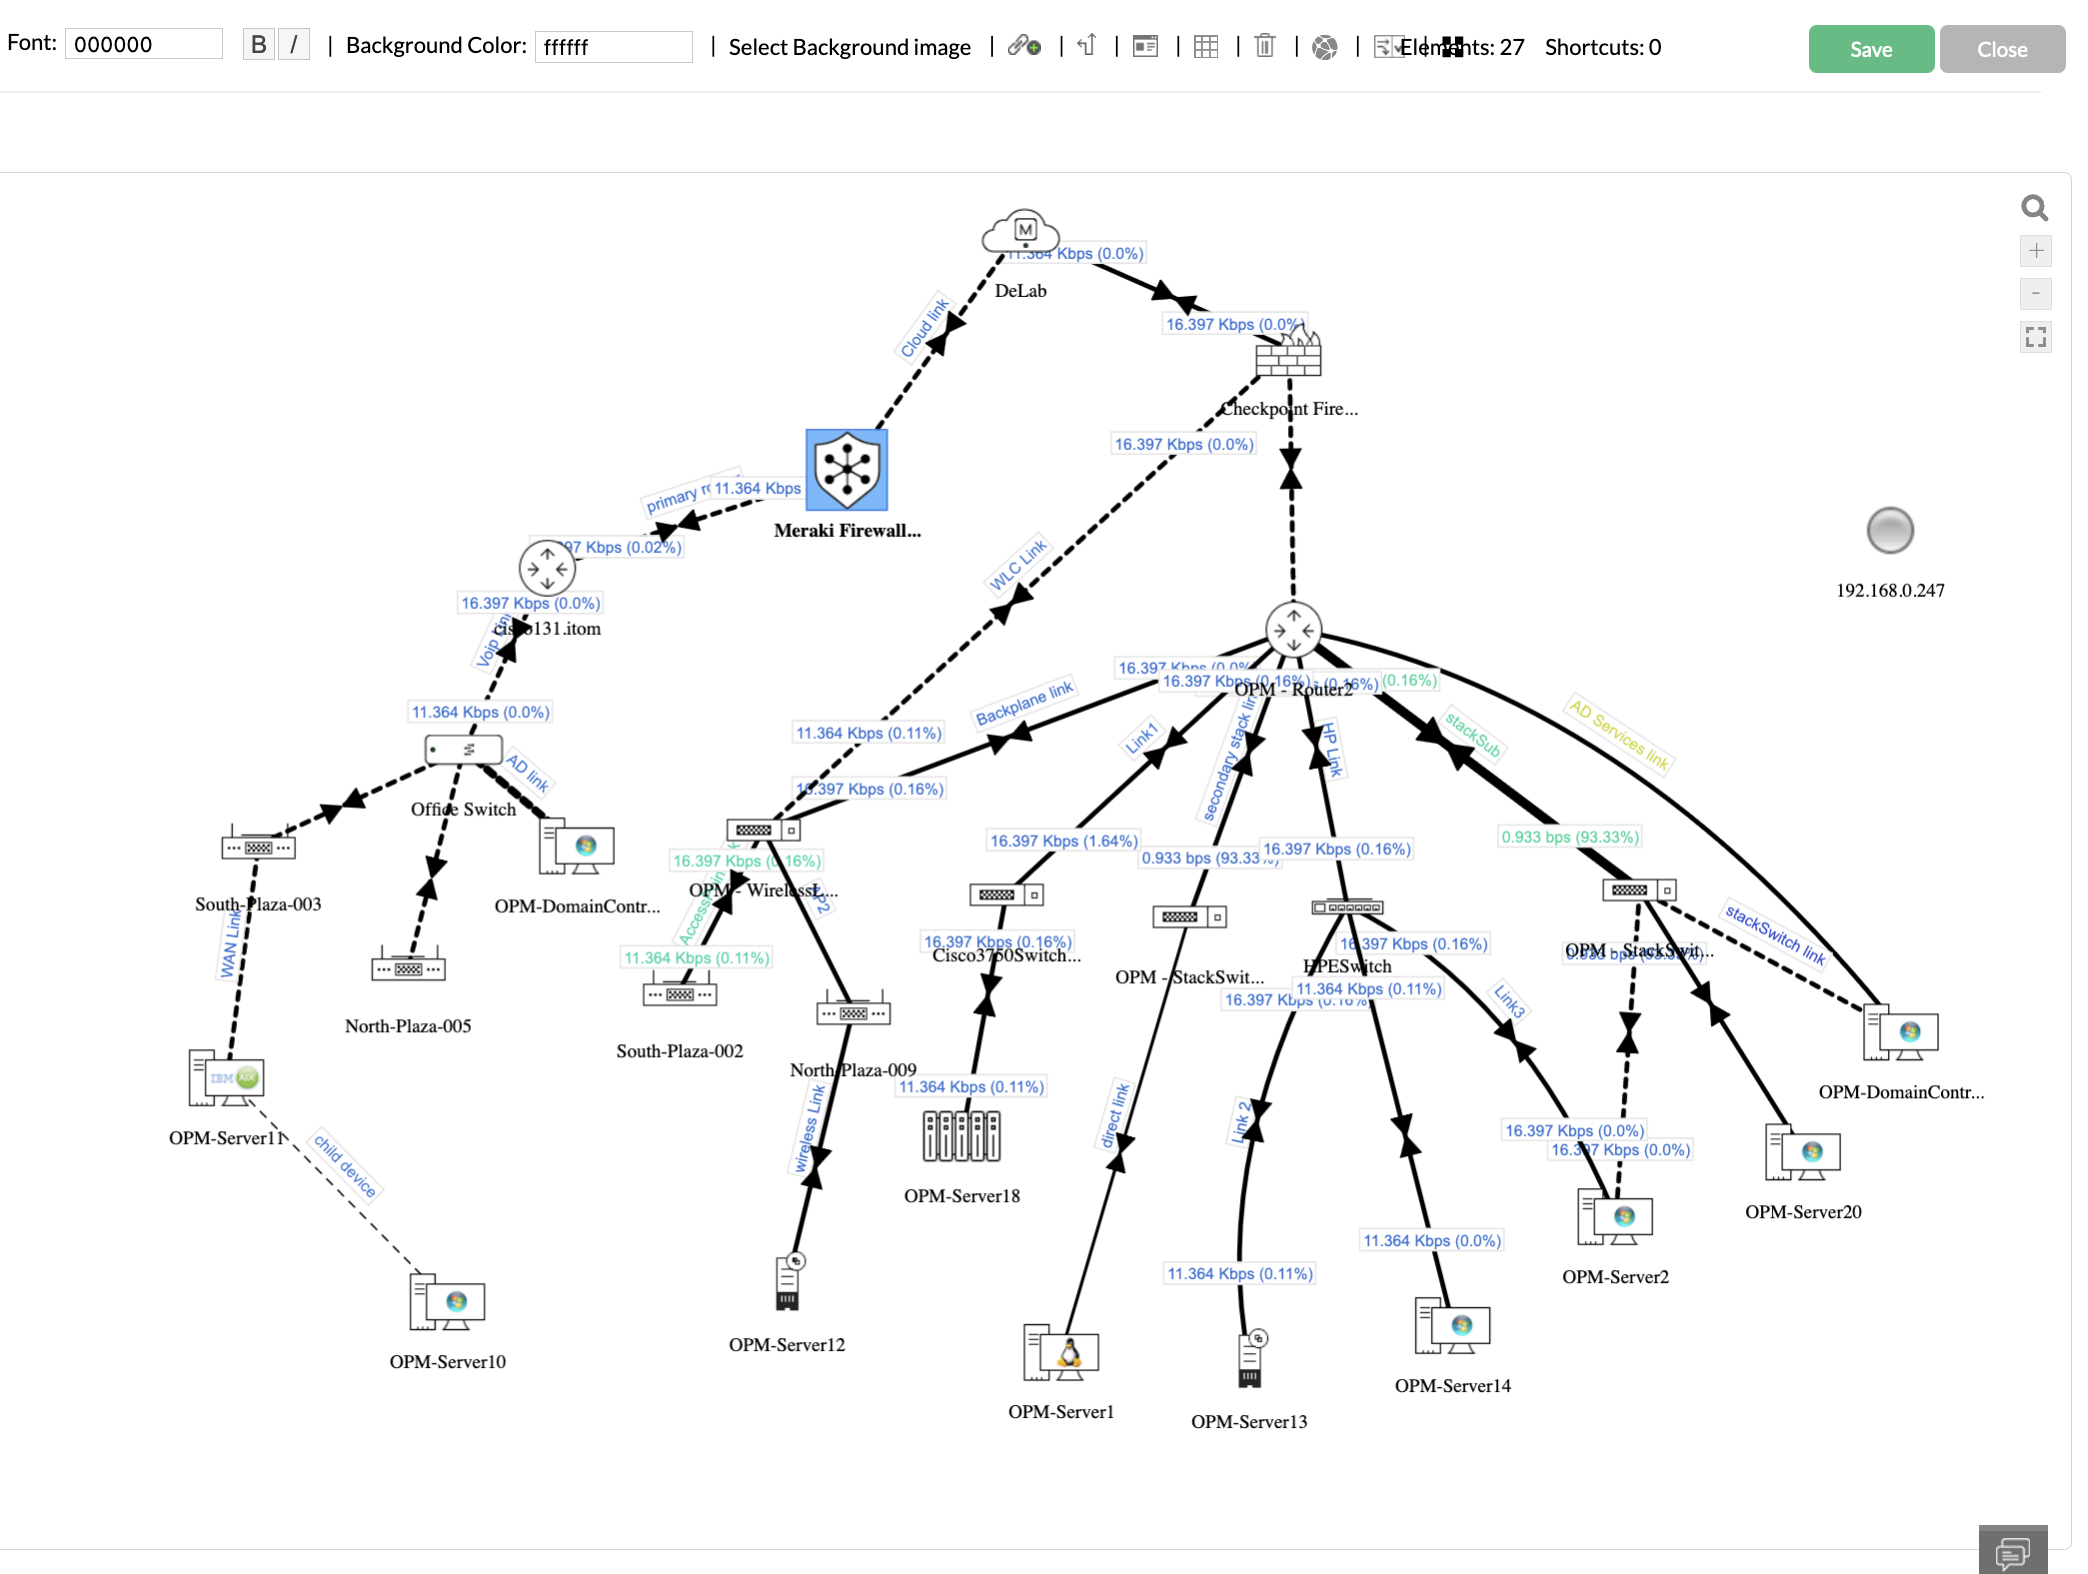
Business views are drag-and-drop maps which can represent your network. Business views can represent devices involved in continent-spanning operations to a layout of your floor or your office. Icons and backgrounds in business views can be personalized to your liking.
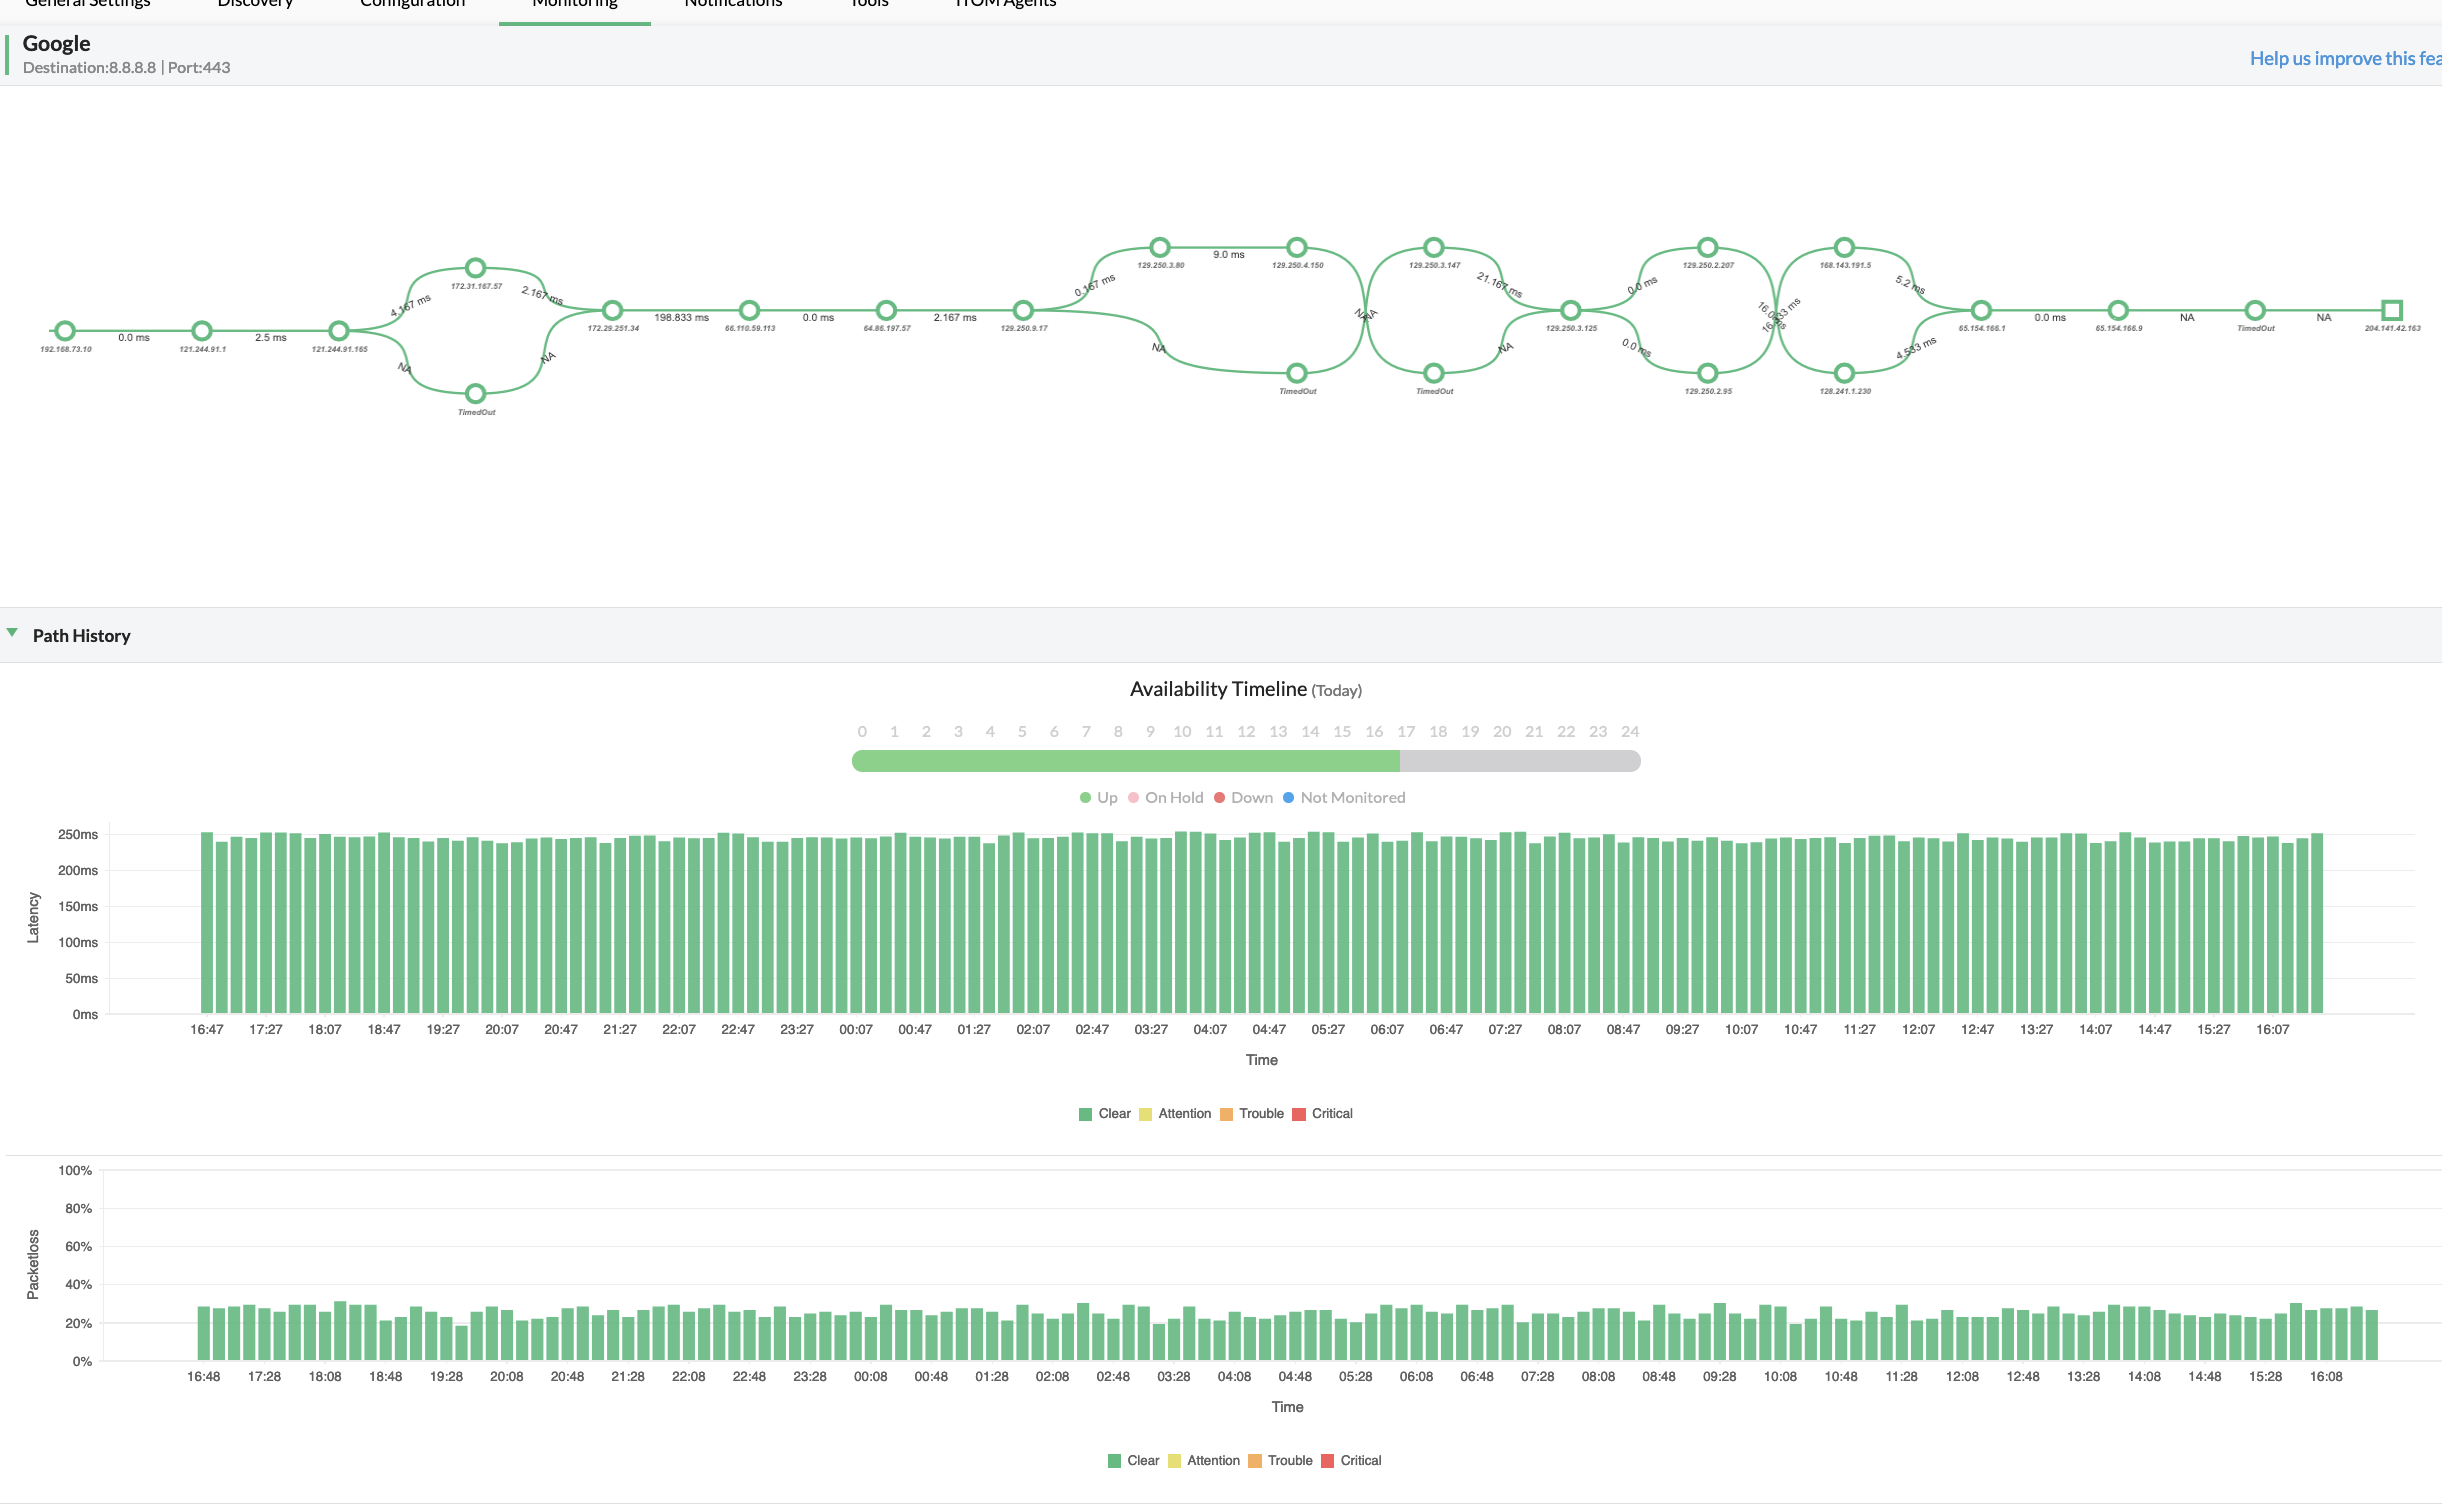
OpManager tracks WAN links with hop-by-hop visibility into each node. You can set alarm threshold limits for packet loss and response time for a network path and get notified of violations. You can also narrow down the exact hop that's causing congestion to optimize WAN performance.
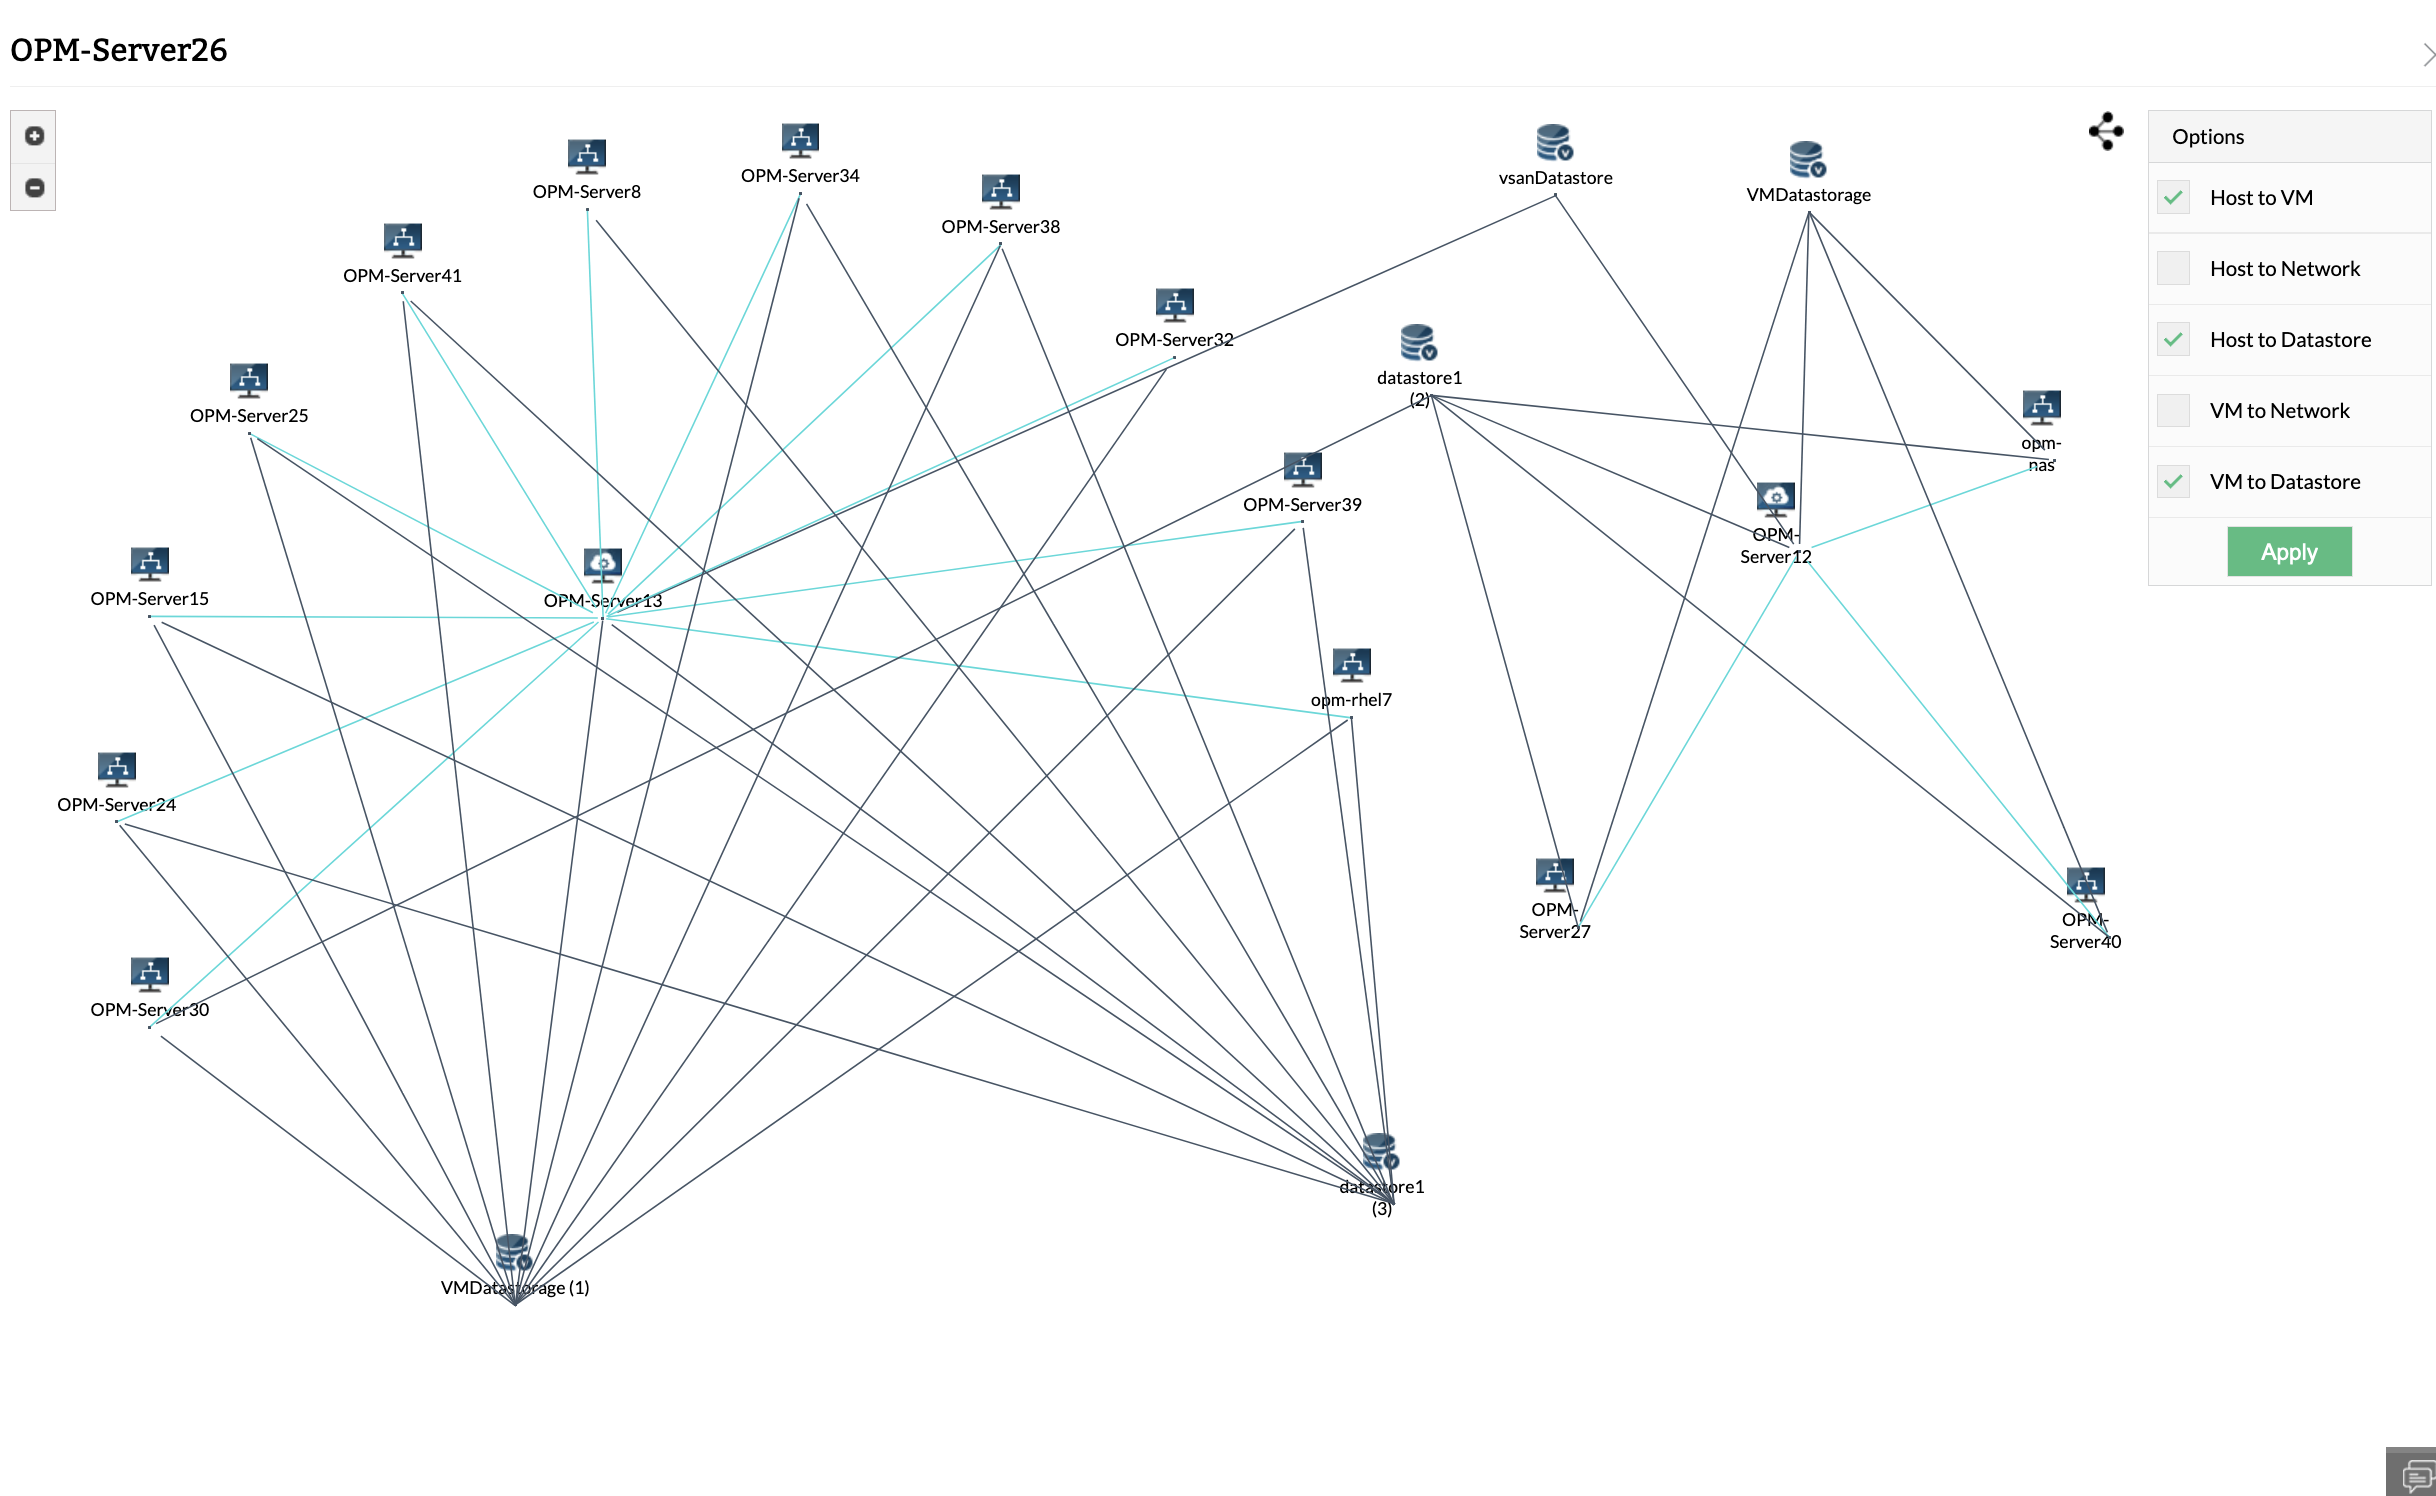
OpManager maps virtual networks for popular virtual vendors like VMware, Nutanix, Hyper-V, and Xen. Virtual maps represent logical and network connections between virtual hosts, VMs, and datastores.
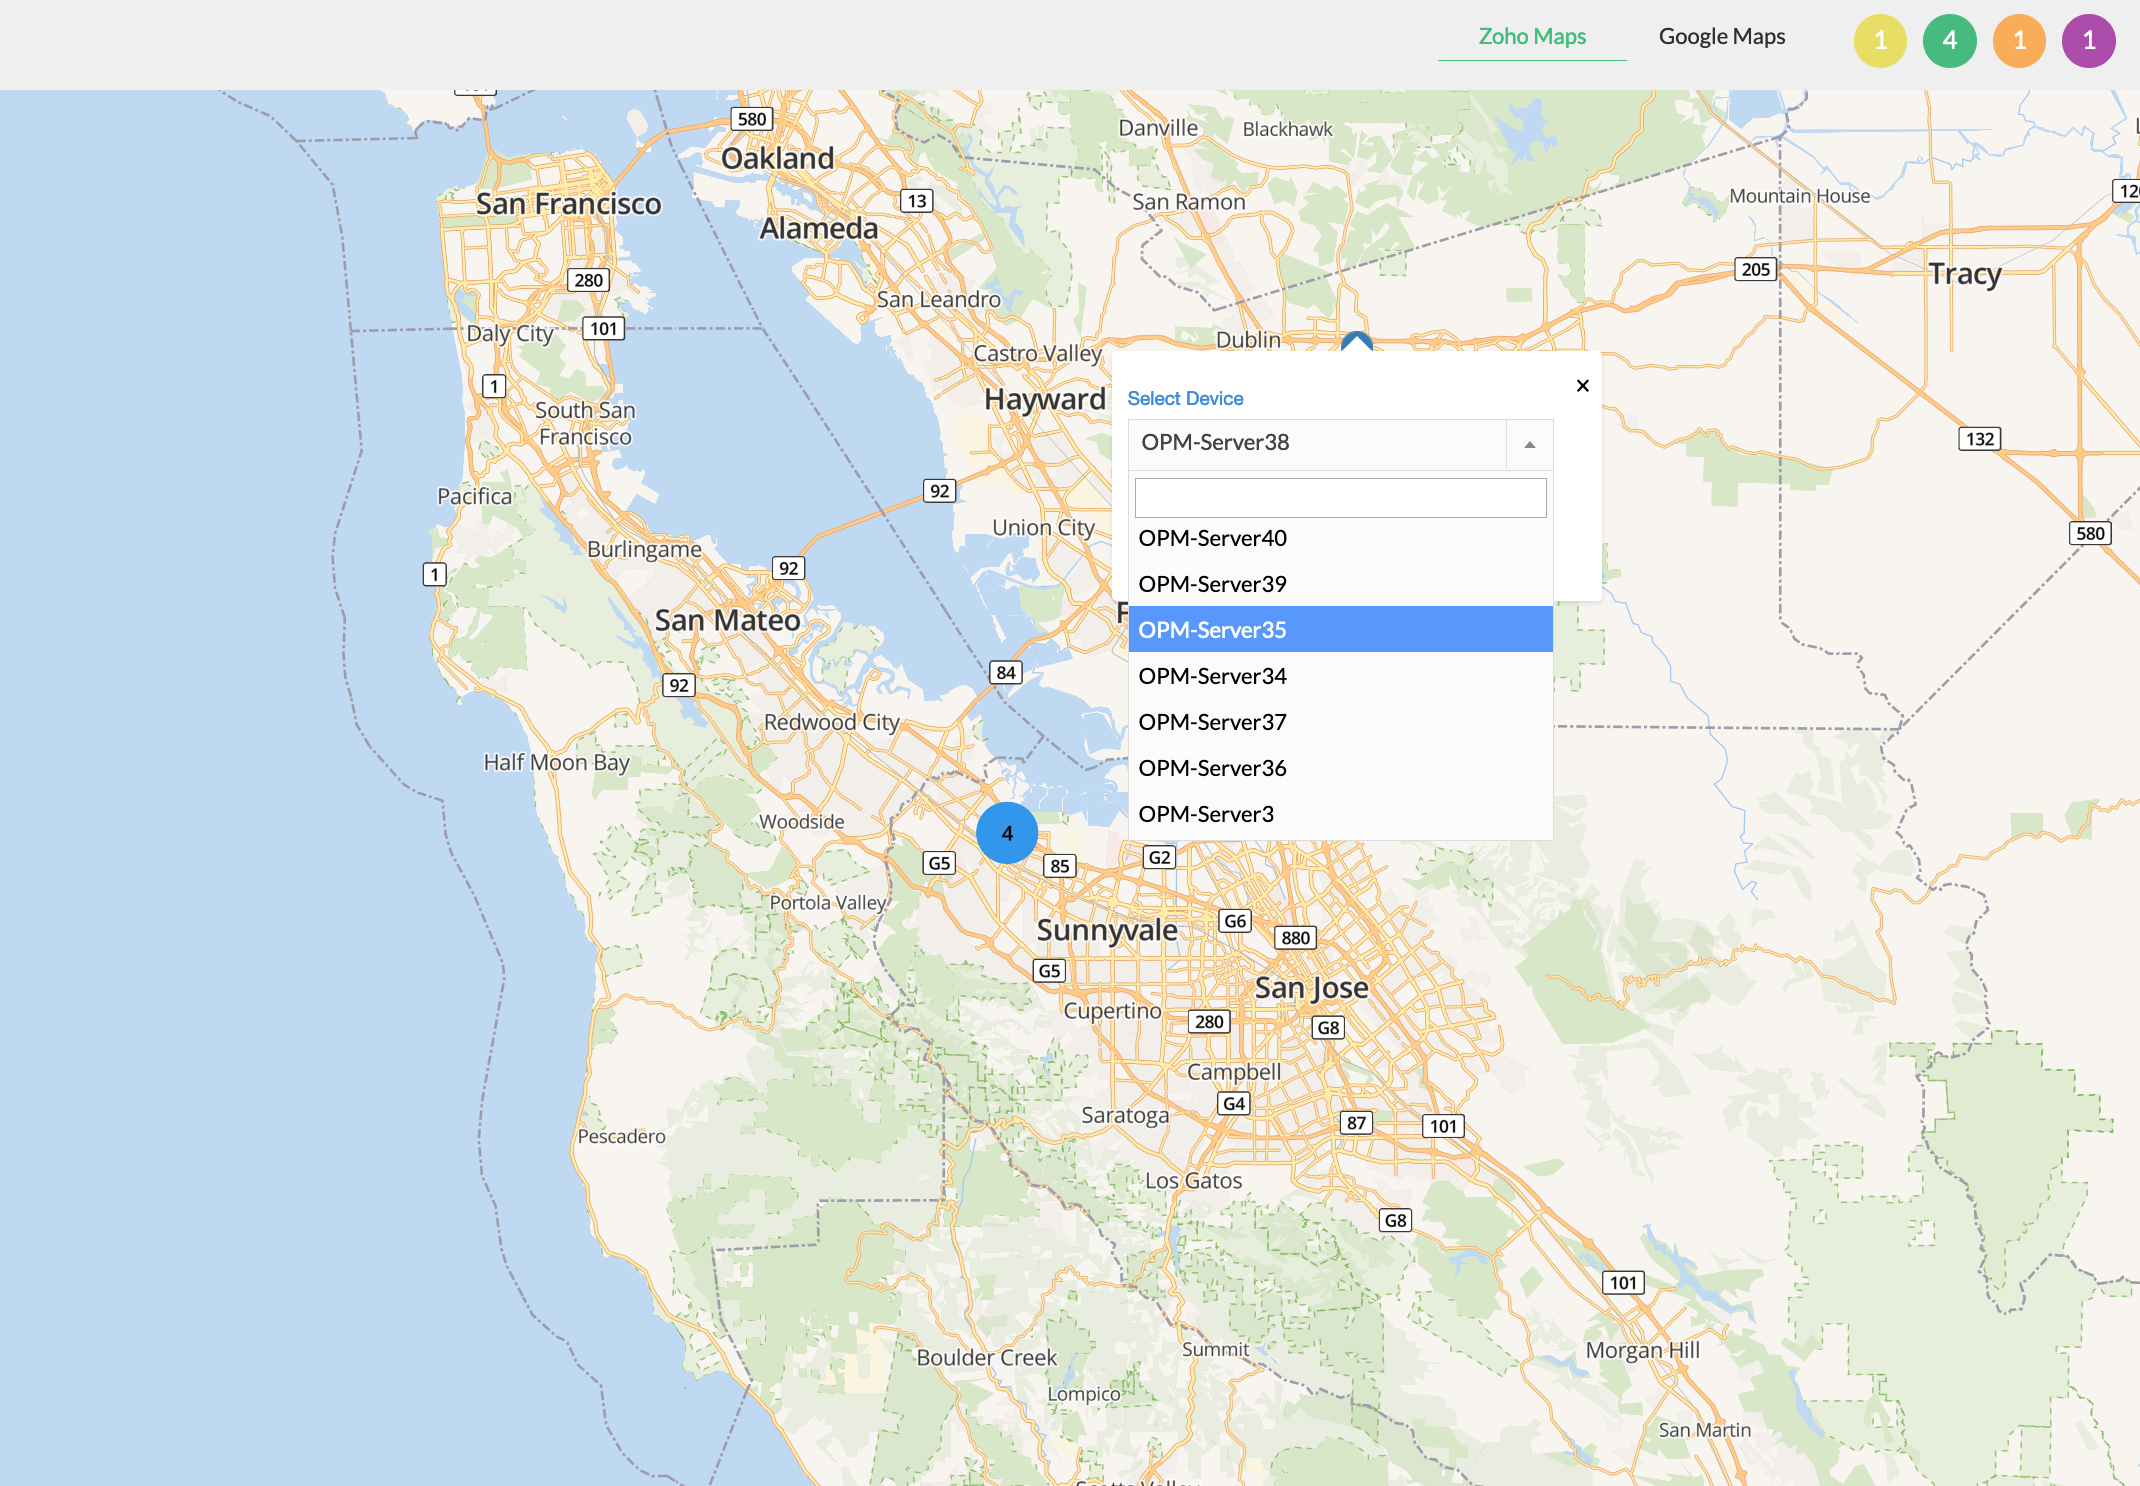
OpManager integrates with Google and Zoho maps to add devices to a responsive map of the world. You can add monitored devices from OpManager to their corresponding locations and get a global overview of your IT infrastructure with insights into their status.
OpManager supports diverse network protocols like SNMP, WMI, CLI, ARP, LLDP, and CDP to discover your IT infrastructure, classify them, and associate identifying data like device type, IP address, vendor, or model. Furthermore, you can add more context by specifying the location of a device or the department it belongs to.
OpManager's maps represent monitored devices in multiple formats for simplified network management. Instead of drawing maps manually, you can scan entire networks from a seed router or drag monitored devices in a mapping interface. performance and uptime statistics are automatically updated.
Monitor the uptime, performance, and health of your network by polling devices at regular intervals. You can drill down from network maps to inspect device performance metrics, enrich maps with useful information, and add maps to dashboards for improved visibility.
Monitored data can be visualized as color-coded graphs to detect dips in performance or unseen bottlenecks. You can also stack graphs to aid in correlating collected metrics from multiple sources. OpManager also features visualization tools like heatmaps, dials, reports, and widgets that aid with fault resolution.

Get wholesale visibility into enterprise IT infrastructure consisting of thousands of devices

Create CCTV views for critical infrastructure components and monitor them from network operations centers (NOC)

Get visibility into the status, performance, and resource utilization of virtualized environments

Track wireless LAN controllers, access points, detect rogue users, monitor signal strength, and more from a single dashboard.

Track the capacity, utilization, and trends of storage resources across your IT infrastructure

Track the health, performance, and status of Cisco Meraki networks and devices across multiple sites
Enterprise dashboard
NOC view
Virtualization dashboard
Wireless dashboard
Storage dashboard
Network performance dashboard
Scan and draw network maps in minutes. Schedule network scans to update topology changes. Track device and interface status from maps.
Create maps to suit your needs. OpManager maps layer 2 networks, interfaces, layer 3 paths, virtual, and physical environments.
Sync OpManager with CMDB and ITSM tools. OpManager's layer 2 maps can sync with ServiceDesk Plus' maps for easier IT asset management.
Create maps effortlessly. Drag and drop devices, set device icons and backgrounds, and add devices from your monitoring inventory.
Leverage 10,000+ device templates to automatically detect and classify device types. Leverage graphs, reports, and widgets to keep tabs on these devices.


