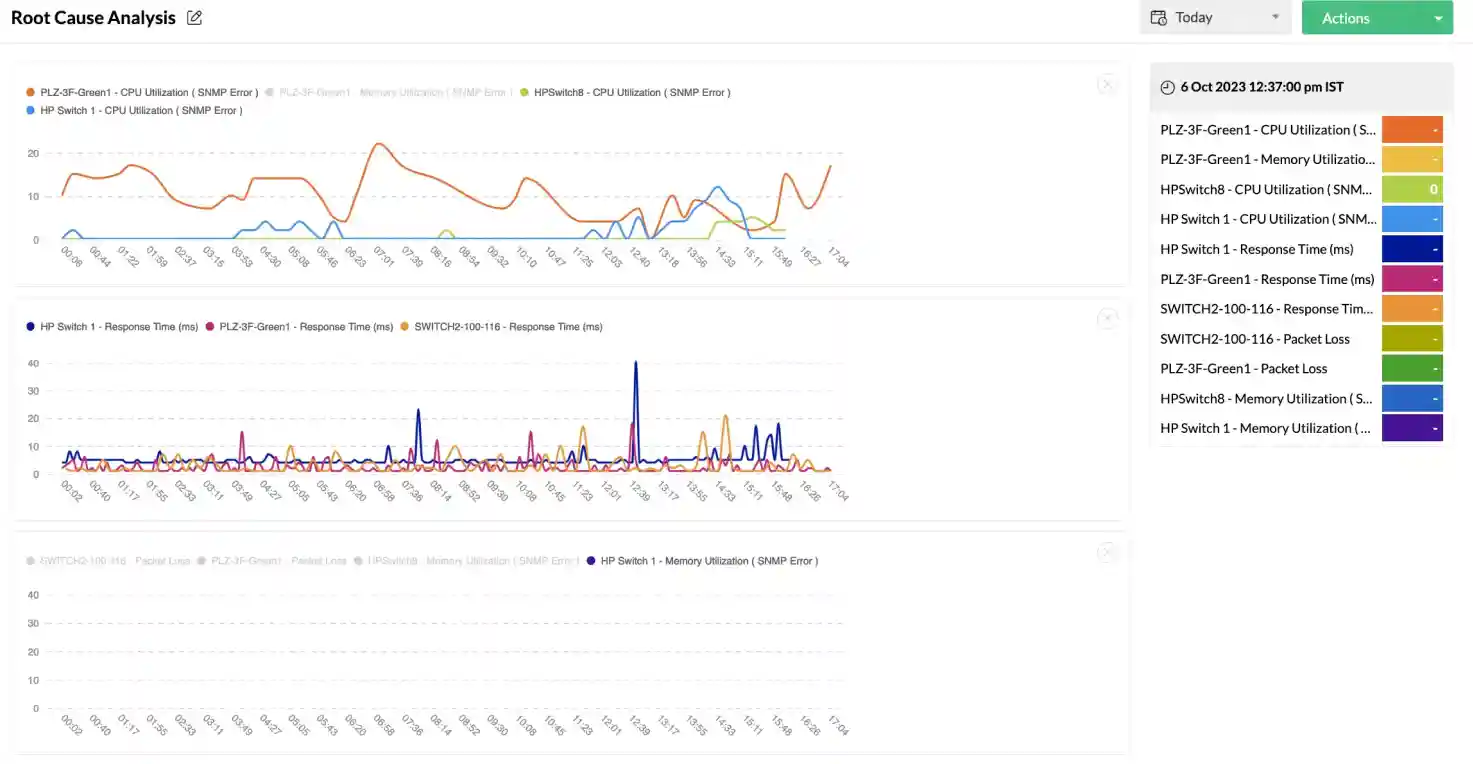
1 Million and Counting
Saint Gobain
NASA
Time Warner Cable
Loreal Paris
Siemens
DHL

Network performance monitoring with OpManager: A quick walk-through

  • Network devices
  • Wireless devices
  • IPSLA
  • SDN & Virtualization
Router
 

Monitor packet loss, response time, buffer, CPU and memory, traffic utilization, and hardware health of your router devices. OpManager can also track network topology changes from seed router devices.

Switch
 

Monitor packet loss, response time, buffer, CPU and memory, traffic utilization, and hardware health of your network switches. You can also monitor and map switch ports and track network congestion within your LAN.

Firewall
 

Keep tabs on the firewalls in your network by monitoring traffic, firewall health, configuration changes, connected users, hardware health, VPN connections etc. You can also set monitors for critical firewalls services and get alerts when they go down.

Printer
 

Monitor the printers in your network for health, availability, traffic, and printer specific metrics like toner level, pages printed, tray status, etc.

Router
Switch
Firewall
Printer
Wireless LAN controller
 

Manage wireless networks from the top down by monitoring wireless LAN controllers devices. OpManager helps you monitor WLC health, connected users, traffic utilization, SSIDs, rogue SSIDs, and access point health.

Wireless access point
 

Monitor the health and availability of each access point in your wireless network. Keep track of access point health, signal strength, configuration changes and more.

Cisco Meraki controller
 

Get complete visibility into your Cisco Meraki infrastructure including Meraki radios, Meraki switches, Meraki firewalls, Meraki vision, and Meraki gateway. You can also monitor the network performance of distributed Meraki wireless networks.

Wireless LAN Controller
Wireless Access Point
Cisco Meraki Controller
VoIP
 

Monitor voice over IP (VoIP) calls by synthesizing traffic using Cisco IPSLA technology. OpManager monitors call quality metrics like jitter, mean opinion score, and latency and alerts you when your thresholds get violated. OpManager also features VoIP reports to track and visualize VoIP performance.

WAN
 

OpManager can monitor WAN performance using Cisco IPSLA technology. OpManager synthesizes traffic between two links in the WAN and monitors key metrics like round-trip time and availability. This aids IT teams in maintaining SLA terms.

VoIP
WAN
Cisco ACI
 

Discover and monitor Cisco ACI SDN network topology, tenants, fabrics and endpoint groups with health score, uptime, and topology maps.

RAID
 

Monitor the performance of your RAID arrays, disks, logical storage units with metrics like throughput, capacity, and traffic usage. You can also monitor the physical health of your storage disks and port status.

Virtual servers
 

OpManager features an extensive list of metrics to monitor virtual hosts, servers, and data stores from popular vendors like VMware, Nutanix, Hyper-V, and Xen.

Cisco ACI
RAID
Virtual Servers

AI powered network performance monitoring

Monitoring large network infrastructures takes up a ton of manual effort. Especially in calculating where to set thresholds and to perform capacity planning. OpManager has a powerful ML engine and advanced AI algorithms to get the job done.

Forecast reports

Forecast the number of days network resources such as storage, CPU, or memory will last using historic data.

Forecasting performance trends

Forecast trends for the future for monitored performance metrics such as network traffic or memory utilization.

Adaptive thresholds

Detect abnormal network activity automatically by studying historic network activity and setting relevant alert thresholds for performance indicators.

AI powered network performance monitoring

Network performance analysis and visualization

IT teams have the added responsibility of performing network diagnostics and root cause analysis in addition to preventing network downtime. OpManager has an arsenal of network maps, off-the-shelf reports, and visualization tools to aid them in this.

Extensive report templates

OpManager has over 100 report templates covering each part of your IT infrastructure. You can schedule, automate, customize, and set rules for reports to get insights into network performance.

Network path analysis

Narrow down the node that's causing slowness in your WAN links with a hop-by-hop visualization. You can also monitor packet loss and response times for each node.

Network topology mapping

Map and monitor network topology from a core/seed router. OpManager discovers the network topology and updates any changes automatically.

Network performance analysis and visualization

Resolving network performance issues with OpManager

Generally, resolving network issues is a tedious task that costs IT teams a lot of time and effort. With OpManager, you have data correlation features to ease root-cause analysis and workflows to automate repetitive and routine tasks.

Root cause analysis

Given the many devices involved and the metrics measured, correlating data to track down the root cause of a performance issue can be a tough task. Root cause analysis profiles simplify this by stacking performance graphs on top of each other and side by side.

Root cause analysis
Automated workflows

Automated workflows

Performing troubleshooting and maintenance tasks can be time-consuming, especially if the tasks are repetitive and routine. Workflows in OpManager have over 70 actions which can be sequentially triggered to automate critical tasks like testing and restarting services, performing device checks, or running scripts.

5 reasons to choose OpManager as your network performance monitor

5 reasons to choose OpManager
  • Convenient: Deploys in minutes
  • Versatile: Monitors any network device
  • Intelligent: Leverages AI and ML analysis
  • Effortless: Has powerful automation features
  • Secure: Uses the latest authentication and encryption tools

Comprehensive network performance monitoring in one fell swoop!

Loved by customers all over the world


“Easy Implementation, Excellent support & Lower Cost Tool - Team Lead, IT Services Industry”

Reviewer Role: Infrastructure and Operations

Company size: 500M - 1B USD

We have been using OpManager since 2011 and our overall experience has been excellent. The tool plays a vital role in providing the value to our organization and to the customers we are supporting. The support is excellent and staff takes full responsibilities in resolving the issues. Innovation is never stopping and clearly visible with newer versions.

“OpManager - 10 steps ahead of the competition, one step away from being unequaled - Network Services Manager, Government Organization”

Reviewer Role: Infrastructure and Operations

Company size: 5,000 - 50,000 Employees

I have a long standing relationship with ManageEngine. OpManager has always missed one or two features that would make it truly the best tool on the market, but over it is the most comprehensive and easy to use the product on the market.

“Easy Implementation with a feature rich catalogue, support has some room for improvement - NOC Manager, IT Services Industry”

Reviewer Role: Program and Portfolio Management

Company size: 500M - 1B USD

The vendor has been supportive during the implementation & POC phases providing trial licenses. Feature requests and feedbacks is usually acted upon swiftly. There was sufficient vendor support during the implementation phase. After deployment, the support is more than adequate, where the vendor could make some improvements.

“Great Monitoring tool - CIO in Finance Industry”

Reviewer Role: CIO

Company size: 1B - 3B USD

ManageEngine provides a suite of tools that have made improvements to the availability of our internal applications. From monitoring, management and alerting, we have been able to peak performance within our data center.

“Simple Implementation, Easy To Use. Very Intuitive. - Principle Engineer in IT Services”

Reviewer Role: Enterprise Architecture and Technology Innovation

Company size: 250M - 500M USD


ManageEngine support was responsive to all our queries.

Capterra
Getapp
Software Advice
G2
Altaleb Alshenqiti

“OpManager helps me monitor all aspects of the data-center and equipment like servers, switches and routers. It is fast, intuitive and centralized and you do not need to be an expert to deal with OpManager.”

Altaleb Alshenqiti

NGHA

Donald Stewart

“Donald Stewart, IT Manager of Crest Industries is happy with ManageEngine OpManager for its end-to-end network monitoring software. It is easy-to-use and offers fault and performance management for router.”

Donald Stewart

IT Manager, Crest Industries

John Rosser

“John Rosser, MIS Manager of Yale Chase talks about the proactive nature of ManageEngine OpManager & how his organisation gained value from it.”

John Rosser

MIS Manager

 
 Pricing  Get Quote