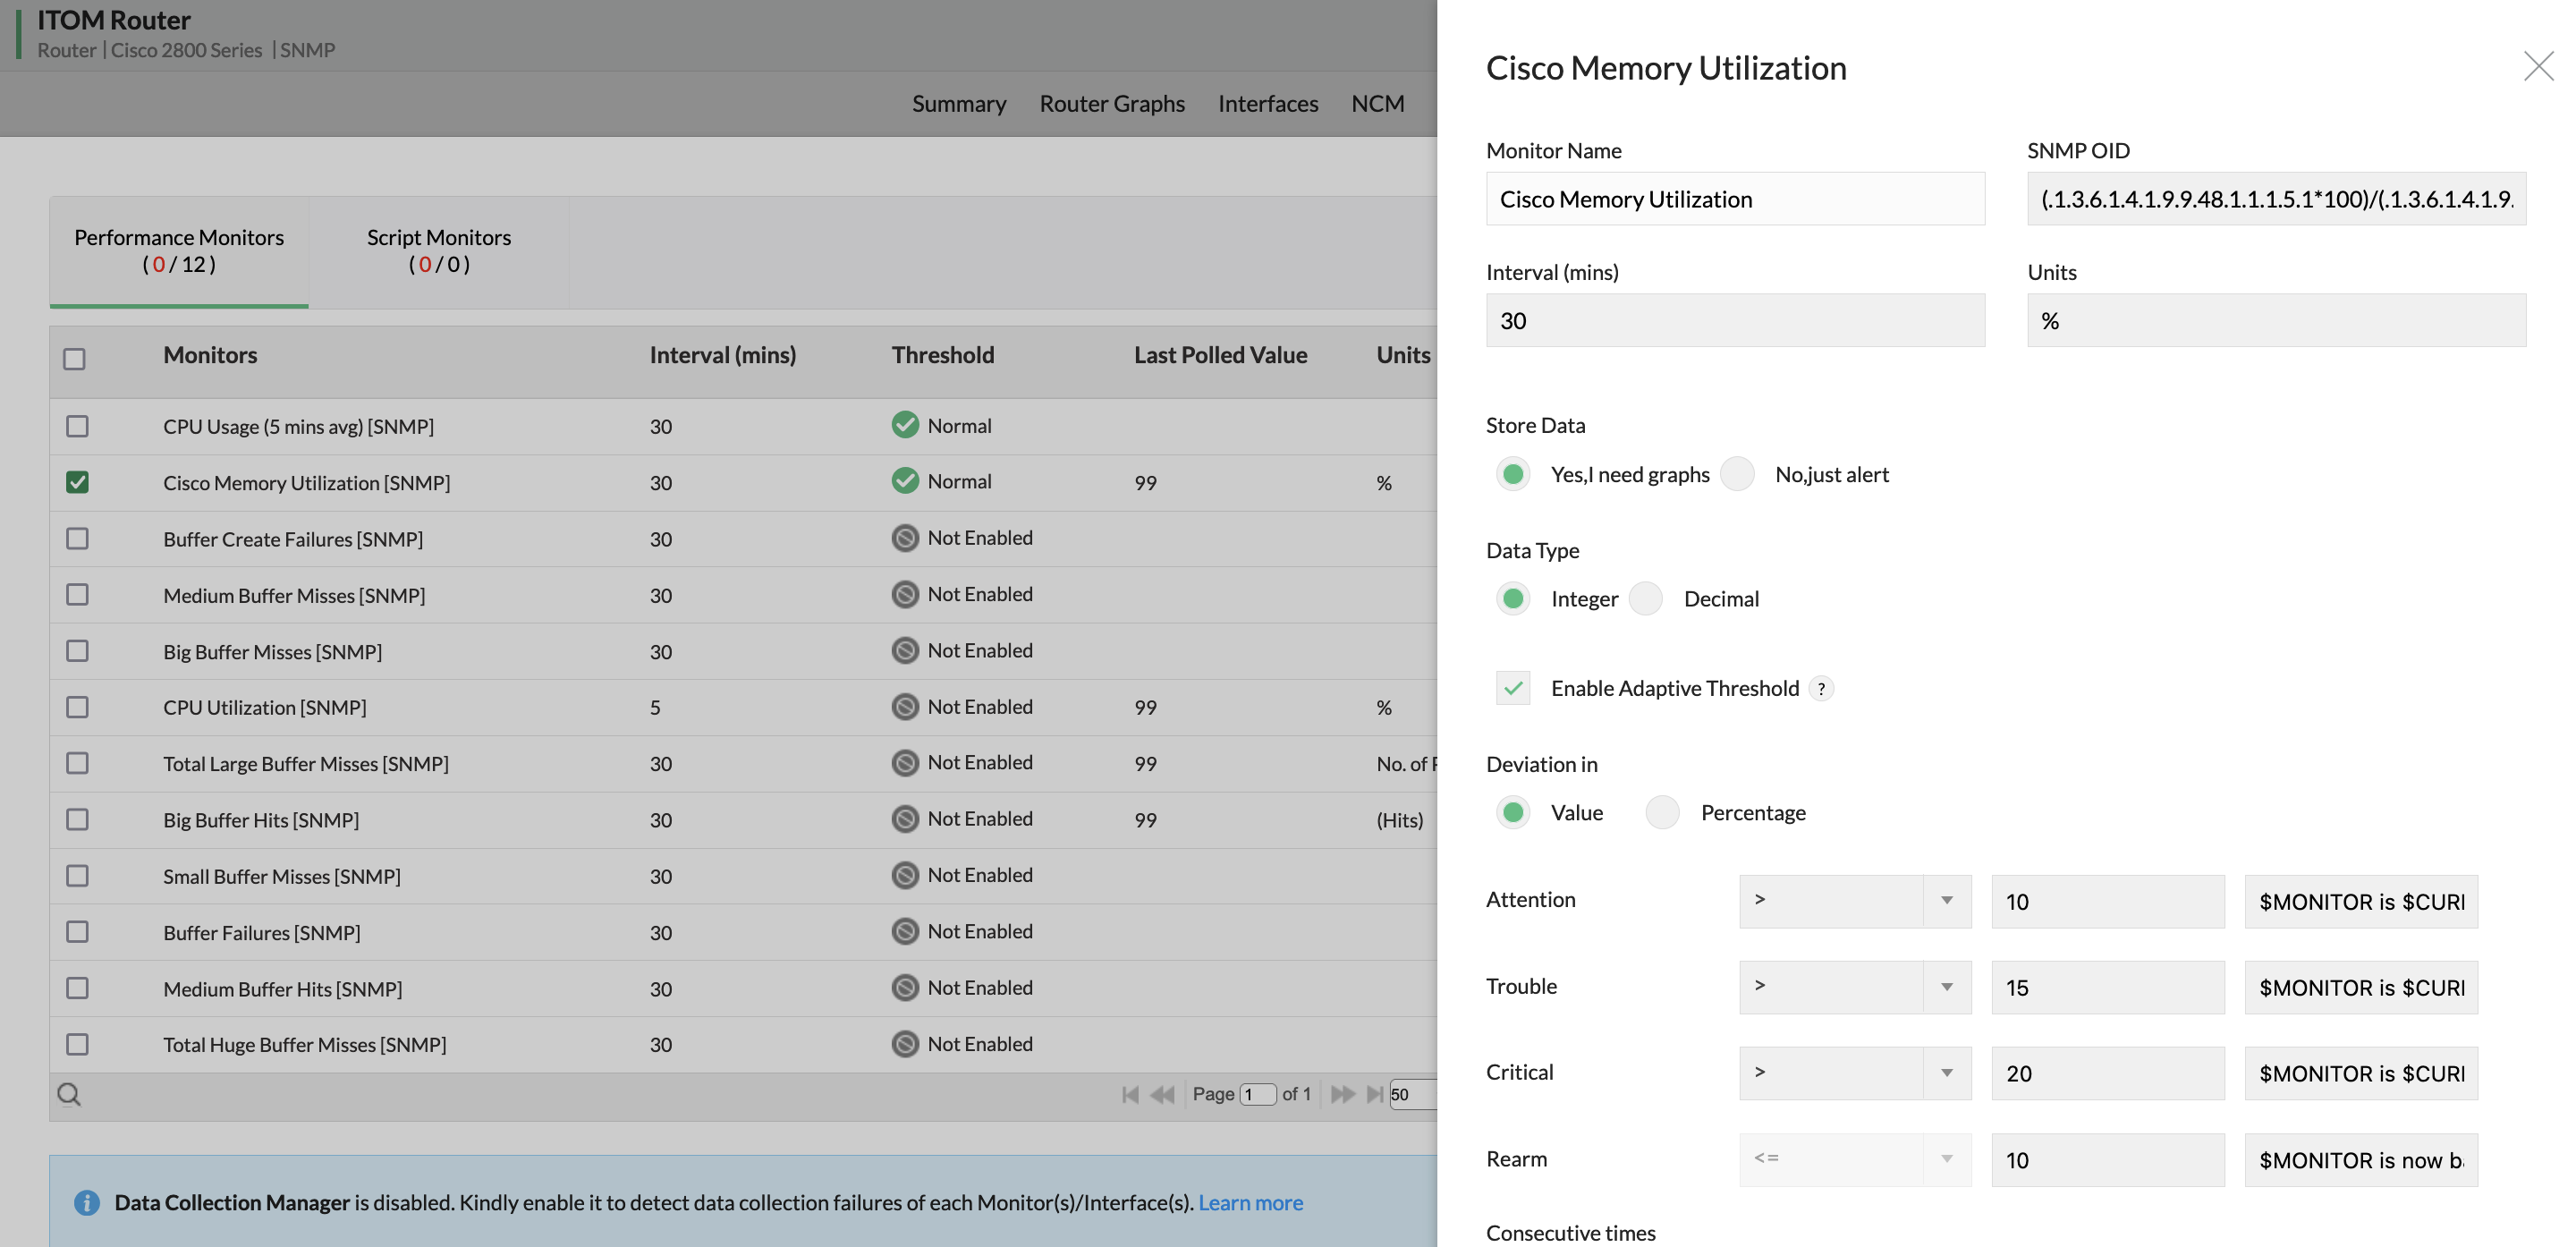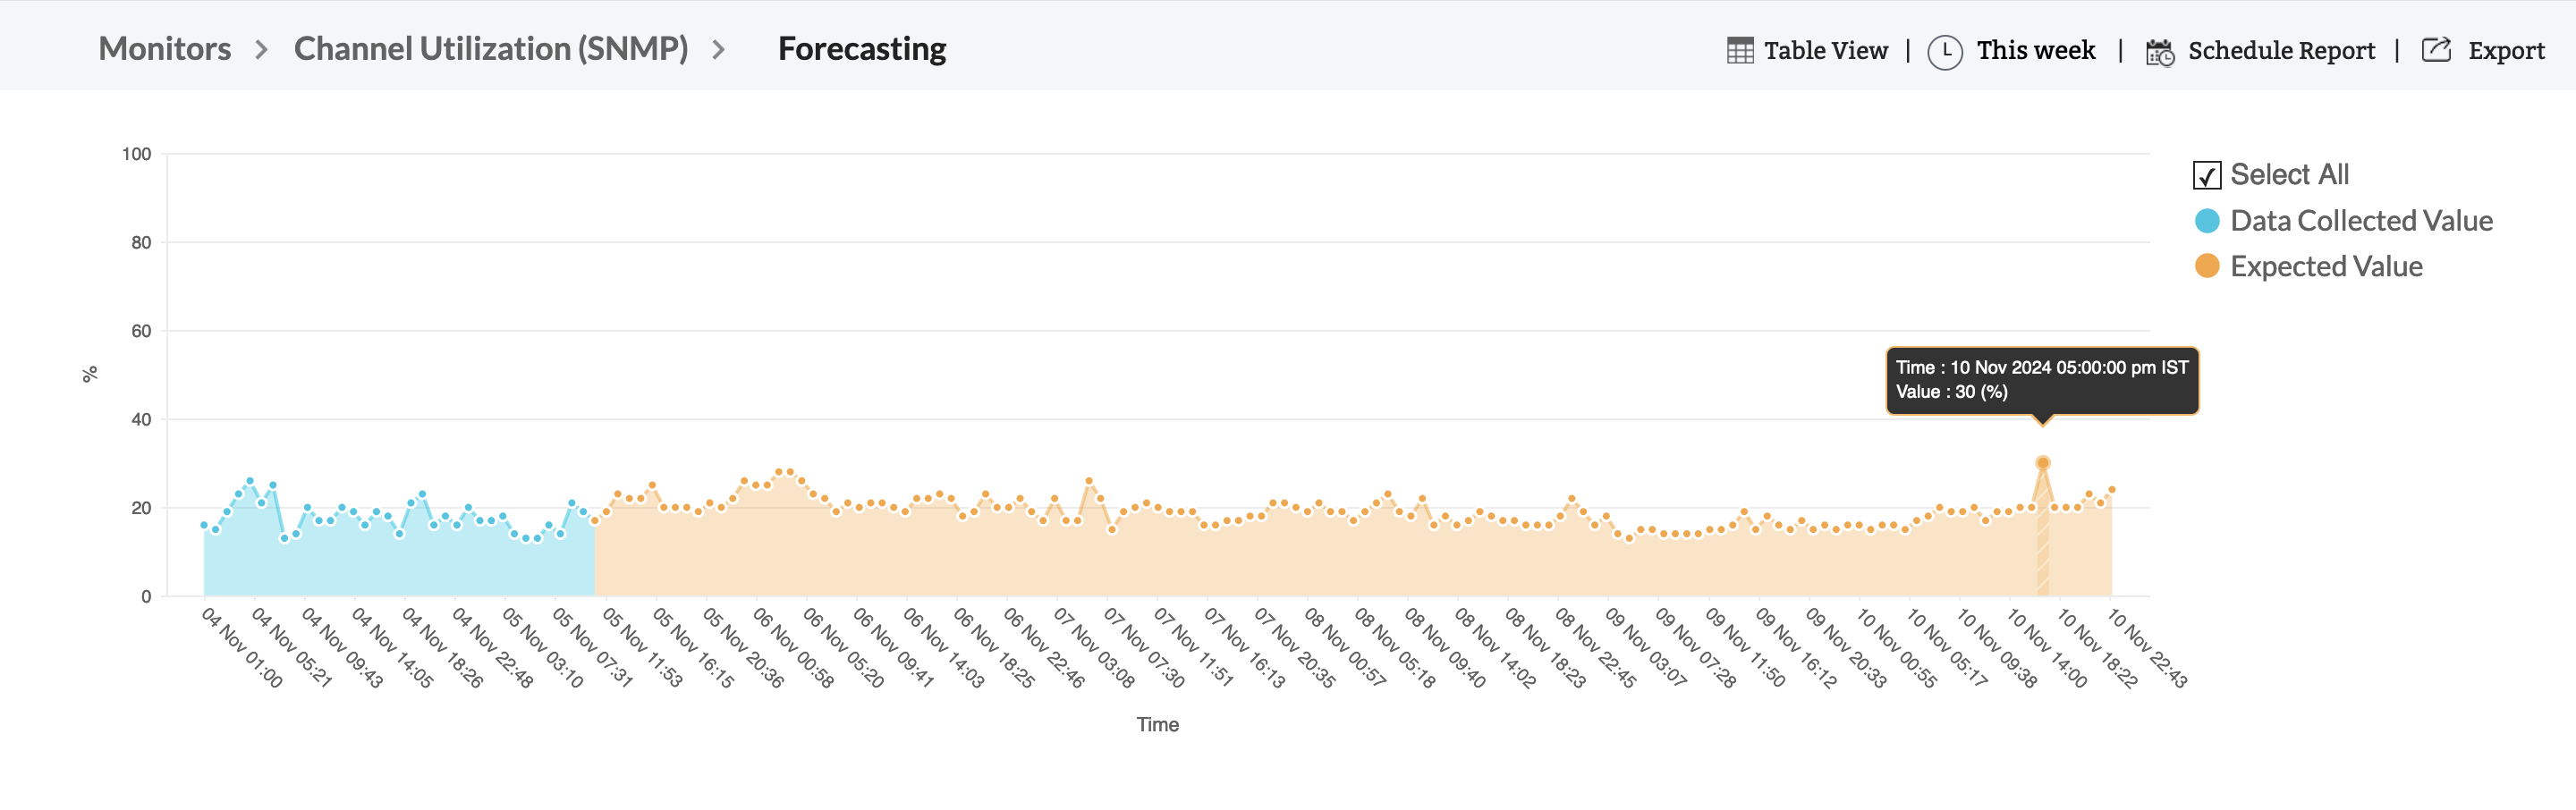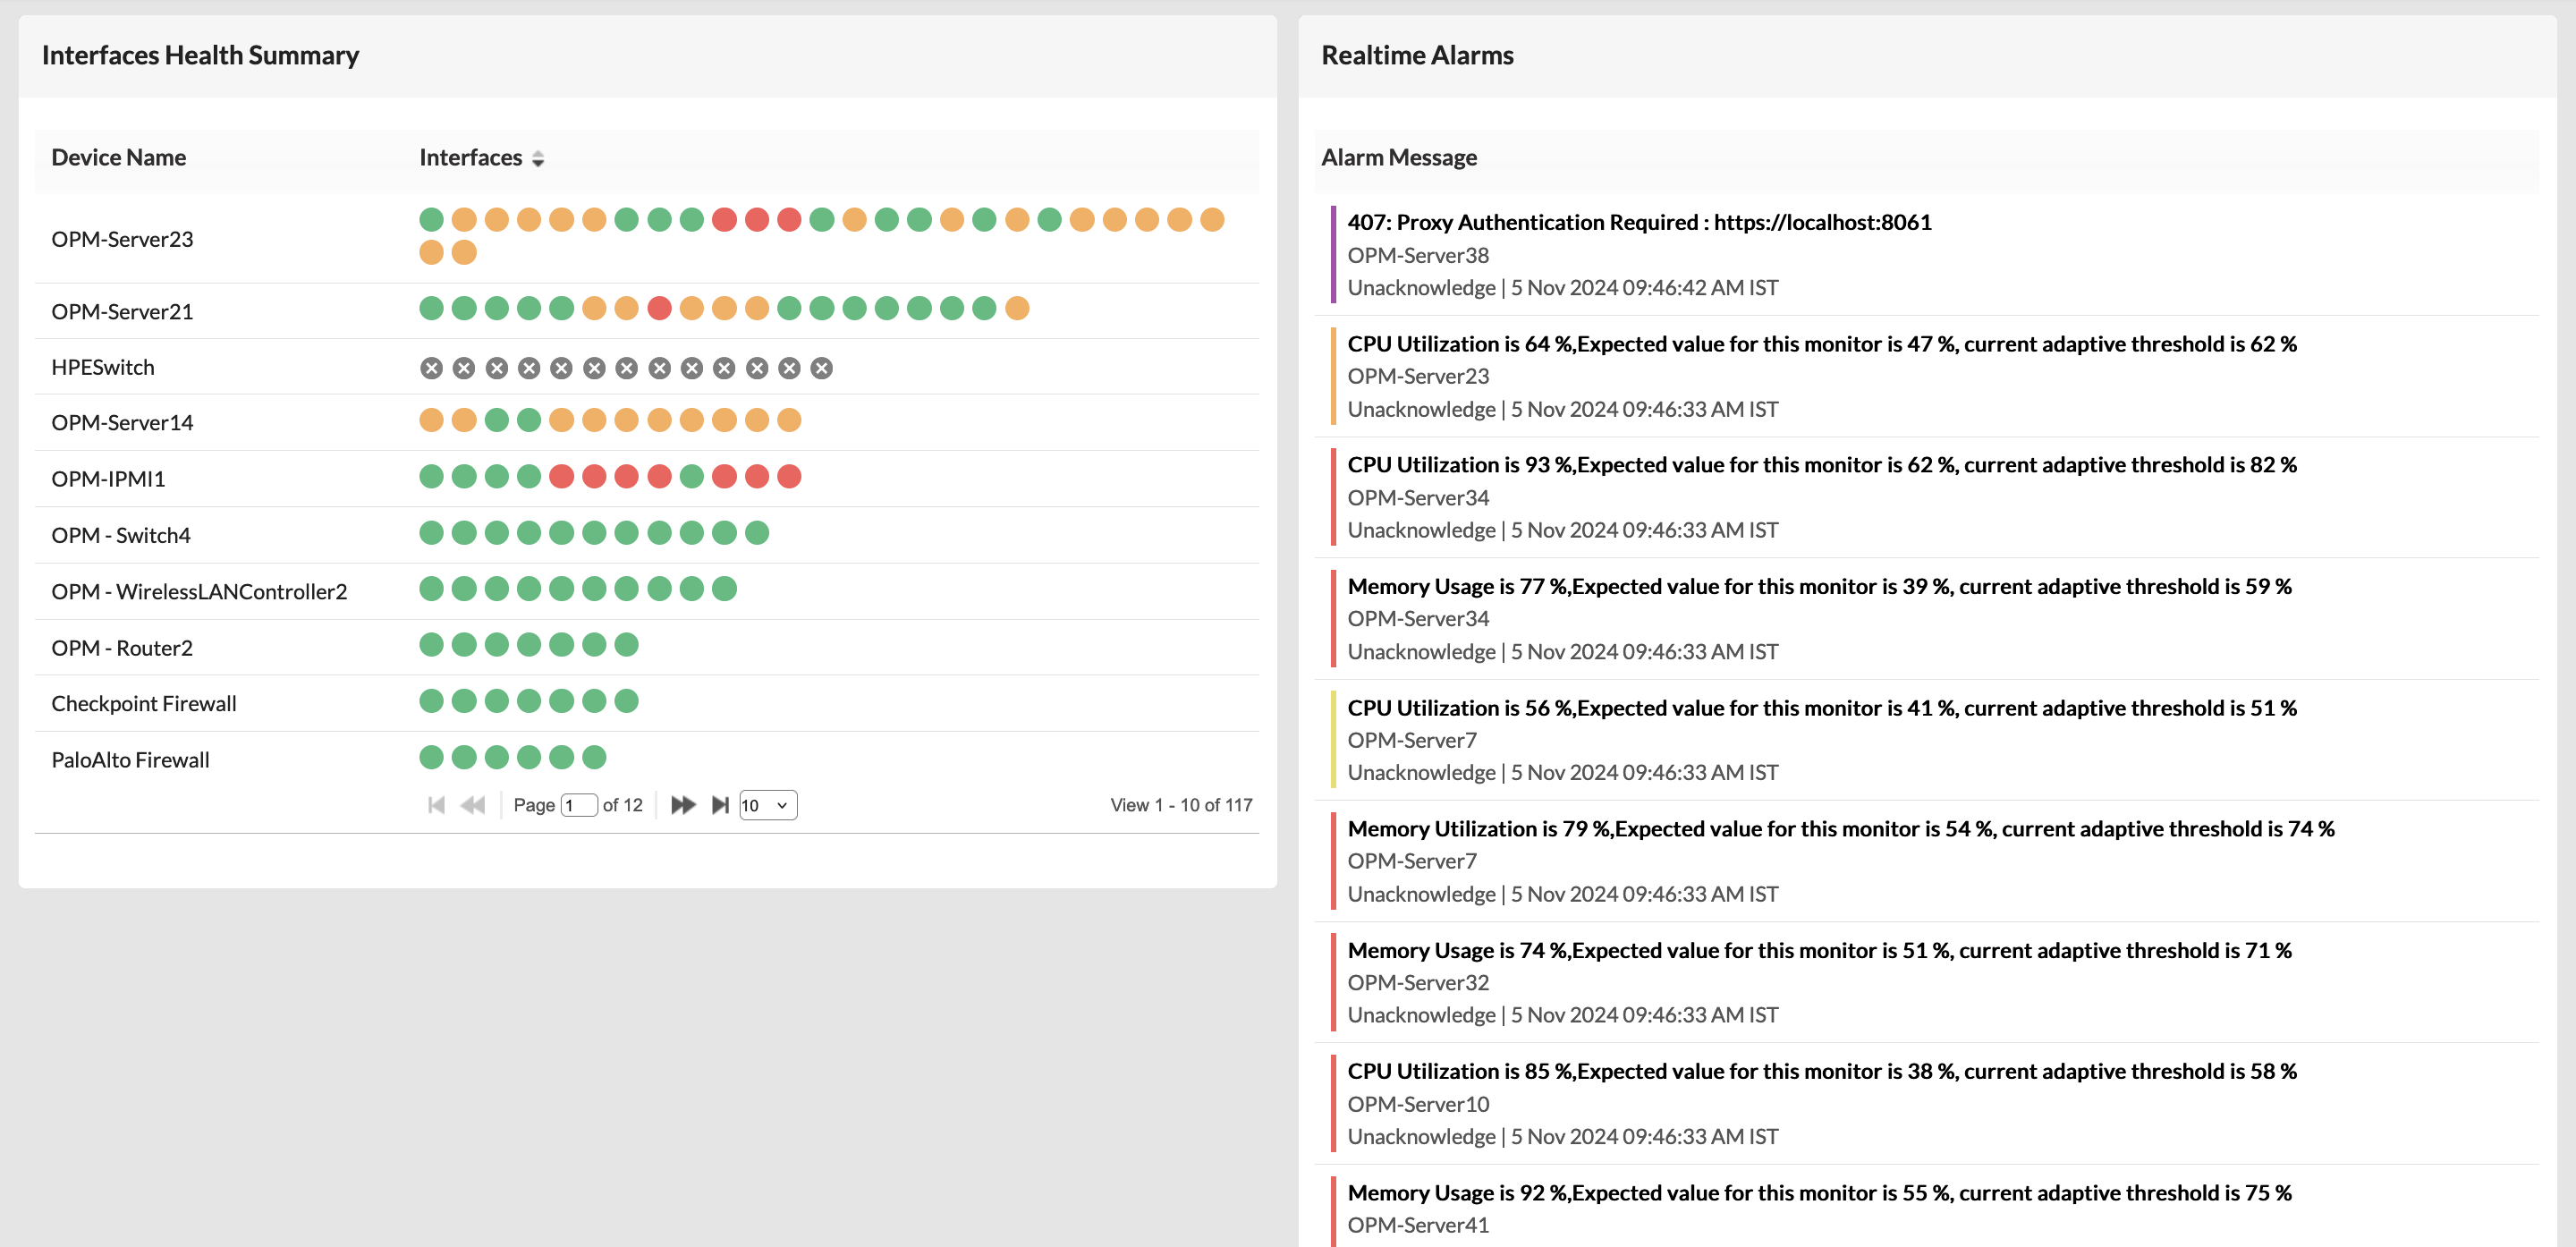
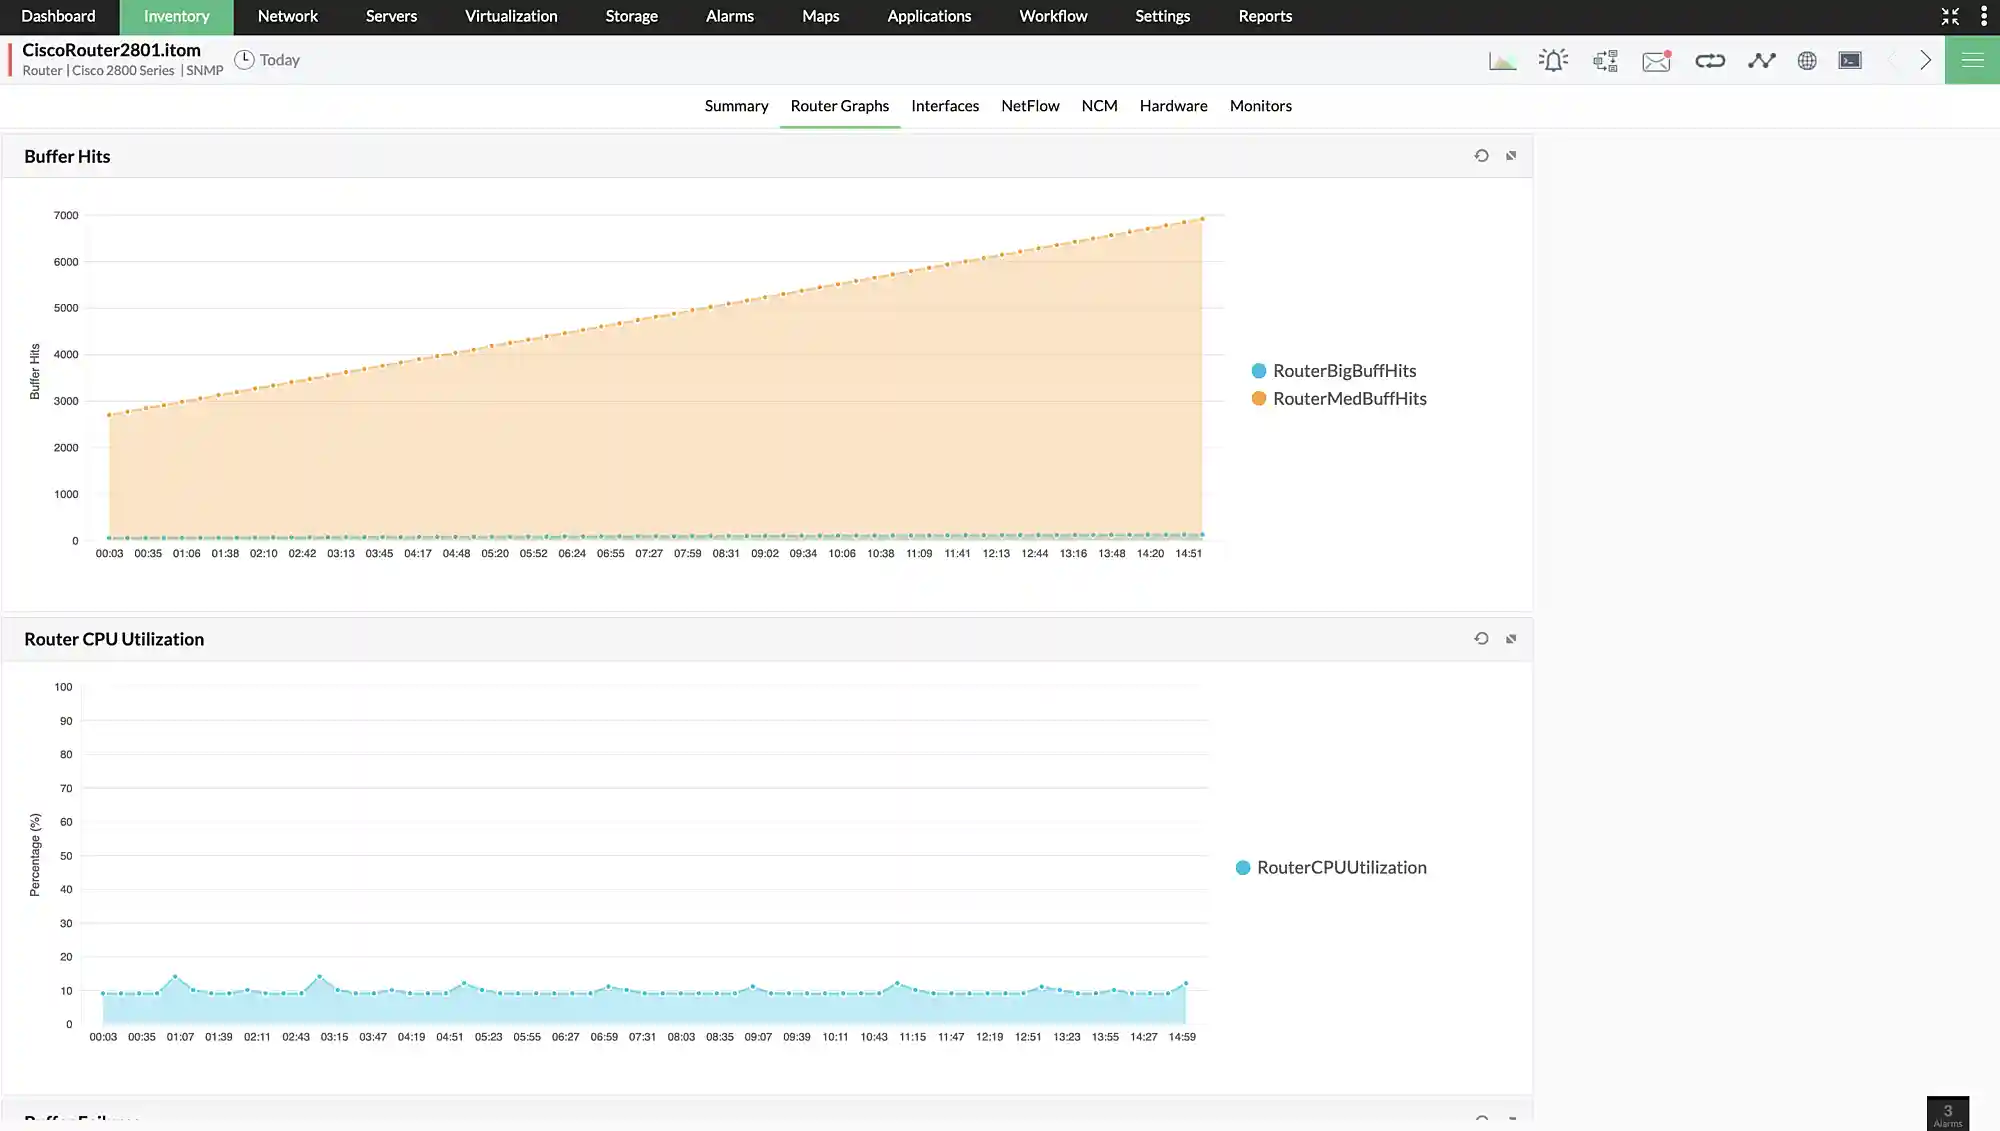
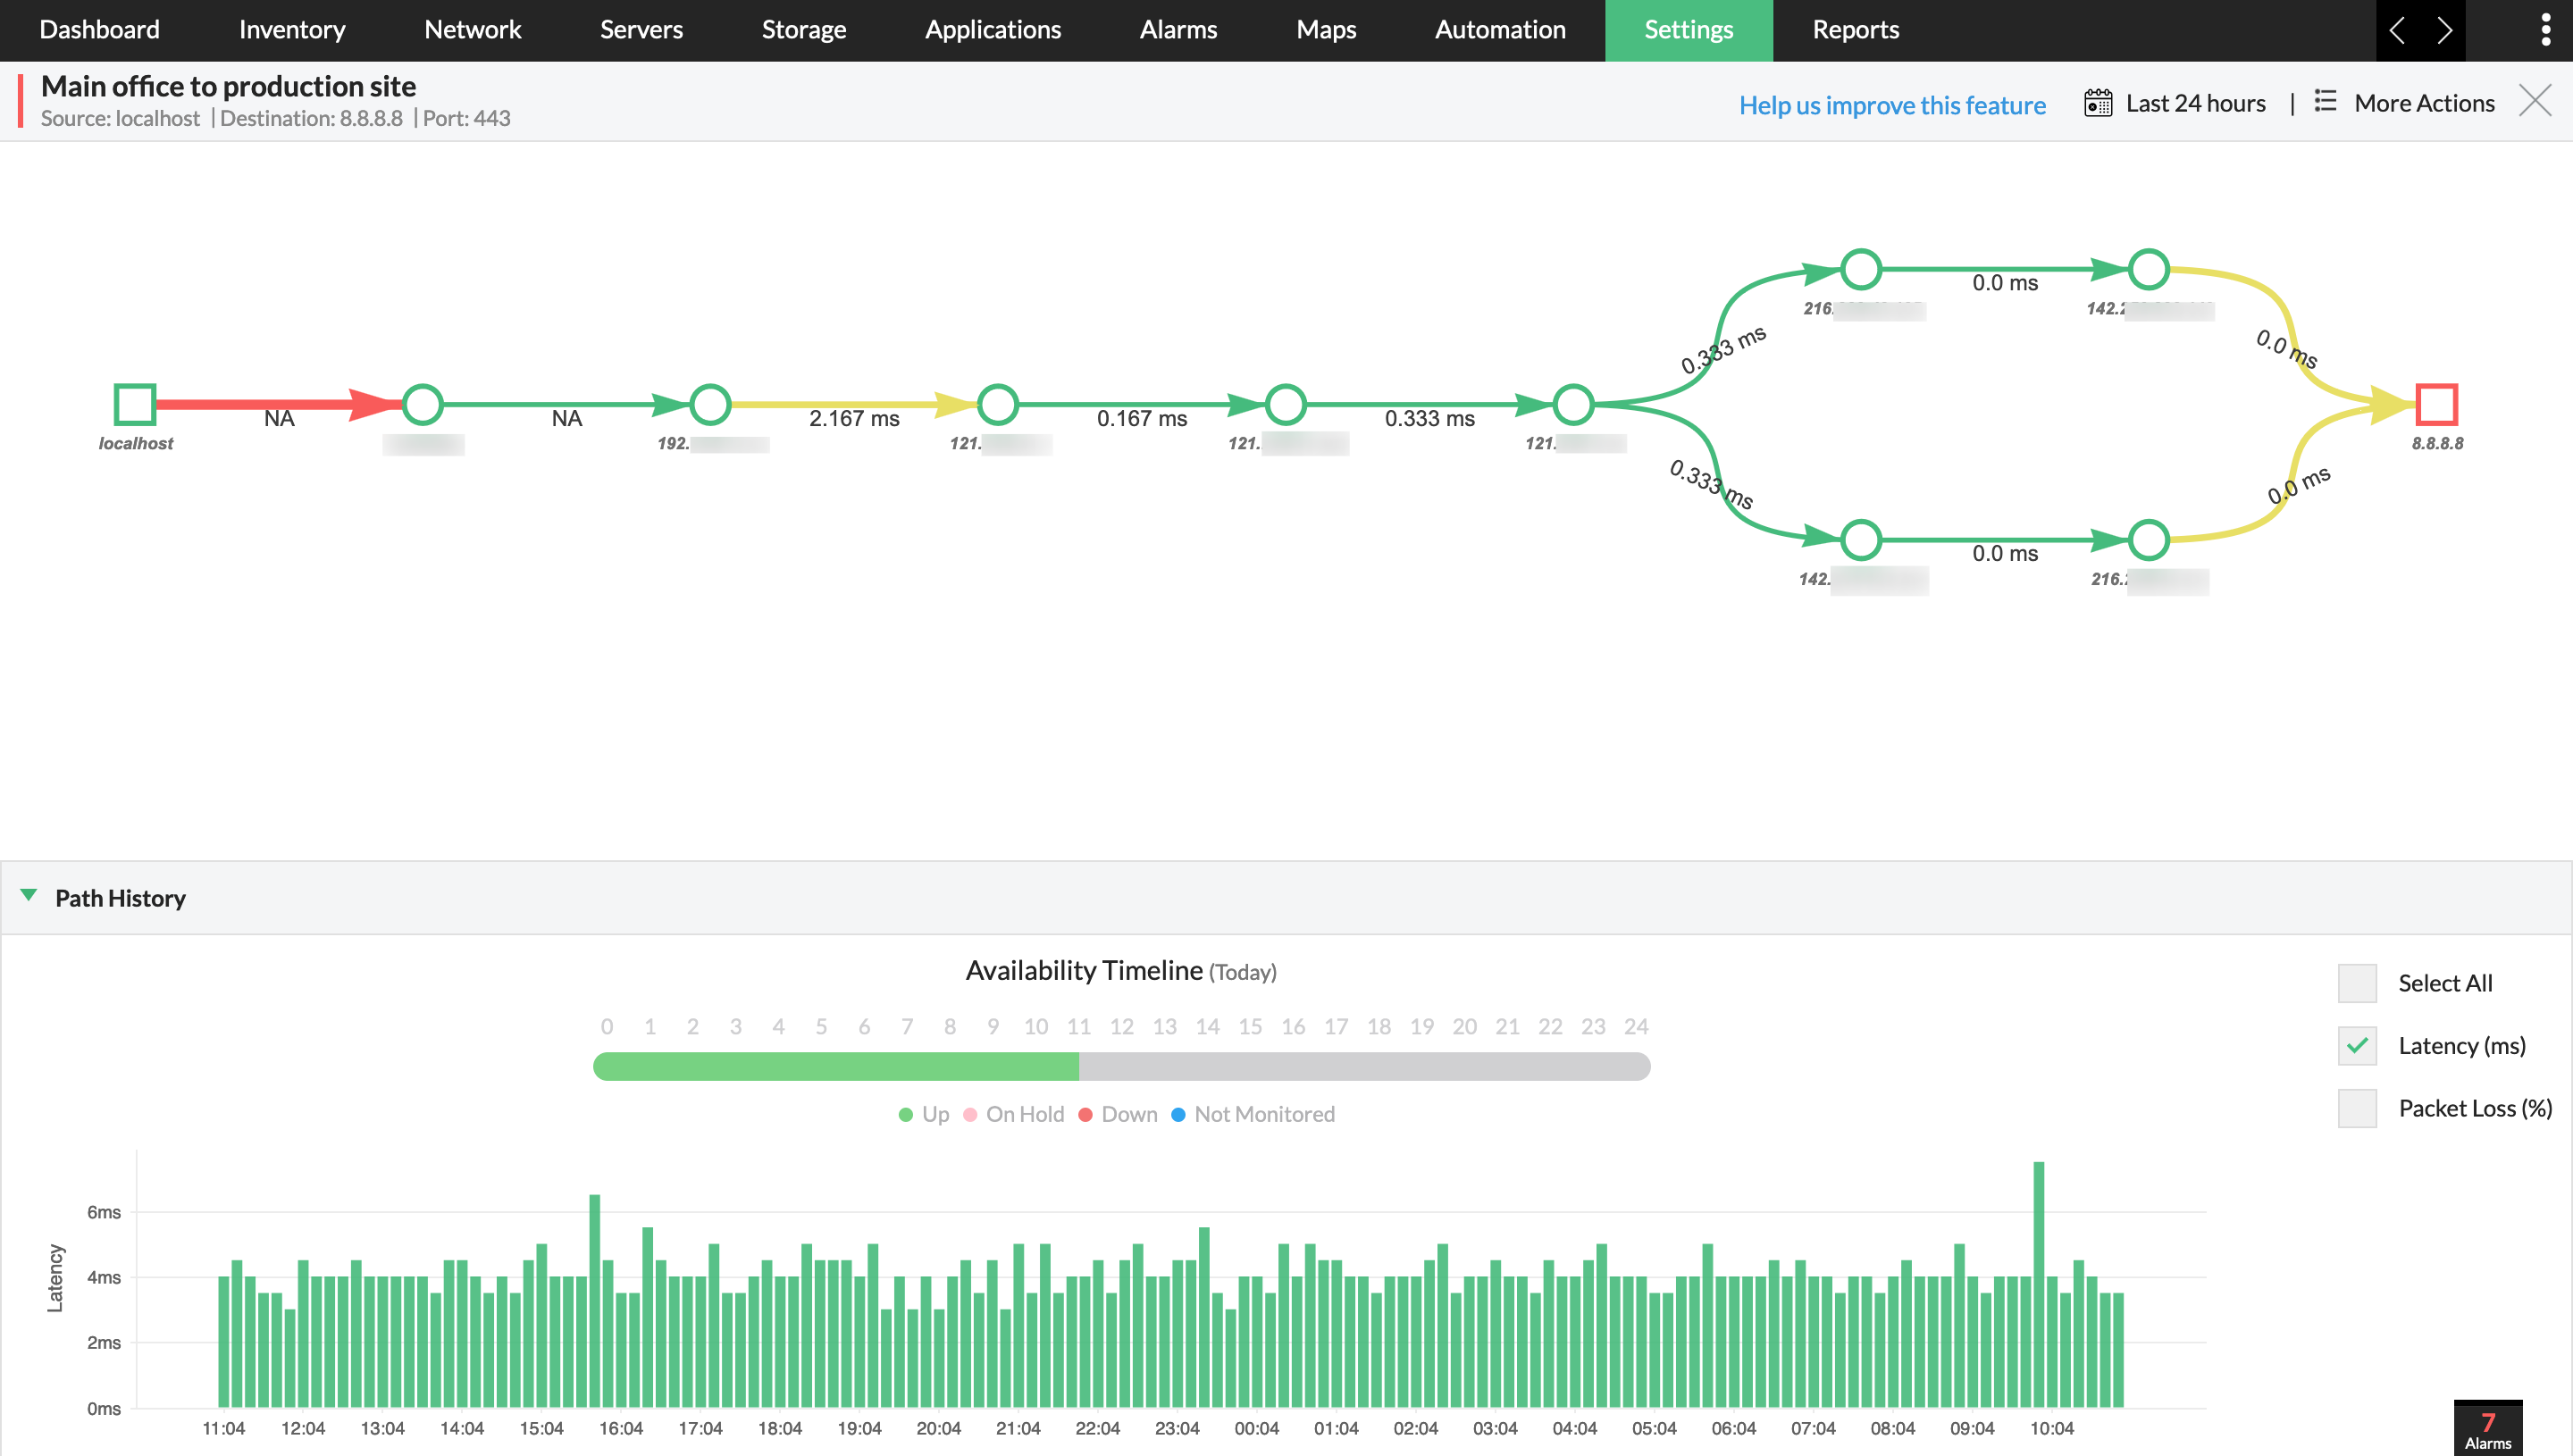
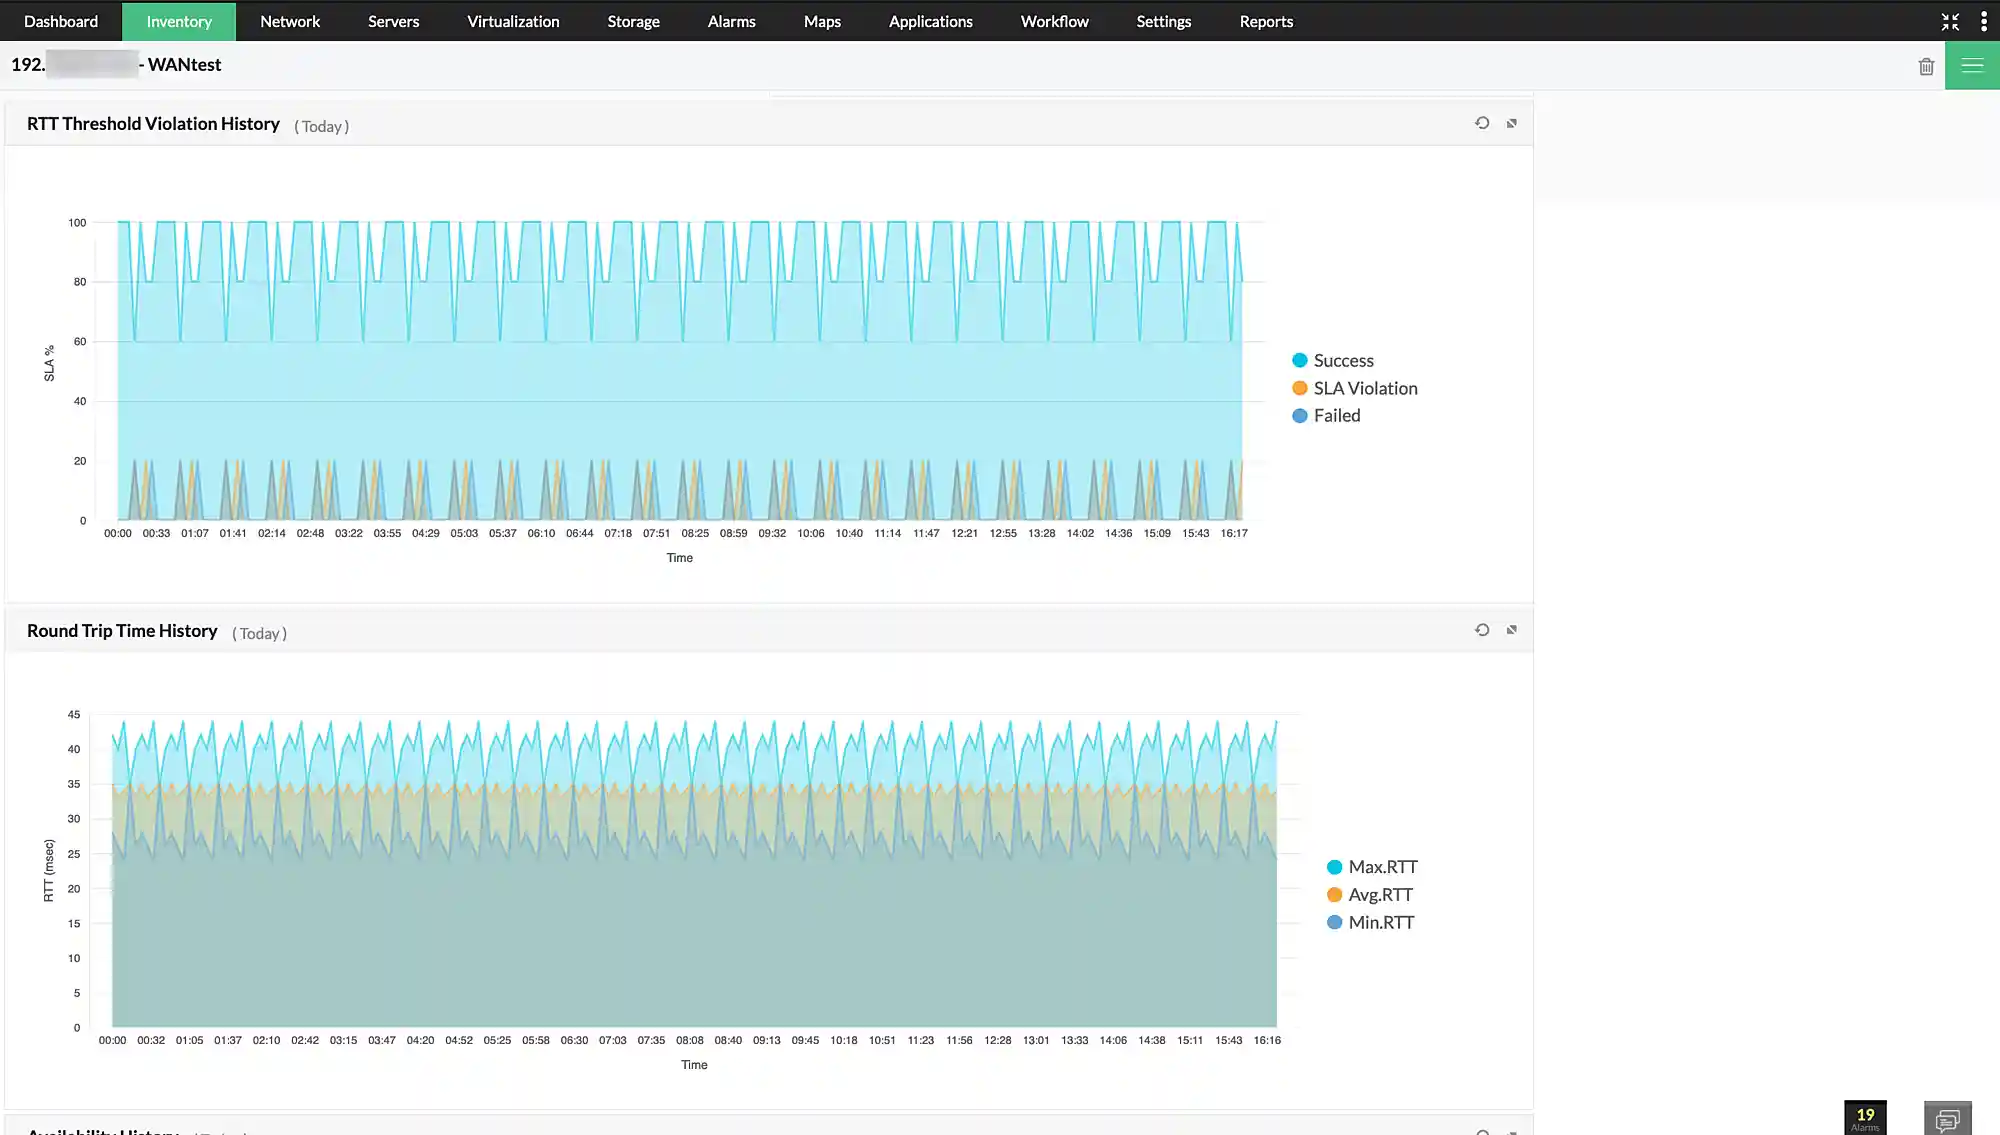
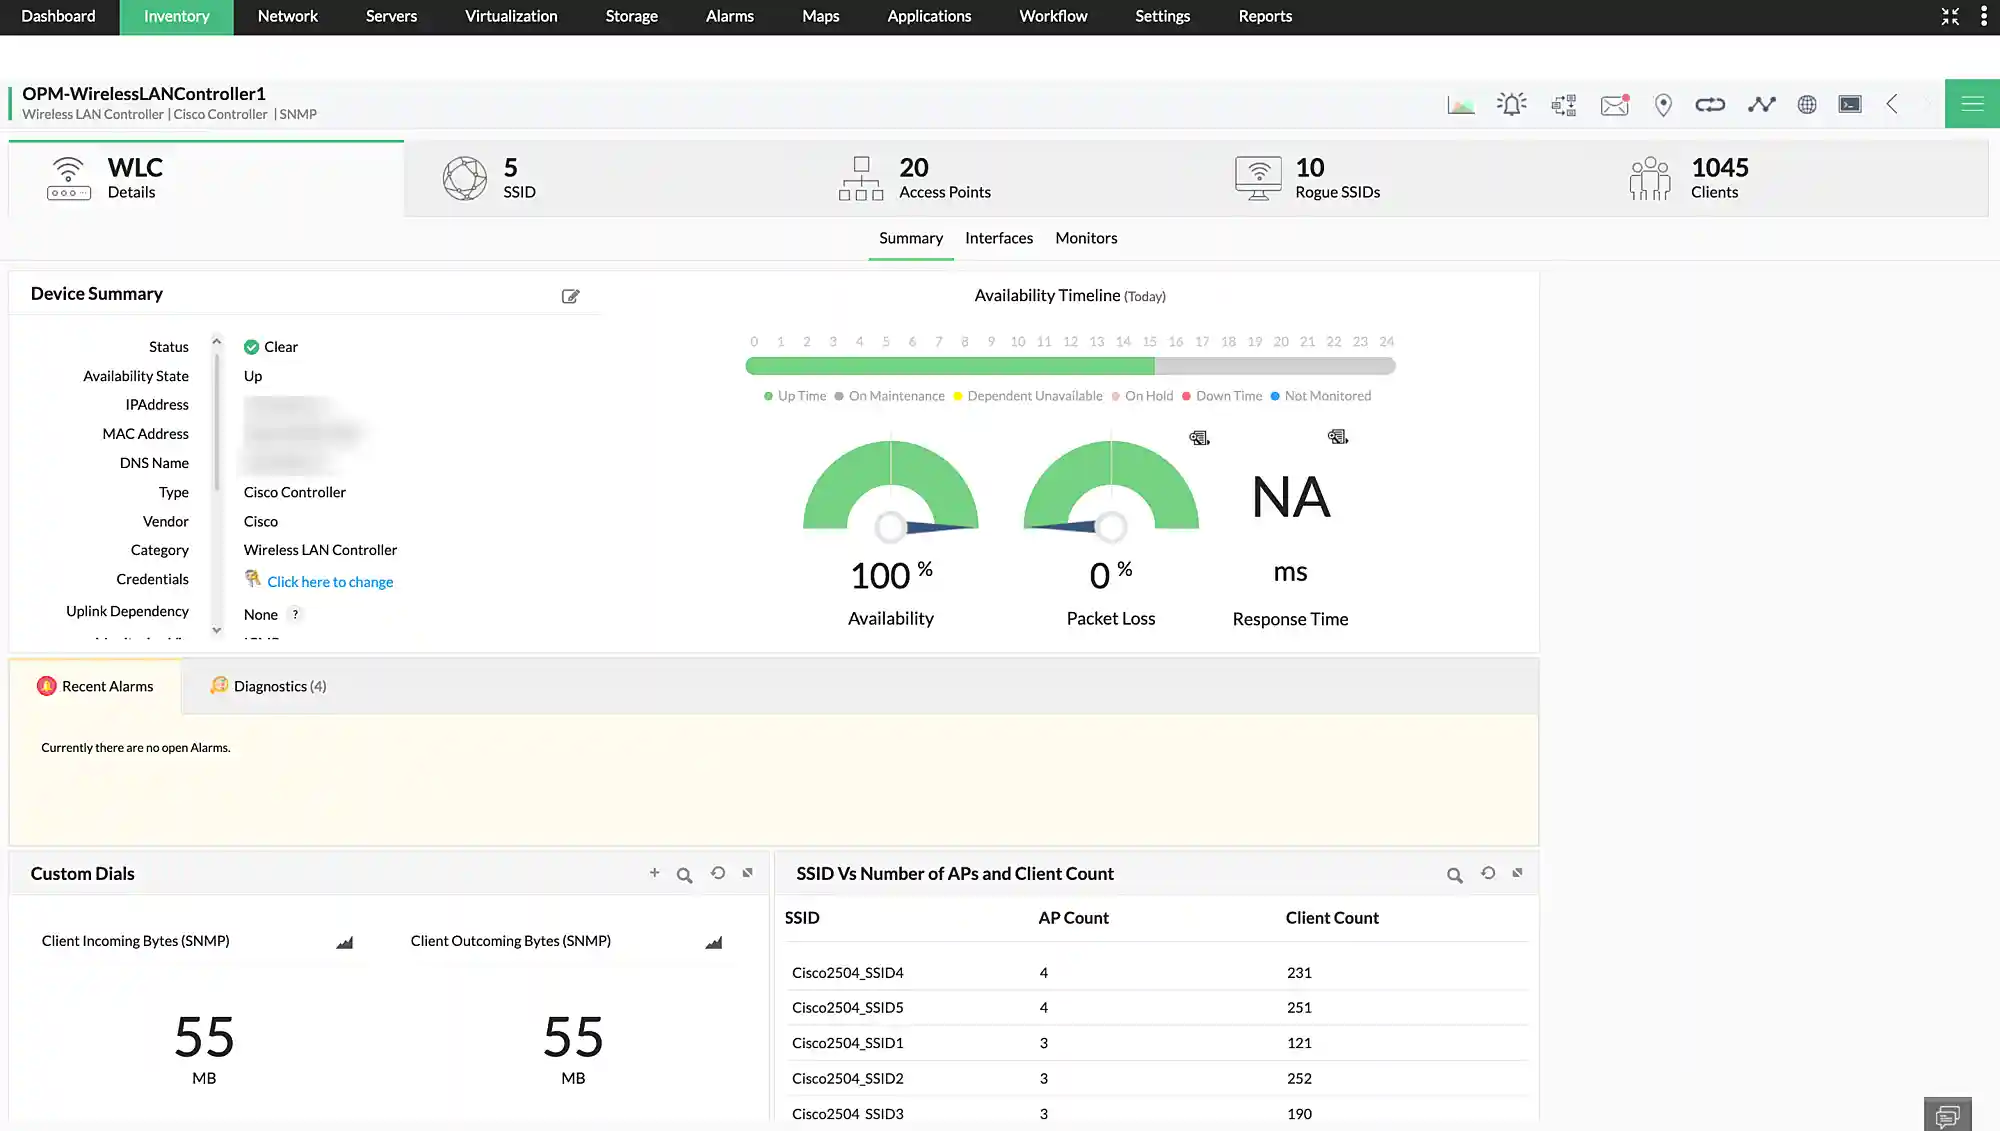
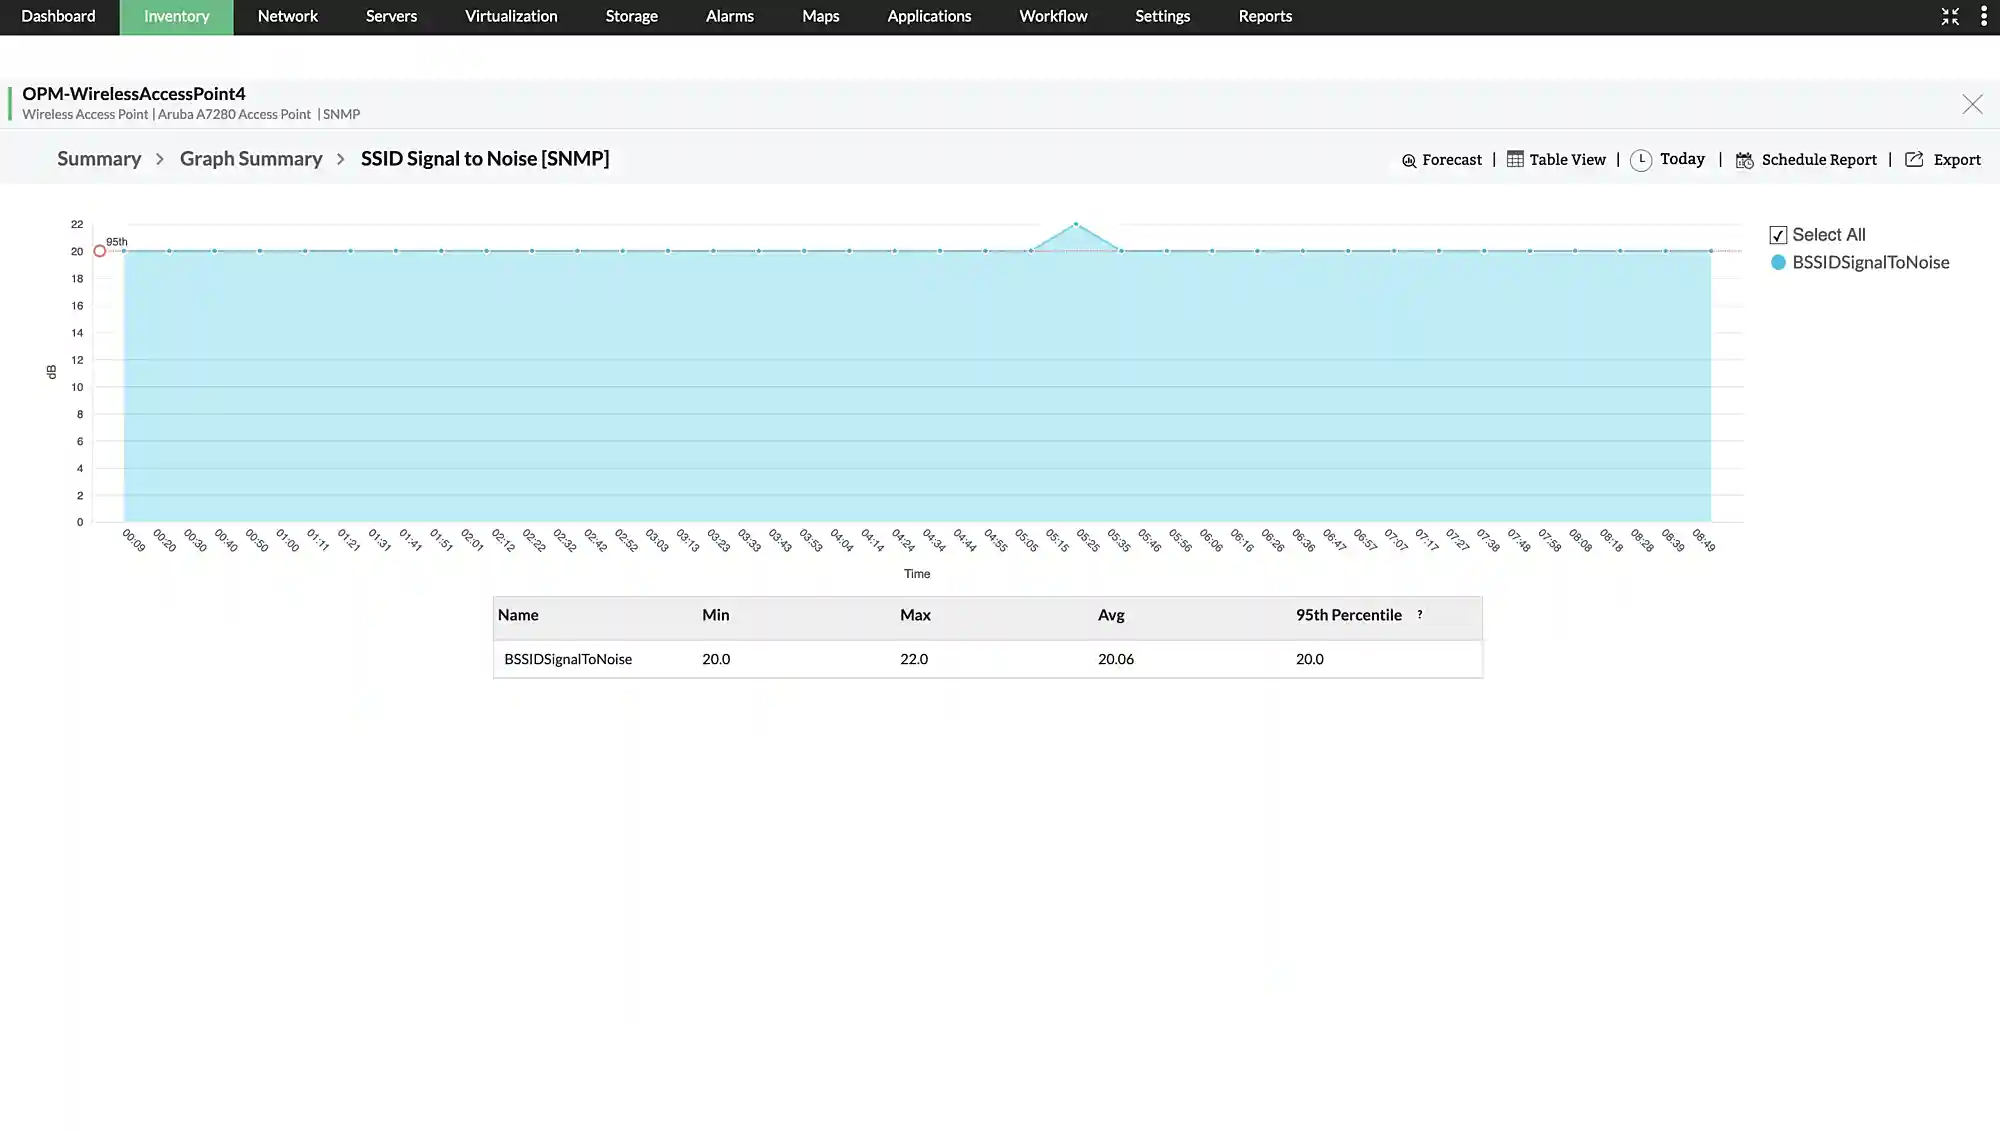
AI-driven performance monitoring
OpManager's in-built AI engine ingests and analyzes monitored data to calculate suitable alarm thresholds on an hourly basis. When enables, OpManager automatically assigns relevant performance monitors for all devices, cutting down alarm floods, false positives, and manual configuration.