Trusted by over 5000+ businesses
One software for all storage monitoring requirements
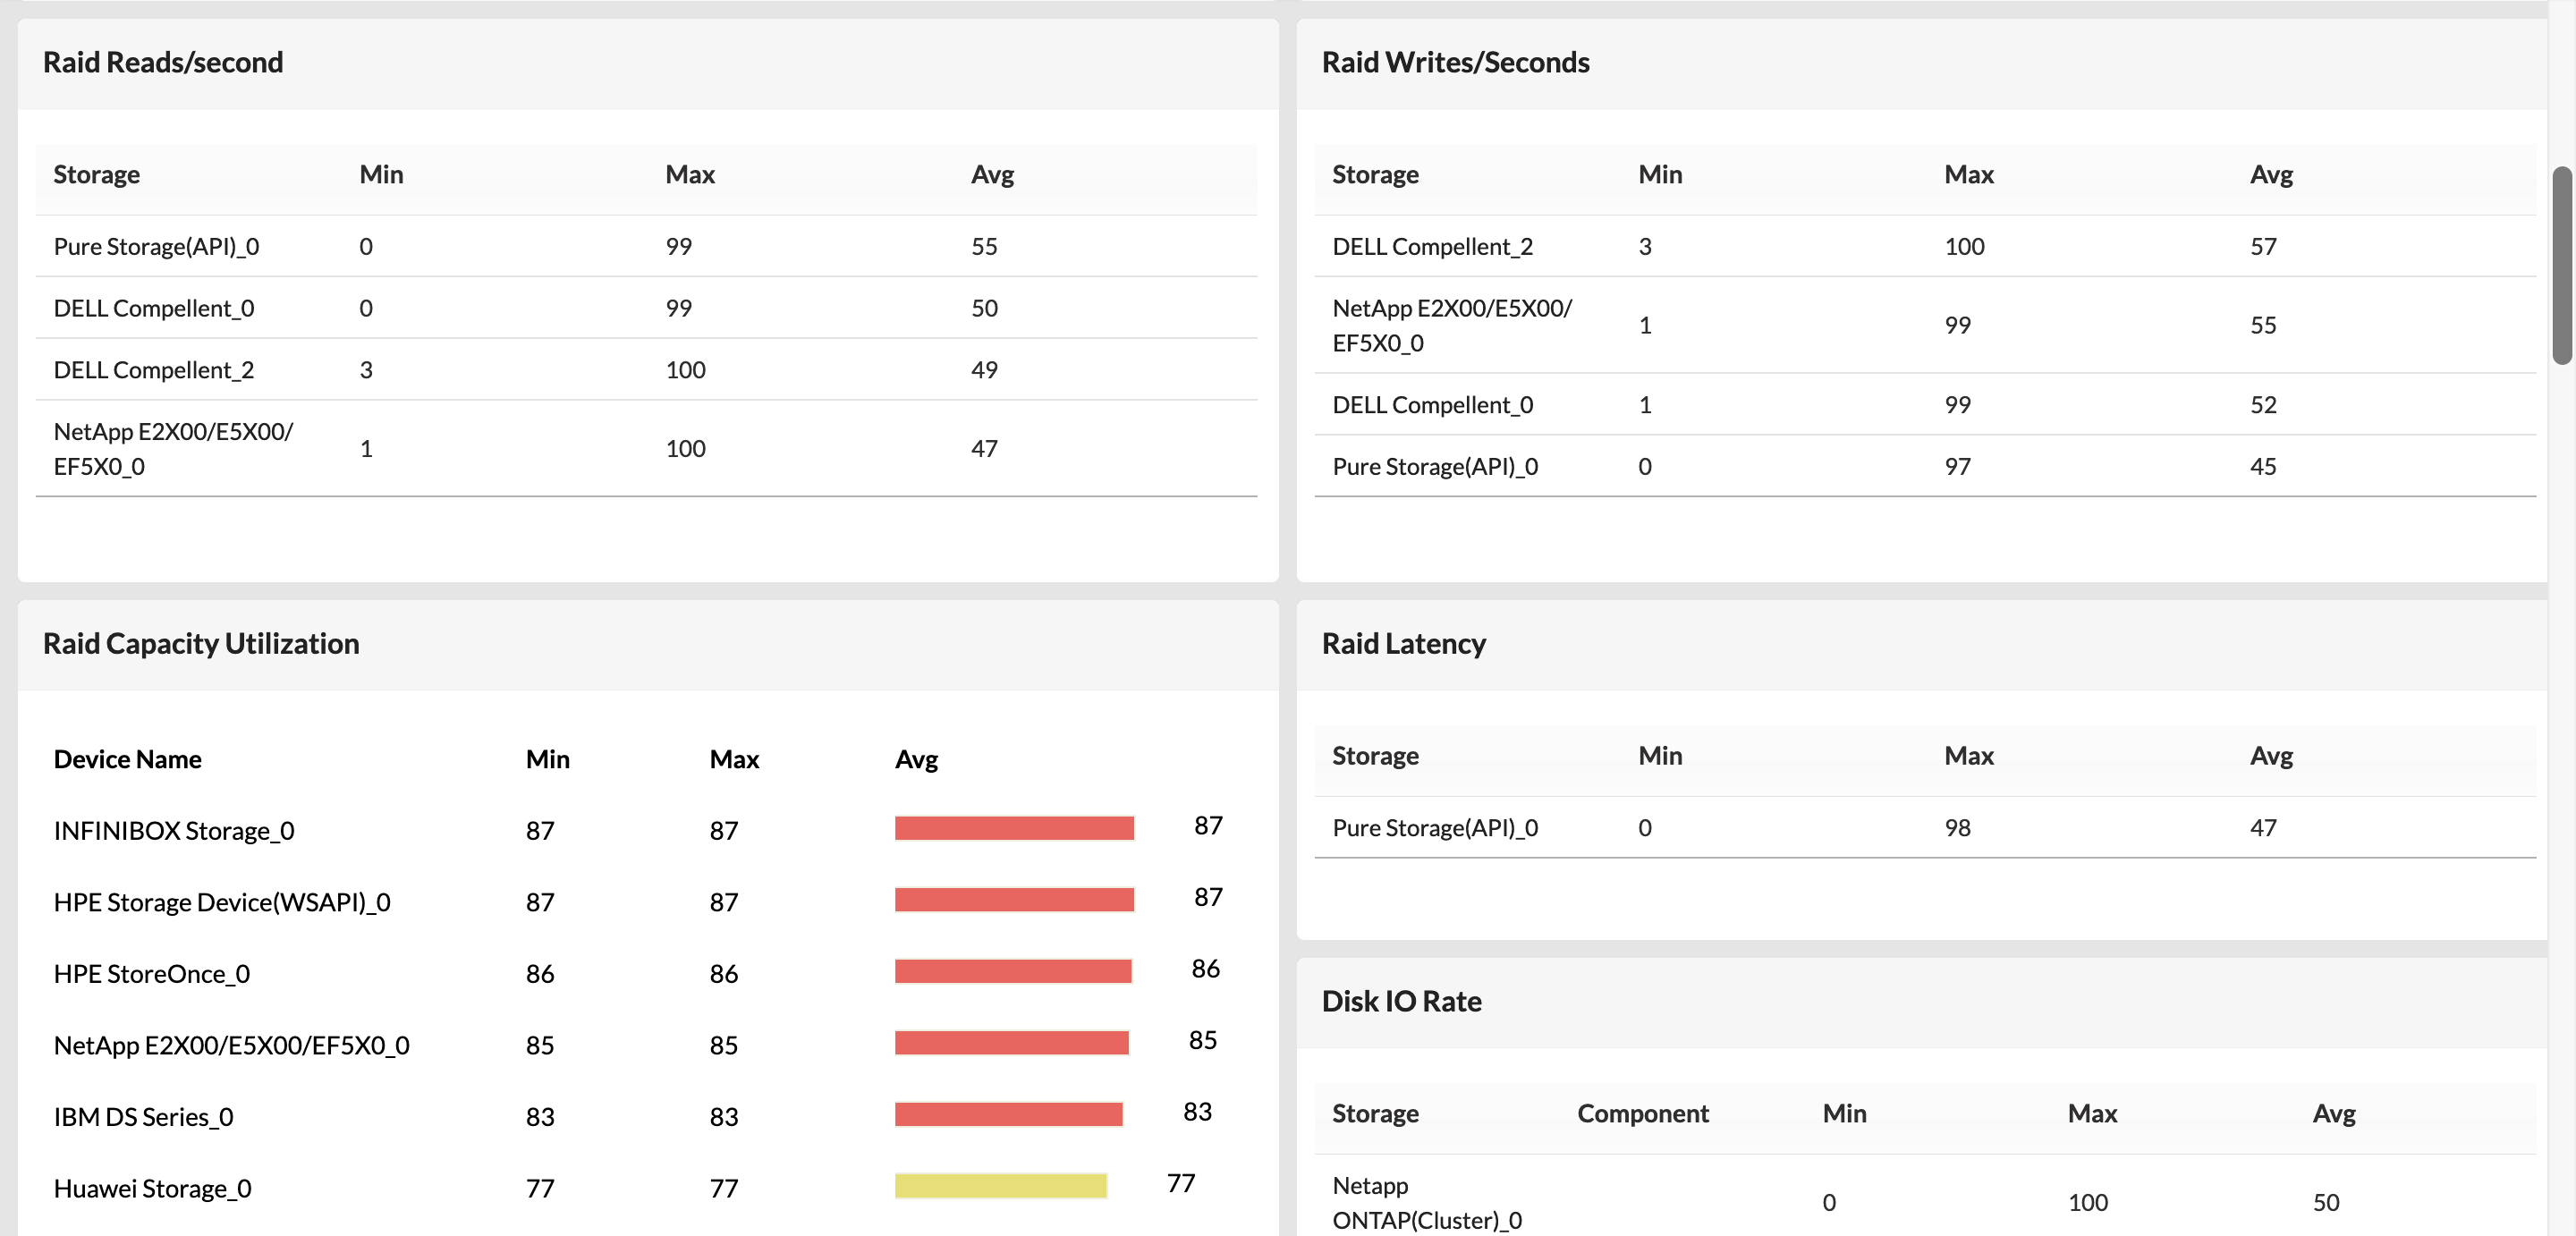
RAID monitoring
Monitor RAID storage devices with visibility into the individual disks, logical unit numbers (LUNs), chassis hardware health, storage capacity, and device performance.
Tape library monitoring
Keep track of the health, performance, and storage capacity of tape libraries and individual tape drives. OpManager displays information like vendor, model, serial number, firmware, etc.
Fabric switch monitoring
Manage storage area networks by monitoring the health and performance of fabric switches. OpManager discovers switch ports and displays port traffic, operational status, hardware state, etc.
Storage disk monitoring
Monitor the performance of storage disks with metrics like reads, writes, and IOPs. Poll storage devices to monitor performance metrics and generate graphs for easier visualization.
Virtual datastore monitoring
Discover virtual datastores associated with host devices in virtual storage area networks (vSAN) automatically and monitor metrics like capacity, available space, read, write, and throughput.
HCI monitoring
Discover, monitor, and map hyper-converged infrastructure from top vendors like Nutanix with in-depth visibility into the VMs, virtual networks, and virtual storage units.
Out-of-the box support for diverse storage vendors
Get Started - It's FreeMonitor storage performance and health with multi-level thresholds
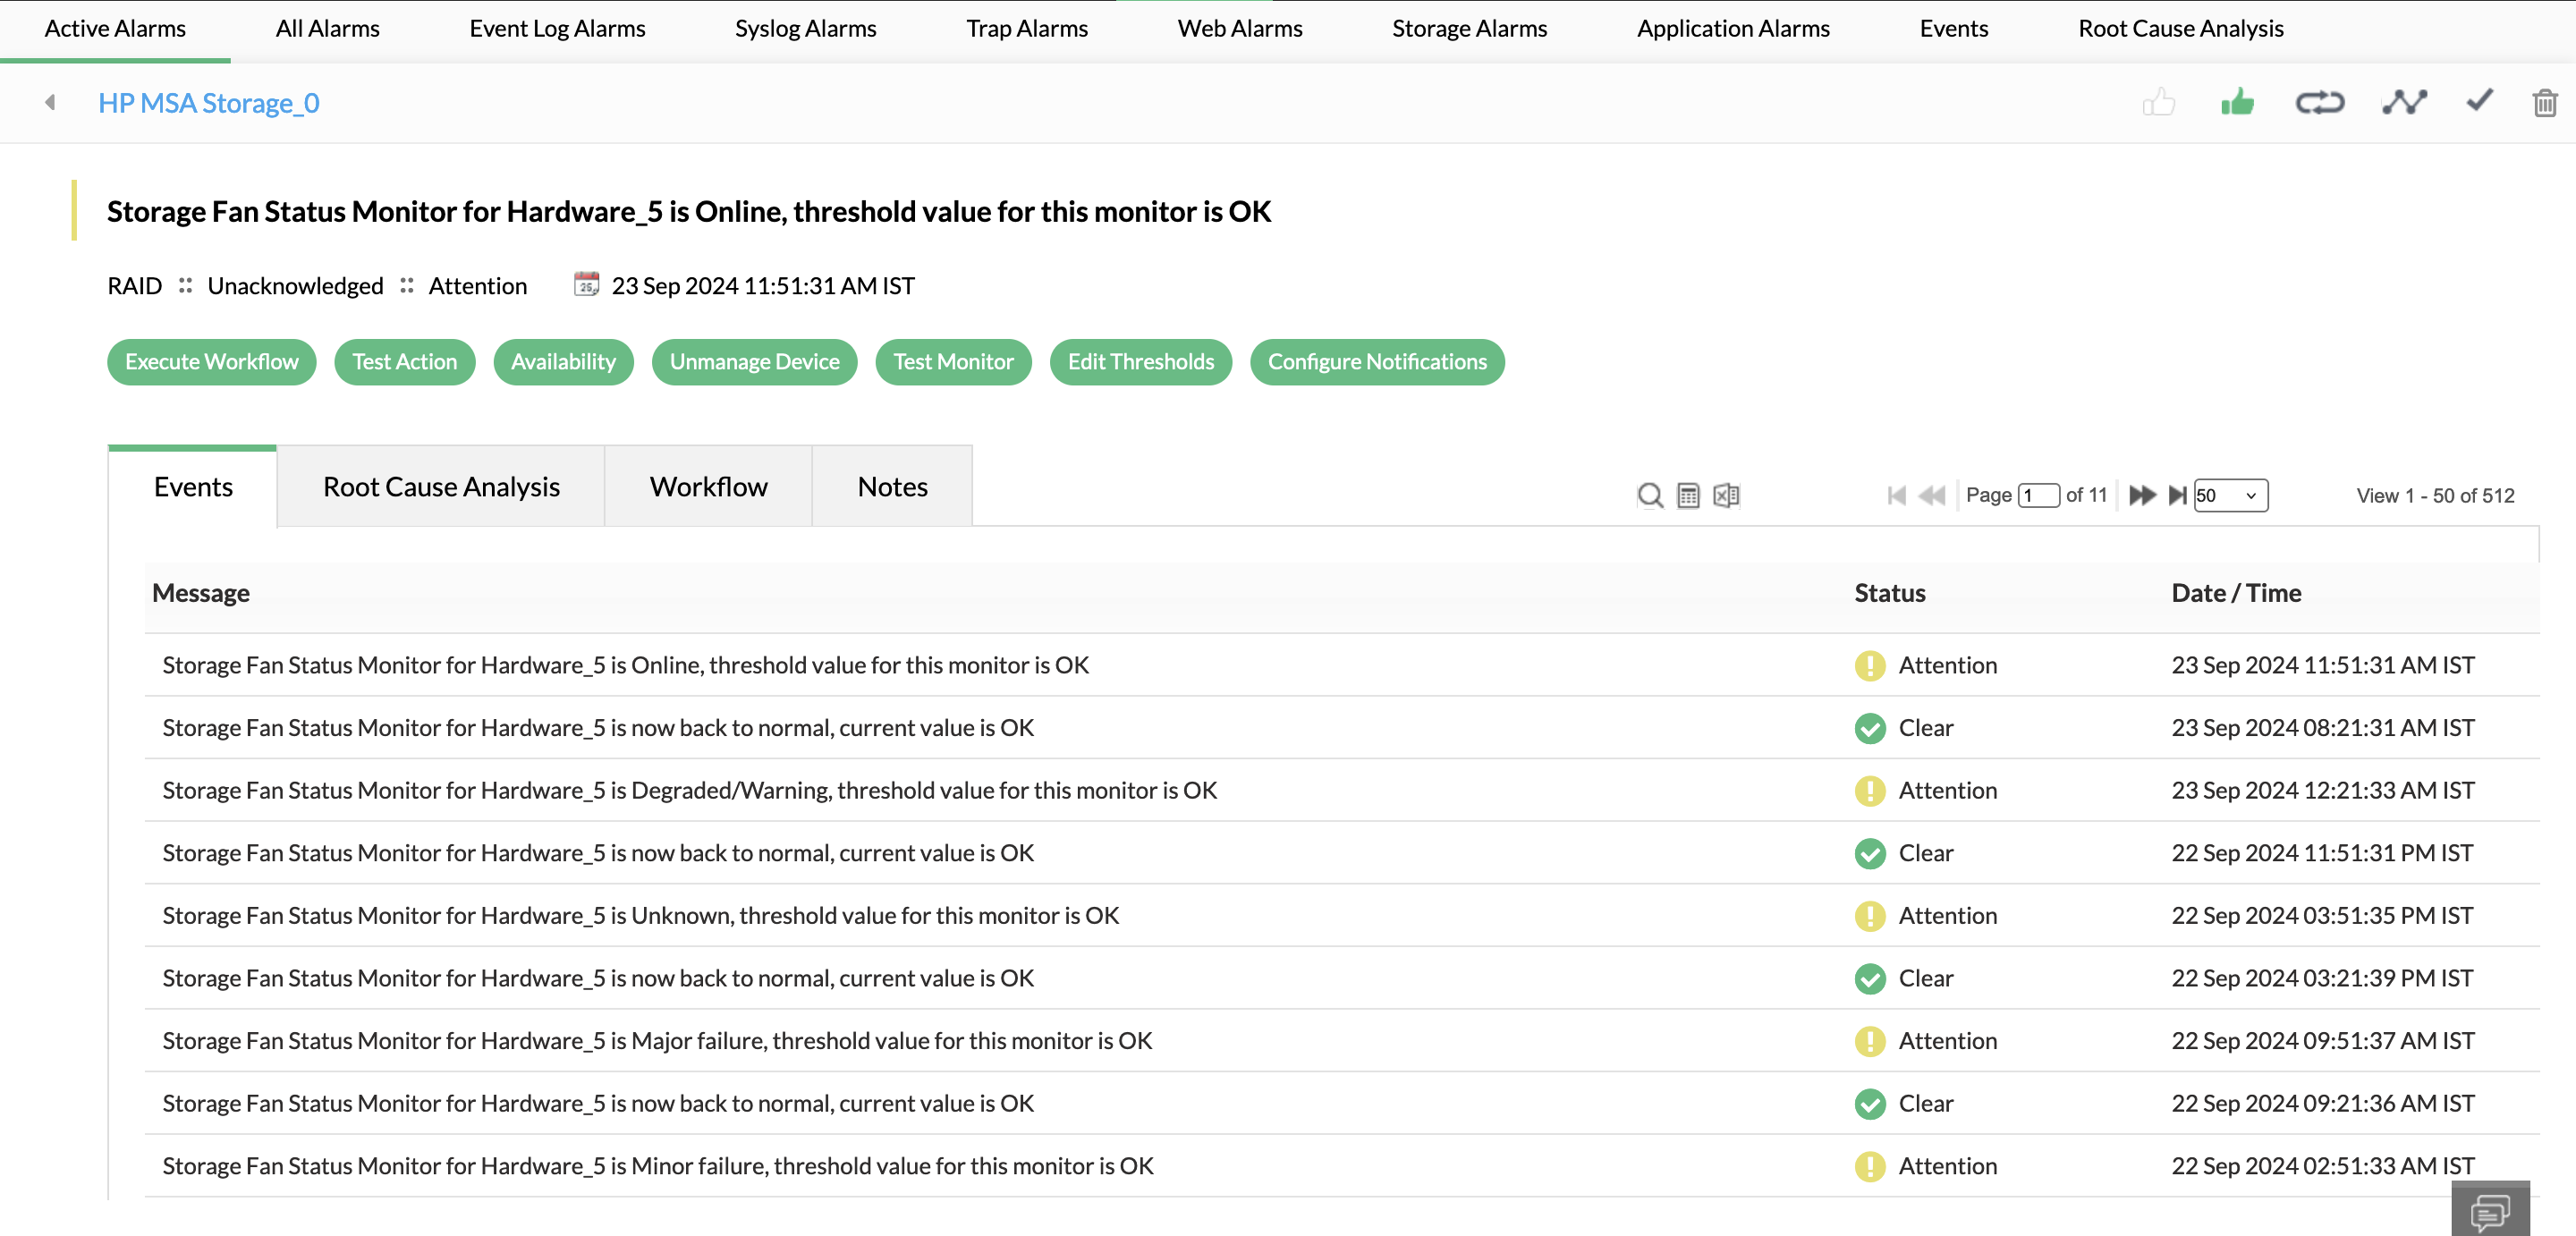
Latency in storage operations or hardware failure can bring down critical applications and customer-facing services. You can set up multi level alarm thresholds in OpManager to identify the severity of an event and respond to it. OpManager uses AI to analyze, learn, and set thresholds automatically on an hourly basis. This cuts down manual effort, alarm floods, and false alarms significantly.
Forecast storage utilization and perform capacity planning
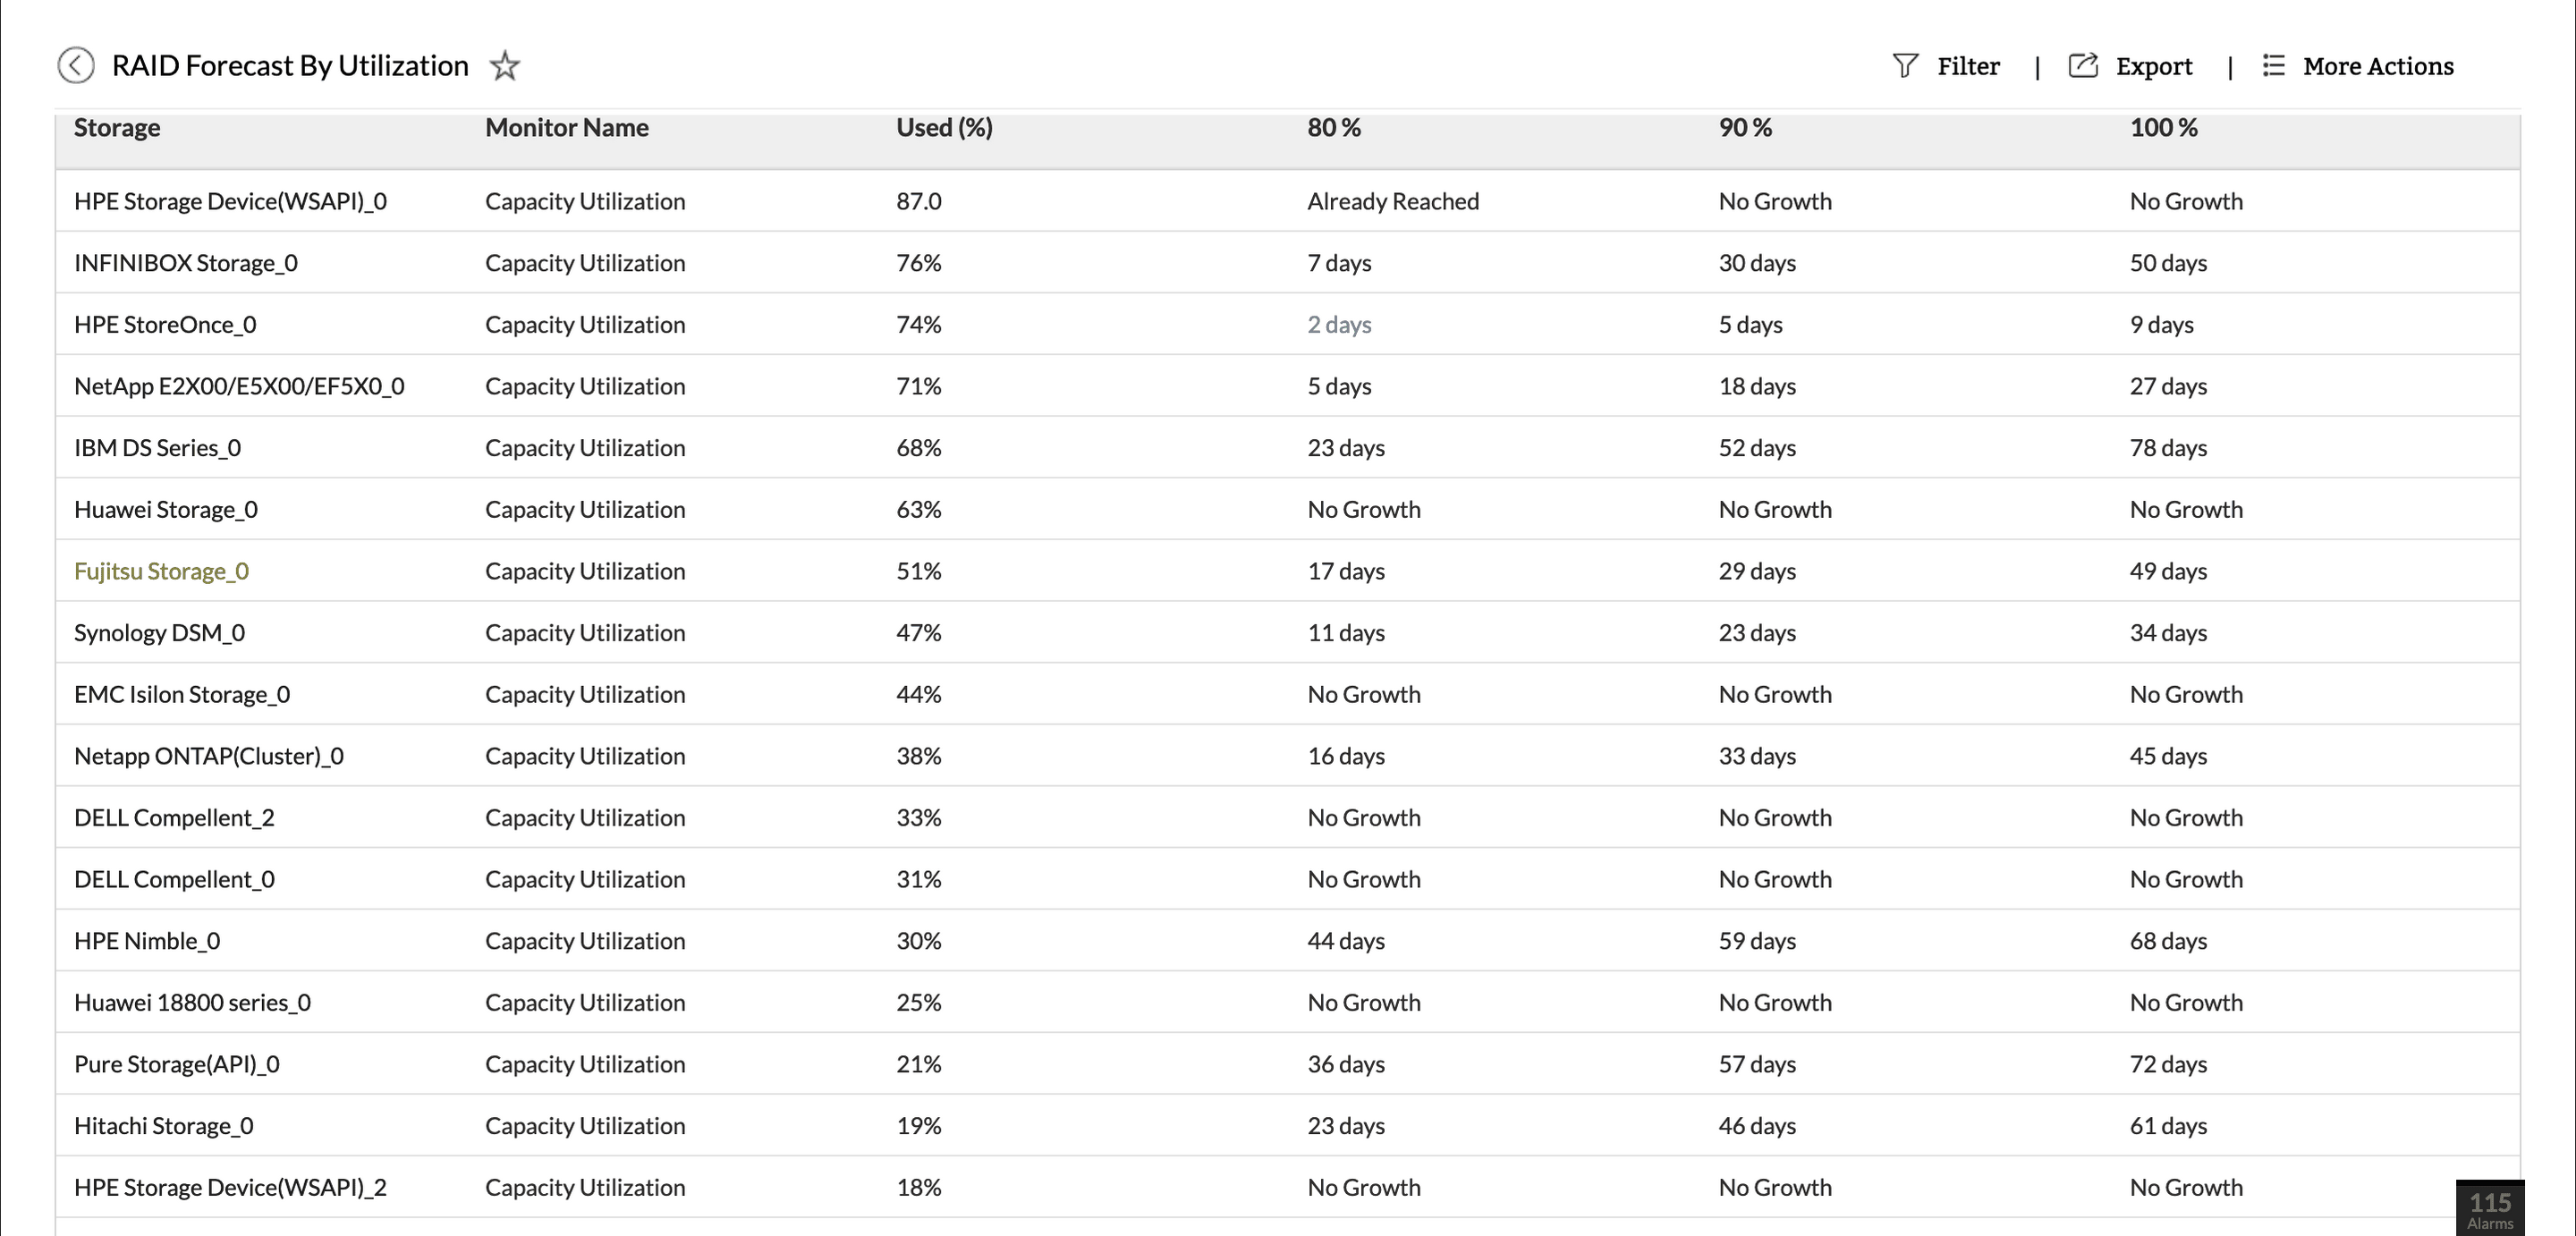
OpManager equips you to stay one step ahead of storage capacity concerns by forecasting the exact number of days left till your storage devices are at 80%, 90%, and full capacity. OpManager's in-built AI-engine ingests monitored data and analyzes storage usage trends to perform accurate forecasts.
Manage storage usage across storage devices and networks
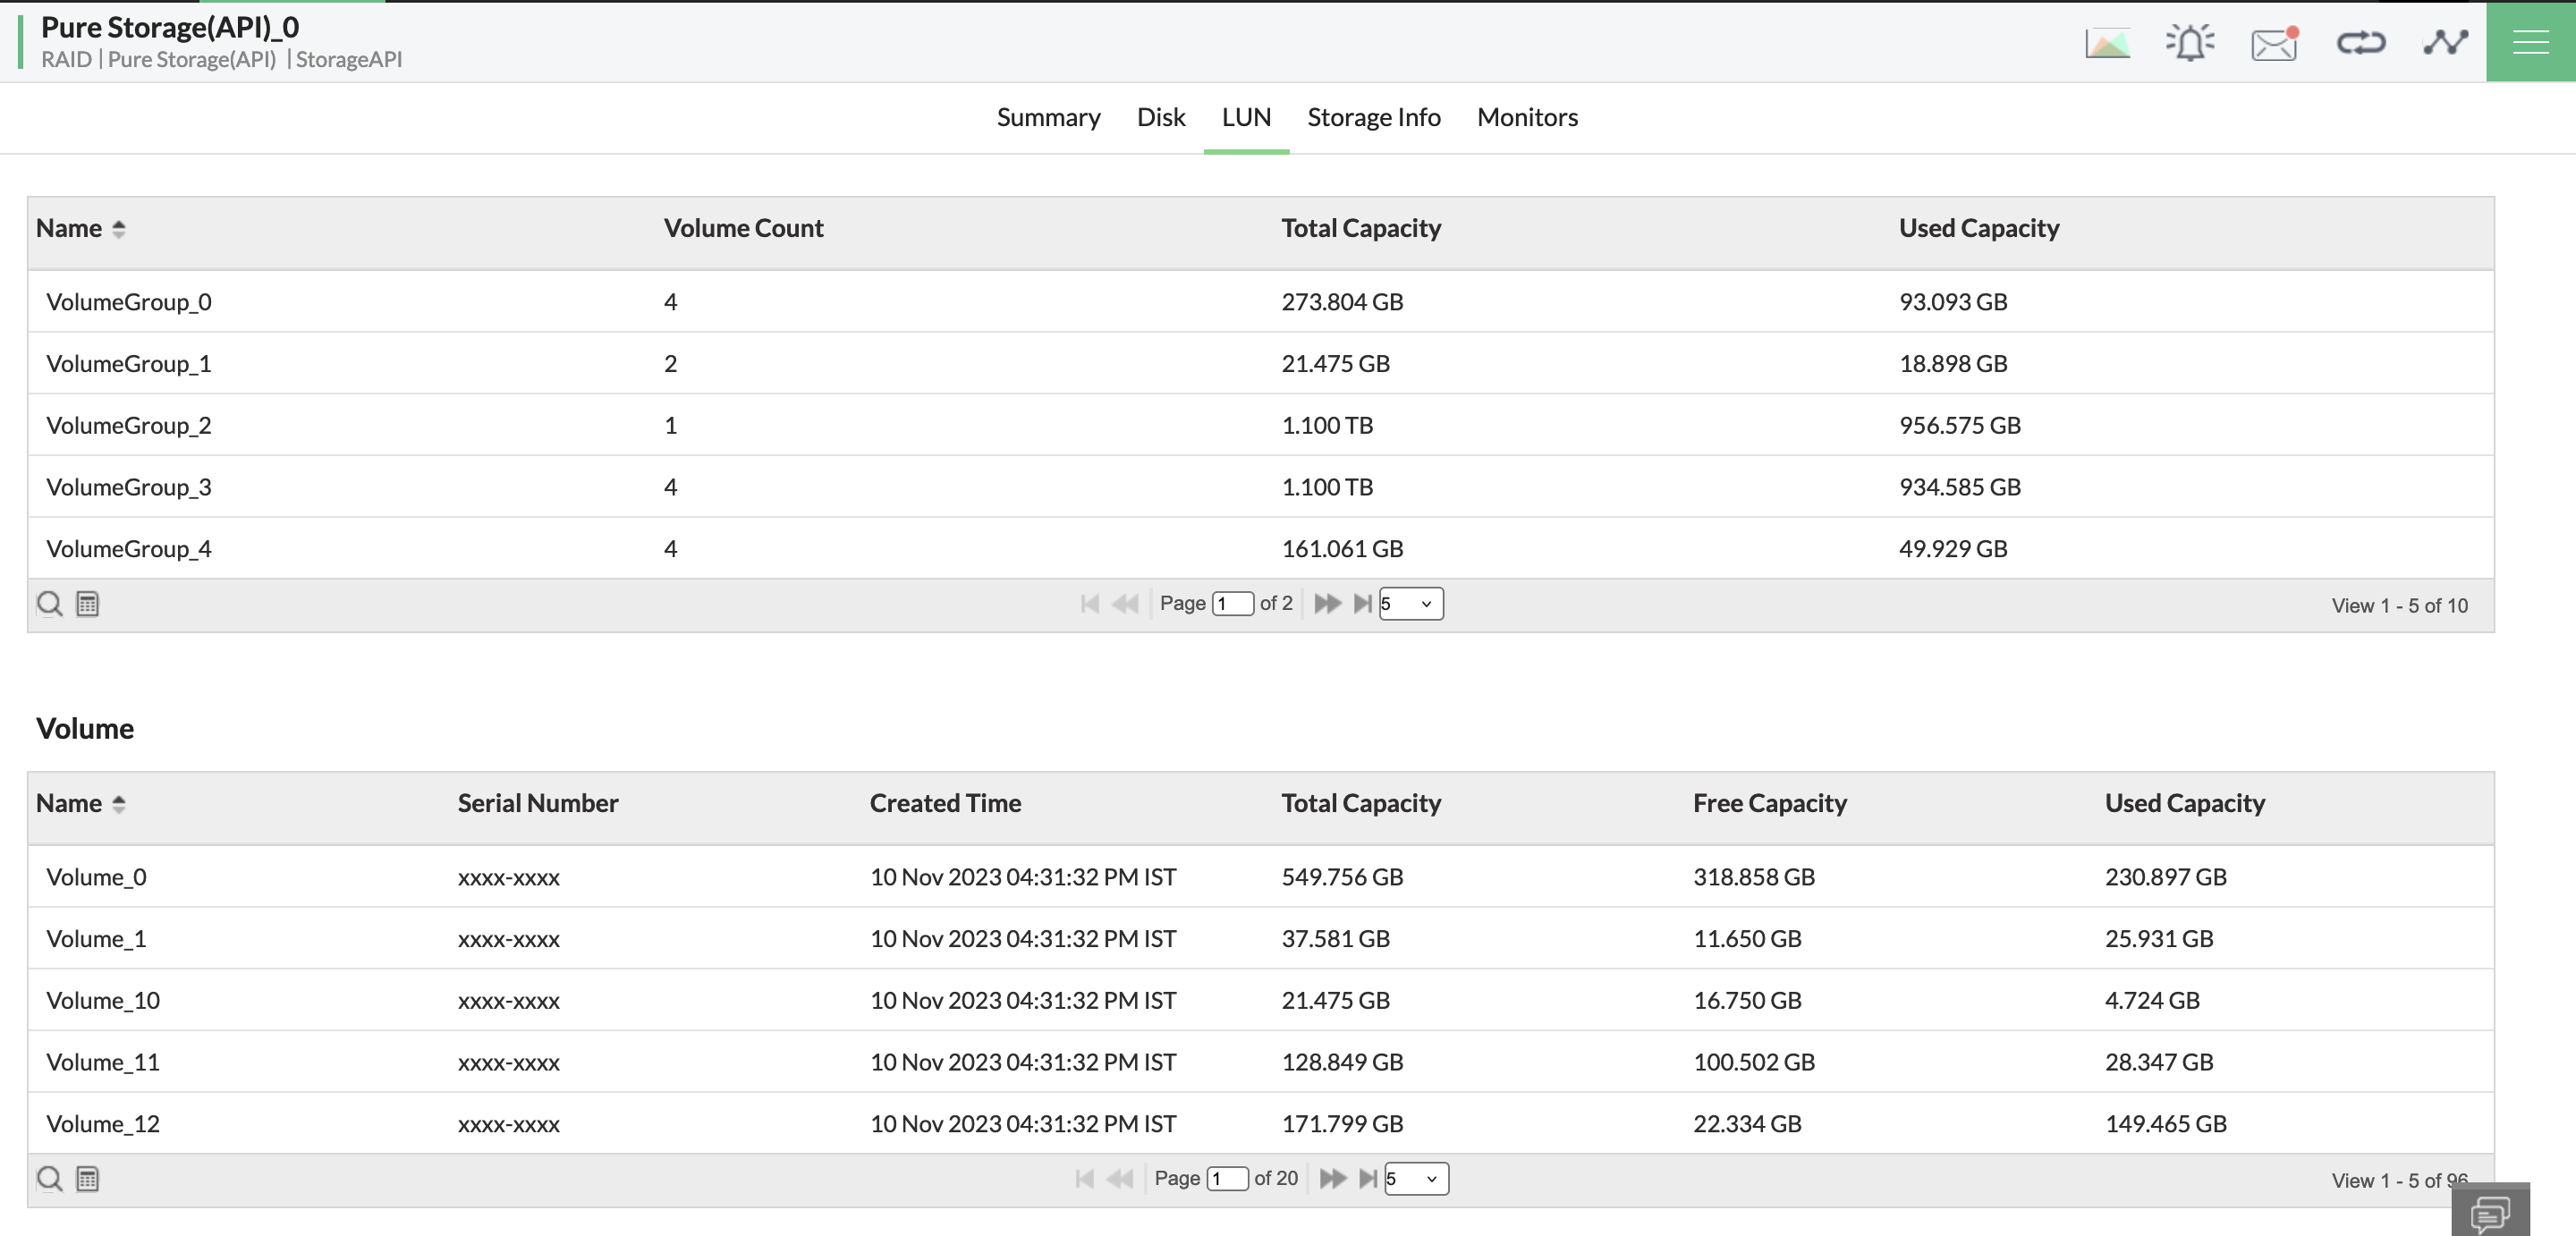
Storage resources are often spread across host devices, networks, datacenters, sites, and cloud infrastructure. OpManager helps manage these storage arrays with visibility into the physical disks and logical unit numbers (LUNs). Storage resources are classified based on their vendor, type, and category, and listed with their disks, LUNs, ports, and hardware components.
Resolve storage issues with automatic incident response
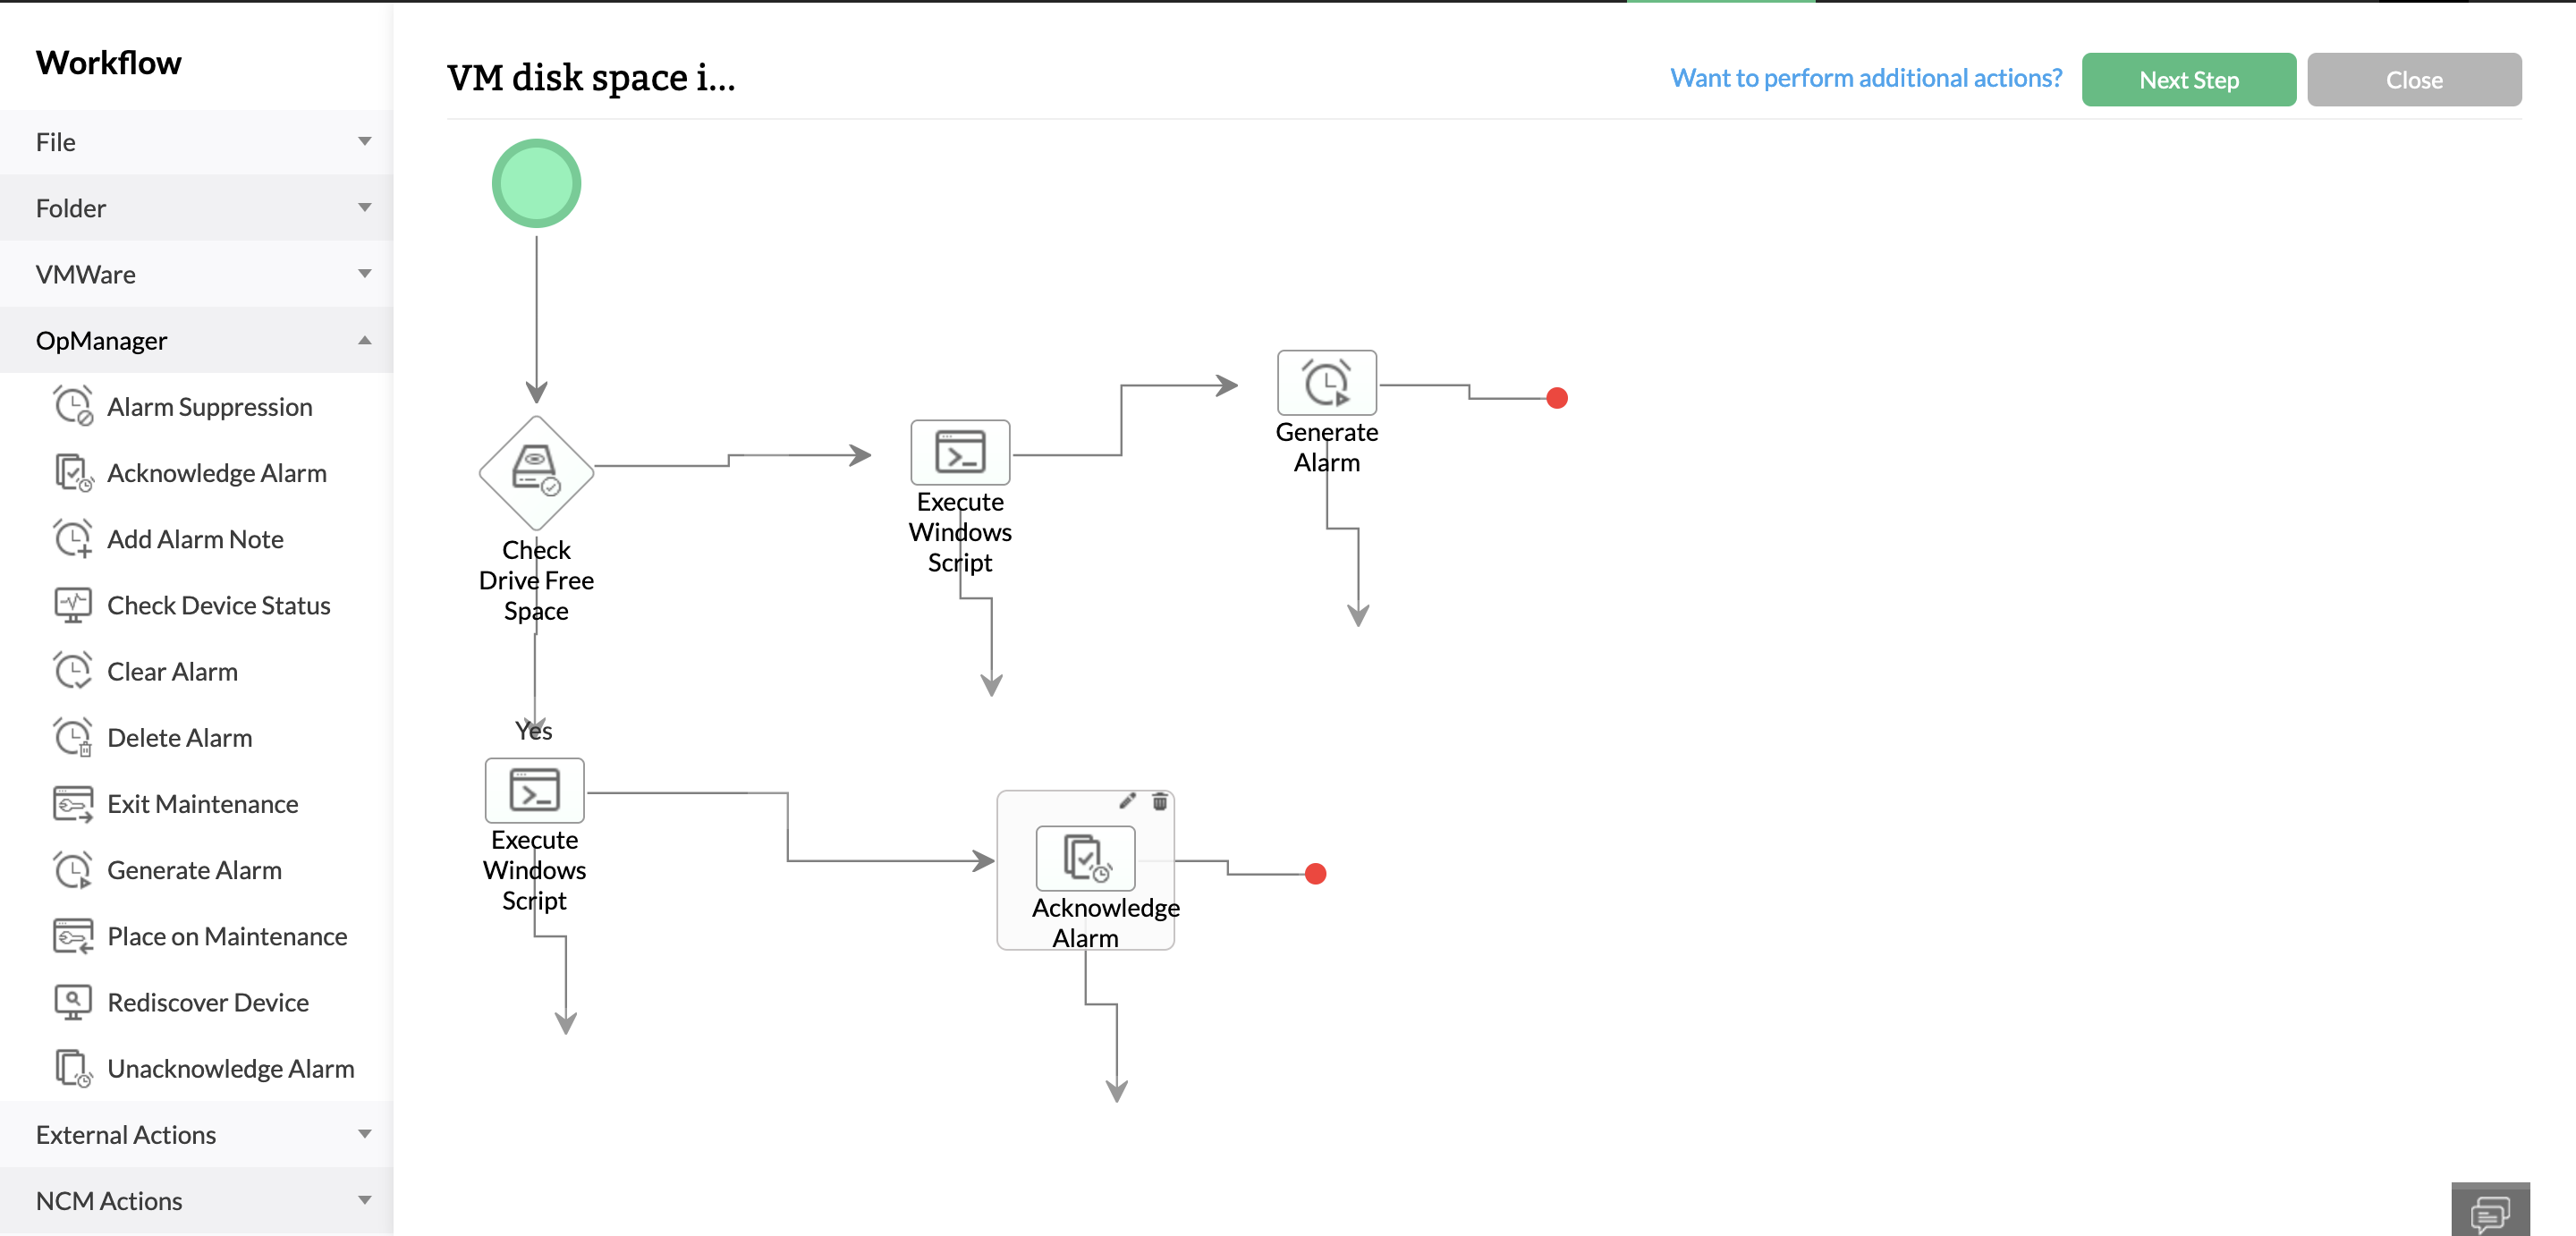
Automation tools can help prevent lengthy outages by executing first level troubleshooting actions and service management workflows. OpManager has over 70 conditional actions which can be dragged and dropped to create automated workflows. Workflows can be triggered by alarms or schedules, and perform actions like checking device reachability, executing scripts, restarting down services, spinning up or suspending VMs, or raising tickets in ITSM tools to specified teams of technicians.
Analyze storage performance with dashboards and reports
Dashboards and reports enable more convenient visualization and dissemination of monitored data. OpManager has a dedicated dashboard view, NOC views, and storage reports for insights like storage usage across disks, devices that are over or under-utilizing resources, and forecasted storage trends. You can also build your own reports by combining monitored metrics, customize dashboard views, and create NOC views by adding reports, maps, real-time graphs, and widgets.
Monitor IT. Anytime, Anywhere!
Monitoring storage performance 24/7 is no easy task, especially for businesses offering services worldwide. With OpManager's mobile application, your role as an IT admin is easier because you can receive push notifications, set up home screen widgets for critical storage infrastructure, review alarms and dashboards, acknowledge issues, and direct other network technicians from your iPhone or Android smartphone.

Loved by customers all over the world
“Easy Implementation, Excellent support & Lower Cost Tool - Team Lead, IT Services Industry”
Reviewer Role: Infrastructure and Operations
Company size: 500M - 1B USD
We have been using OpManager since 2011 and our overall experience has been excellent. The tool plays a vital role in providing the value to our organization and to the customers we are supporting. The support is excellent and staff takes full responsibilities in resolving the issues. Innovation is never stopping and clearly visible with newer versions.
“OpManager - 10 steps ahead of the competition, one step away from being unequaled - Network Services Manager, Government Organization”
Reviewer Role: Infrastructure and Operations
Company size: 5,000 - 50,000 Employees
I have a long standing relationship with ManageEngine. OpManager has always missed one or two features that would make it truly the best tool on the market, but over it is the most comprehensive and easy to use the product on the market.
“Easy Implementation with a feature rich catalogue, support has some room for improvement - NOC Manager, IT Services Industry”
Reviewer Role: Program and Portfolio Management
Company size: 500M - 1B USD
The vendor has been supportive during the implementation & POC phases providing trial licenses. Feature requests and feedbacks is usually acted upon swiftly. There was sufficient vendor support during the implementation phase. After deployment, the support is more than adequate, where the vendor could make some improvements.
“Great Monitoring tool - CIO in Finance Industry”
Reviewer Role: CIO
Company size: 1B - 3B USD
ManageEngine provides a suite of tools that have made improvements to the availability of our internal applications. From monitoring, management and alerting, we have been able to peak performance within our data center.
“Simple Implementation, Easy To Use. Very Intuitive. - Principle Engineer in IT Services”
Reviewer Role: Enterprise Architecture and Technology Innovation
Company size: 250M - 500M USD
ManageEngine support was responsive to all our queries.

“OpManager helps me monitor all aspects of the data-center and equipment like servers, switches and routers. It is fast, intuitive and centralized and you do not need to be an expert to deal with OpManager.”
Altaleb Alshenqiti
NGHA

“Donald Stewart, IT Manager of Crest Industries is happy with ManageEngine OpManager for its end-to-end network monitoring software. It is easy-to-use and offers fault and performance management for router.”
Donald Stewart
IT Manager, Crest Industries

“John Rosser, MIS Manager of Yale Chase talks about the proactive nature of ManageEngine OpManager & how his organisation gained value from it.”
John Rosser
MIS Manager