Features to look for in a server monitoring solution
Availability
Monitor your server's availability with user-defined polling intervals, which can be set based on the criticality of the server.
Performance
Proactively monitor critical server metrics like CPU, memory, disk utilization, using protocols like SNMP, WMI, CLI etc.
Intuitive dashboard
Customizable dashboard solely dedicated to your server infrastructure, with re-arrangable widgets.
Curated workflows
Automate routine maintenance and repetitive troubleshooting with predefined workflows.
Feature-rich server monitoring solution for every network-dependent business
ManageEngine's versatile monitoring solutions offer a bundle of network monitoring tools and powerful features. Whether you're managing web servers, application servers, virtual servers, mail servers, or database servers, drill down to critical server metrics and monitor all of them in just a few clicks. Monitor your Windows, Linux, Domain Controllers, Exchange, MSSQL, and IPMI servers from a single console.
Critical metrics to be monitored in servers
Availability
Availability ensures the server infrastructure is functioning continuously without any failure. Uptime in servers is crucial as they contain significant database.
Response time
Response time is the time taken by a data packet to travel from a source device to destination device. A late response from a server isn't a sign of a healthy server.
Performance
Critical metrics like CPU utilization, memory utilization, disk utilization, device partition details, etc should be checked from time to time to keep the servers in good performance.
Process count
Monitor the number of processes running on your server everyday to ensure quality control and to maintain the servers efficiently.
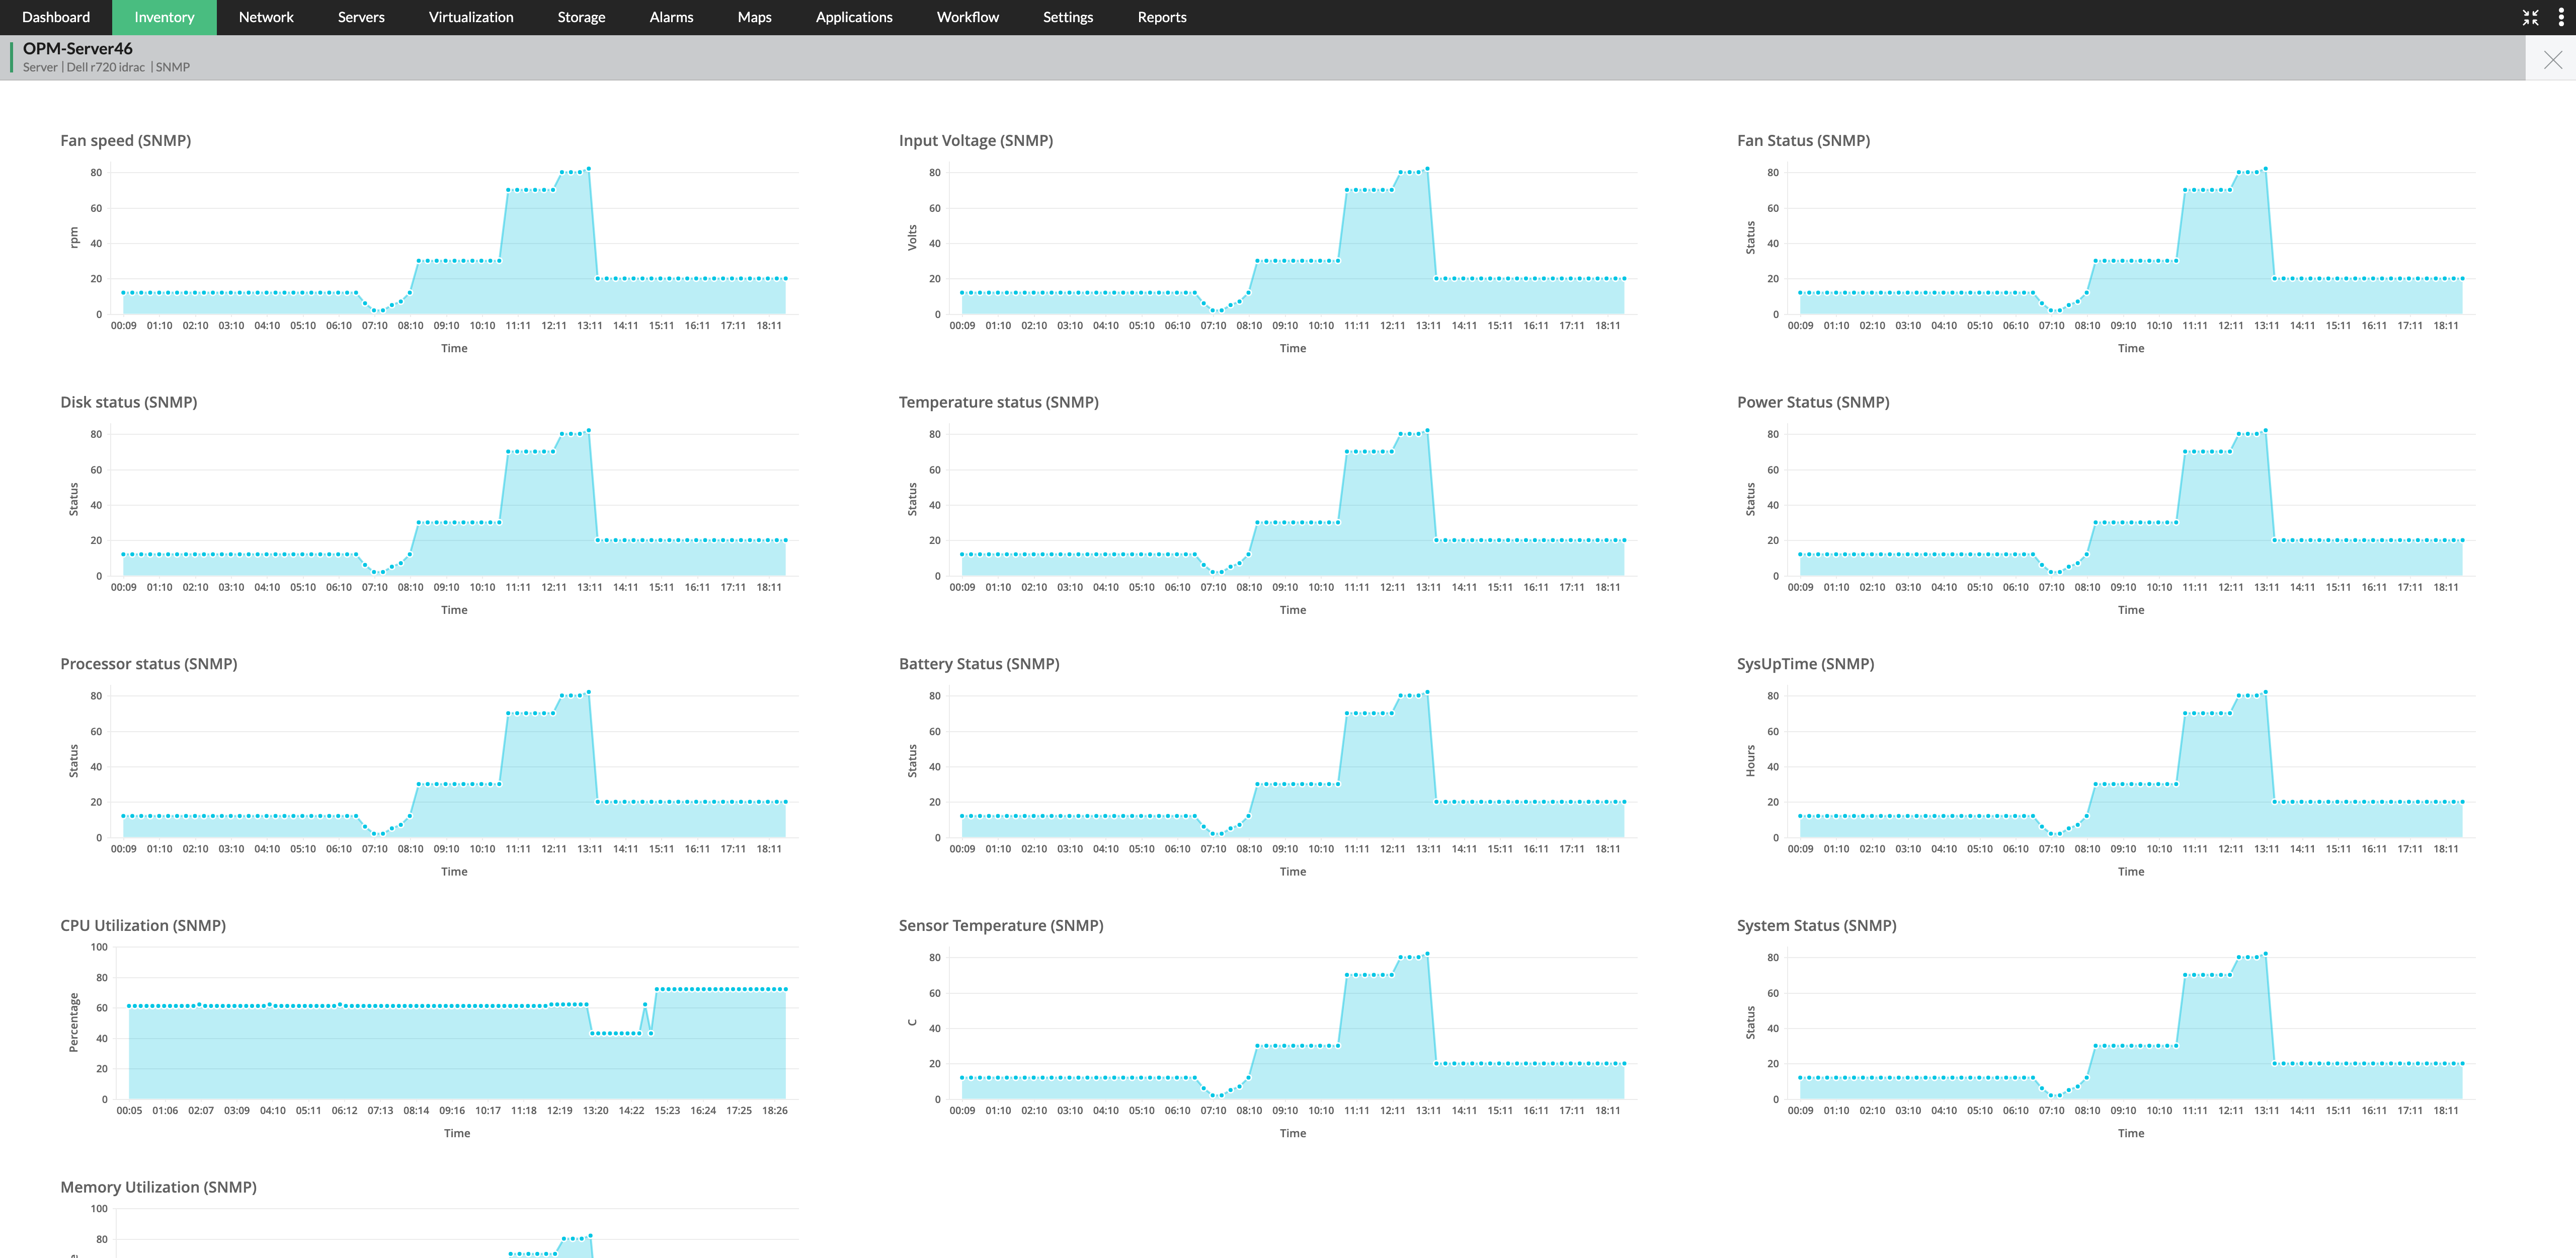
Hardware metrics
Servers emit high temperatures and hence maintaining the hardware health is crucial. Keeping the fan speed, power, temperature, battery etc in check is essential to help servers perform well.
Services
Monitor all the services running on the servers in background like TCP port service, MS Exchange services, MS SQL services etc.
OpManager's key features that help improve your server performance
Real-time server monitoring
Proactively track server health, performance, and availability. Monitor 300+ critical metrics in real time. Customize polling intervals based on server criticality. Dedicated color-coded dials display availability, packet loss, response time, CPU, memory, and disk utilization performance.
Extensive multi-vendor support for servers
Monitor 130+ server vendors and 11,000+ device types (including Microsoft, Cisco, HP, Dell, VMware, and more). Utilize pre-defined performance monitors to track server CPU, memory, disk utilization, and active memory.
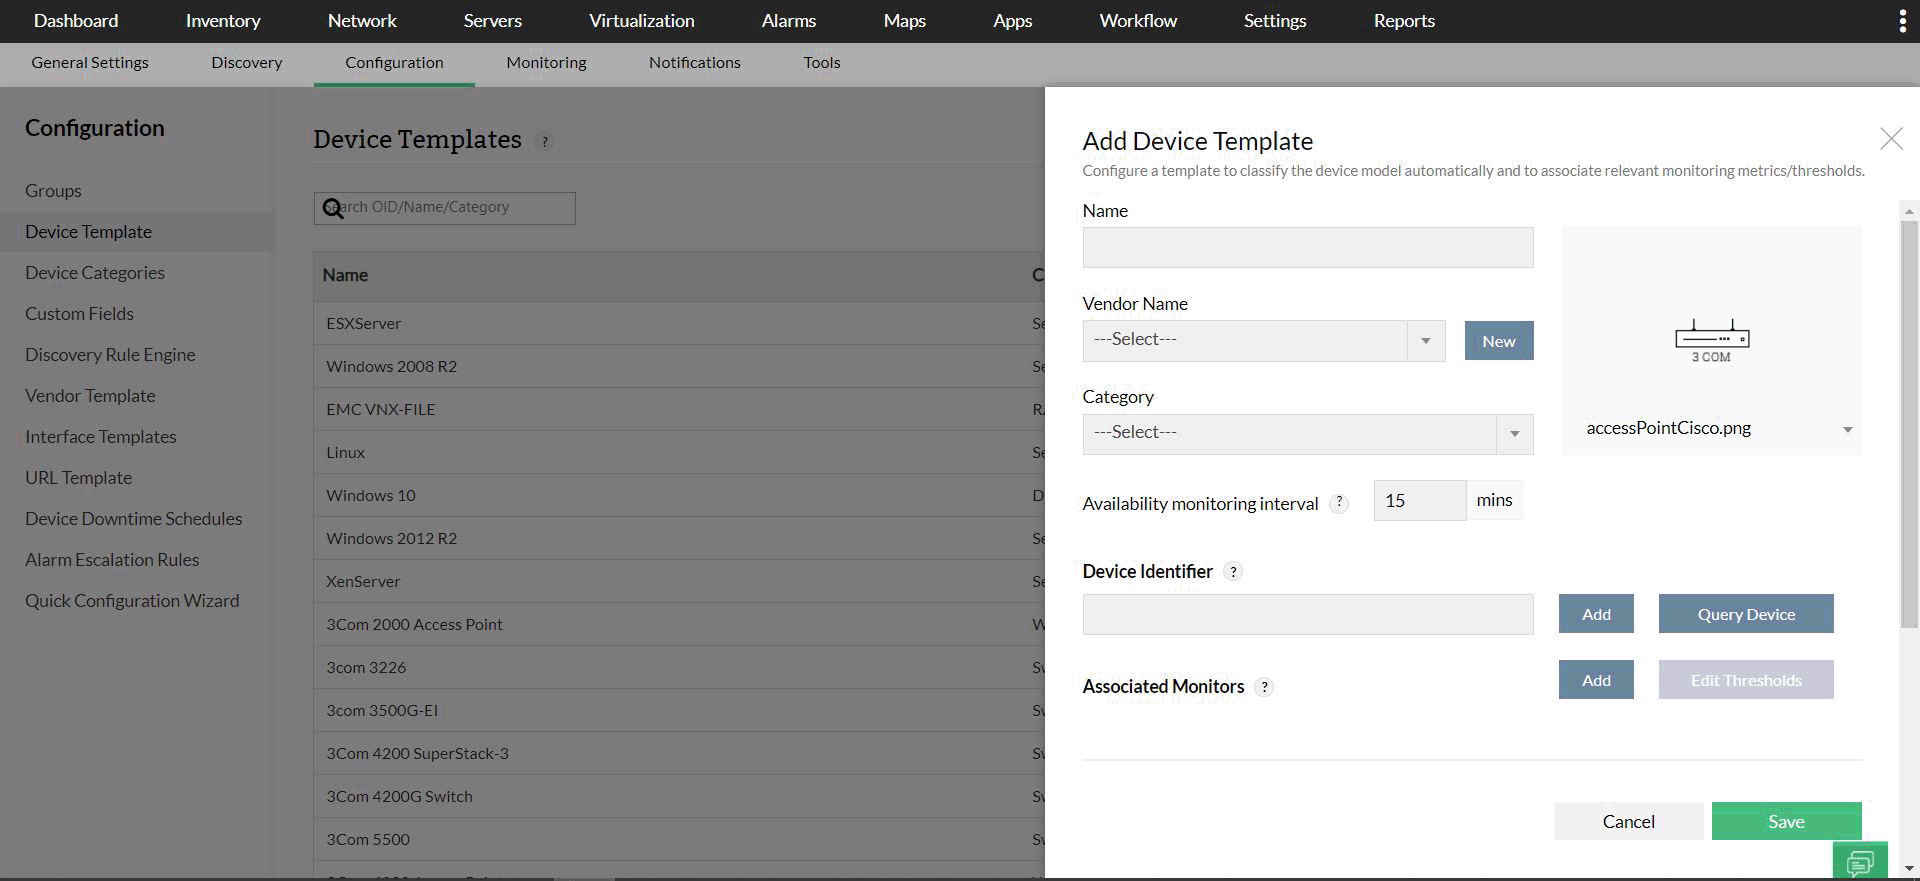
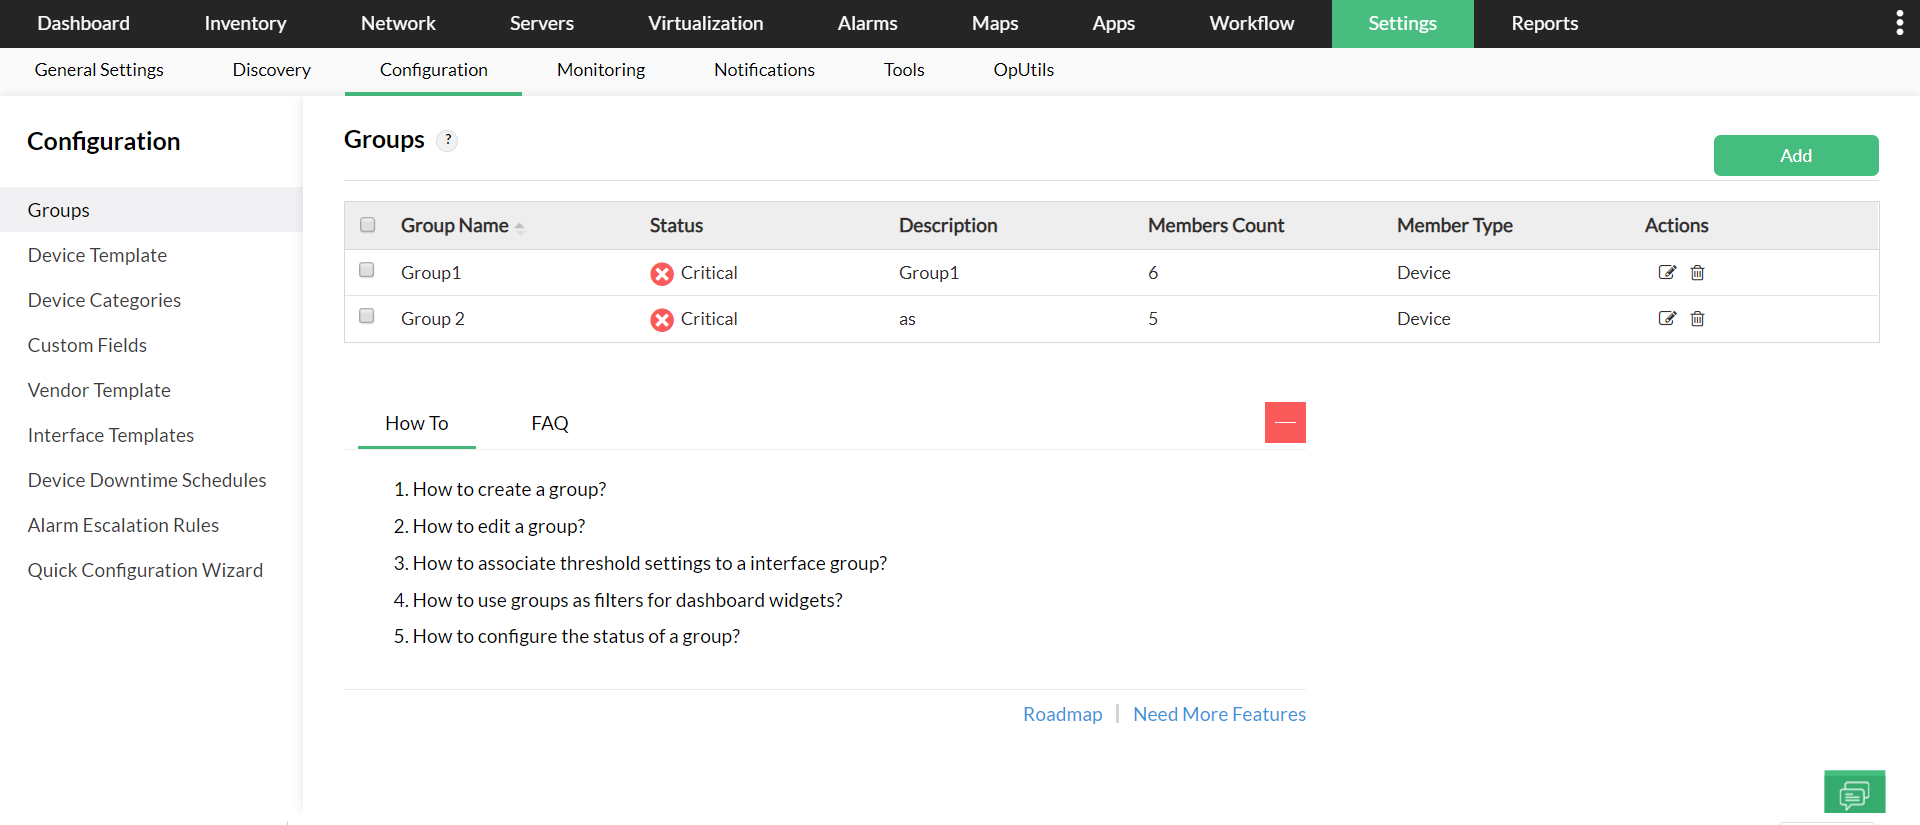
Bulk configuration changes
Manage configurations across multiple servers simultaneously using groups, device templates, and vendor templates. Push or delete specific changes across many servers via these features, leveraging device/vendor templates or groups defined by location, device type, or custom criteria.
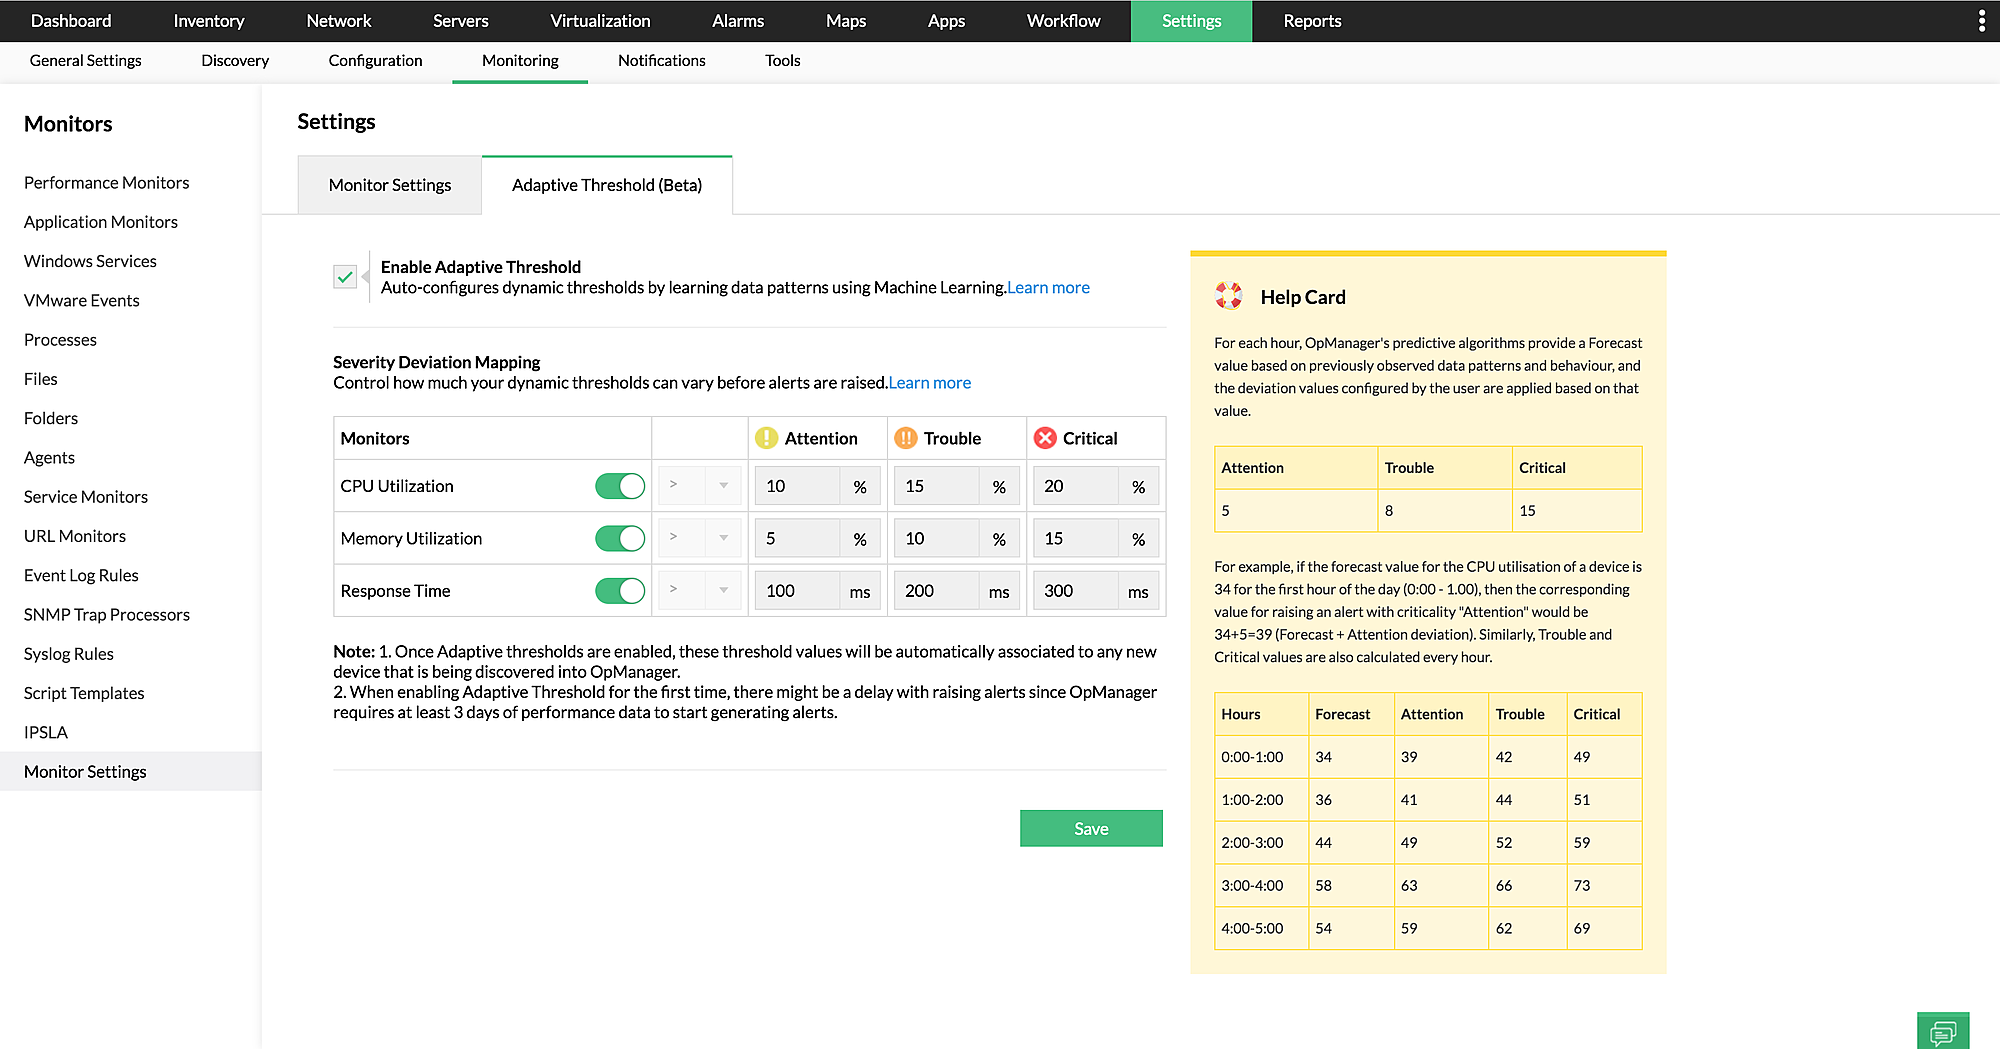
Multi-layered adaptive thresholds
AI/ML-powered adaptive thresholds predict reliable forecasts for performance metrics like CPU/memory utilization, and response time based on real-time server data, enabling proactive monitoring. Configure notification profiles to receive alerts via SMS, email, Slack, Telegram, ServiceDesk Plus, Jira, etc.
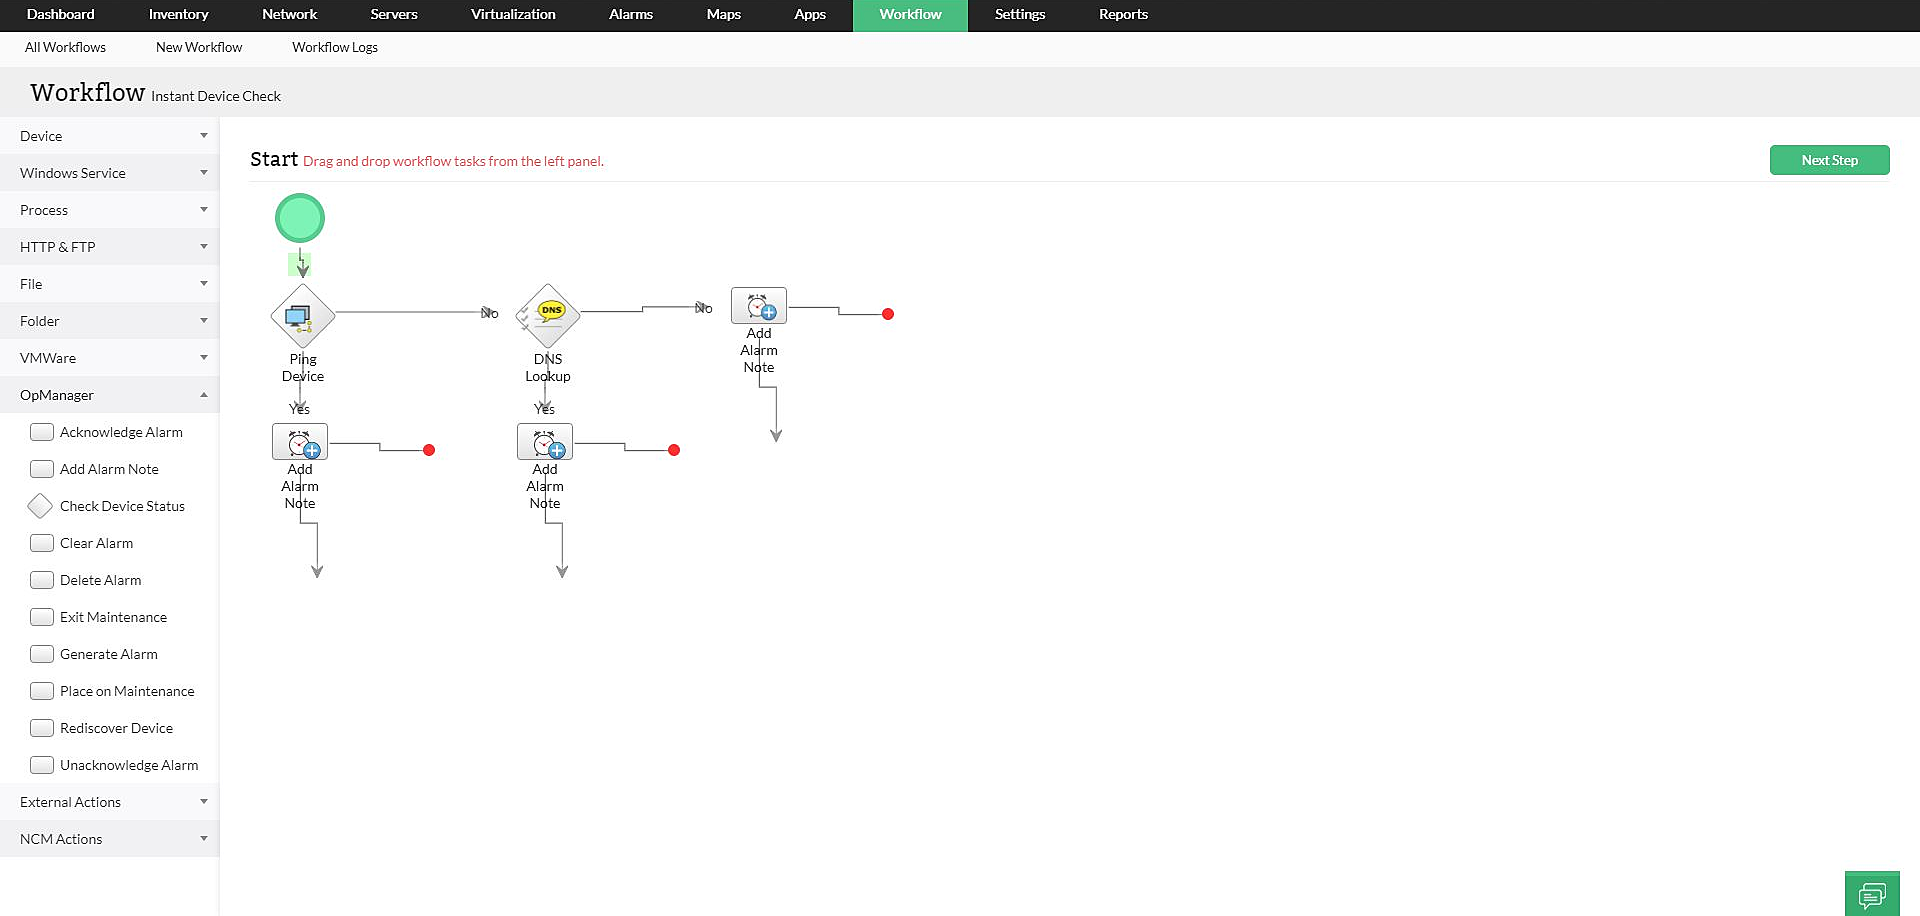
Automated fault management in servers
Curated workflows with 70+ pre-defined actions enable network administrators to effortlessly perform repetitive maintenance and troubleshoot network/server issues. From periodic server checks to instant error resolution, these workflows automate pre-defined action flows, helping administrators excel at server monitoring with no-code automation.
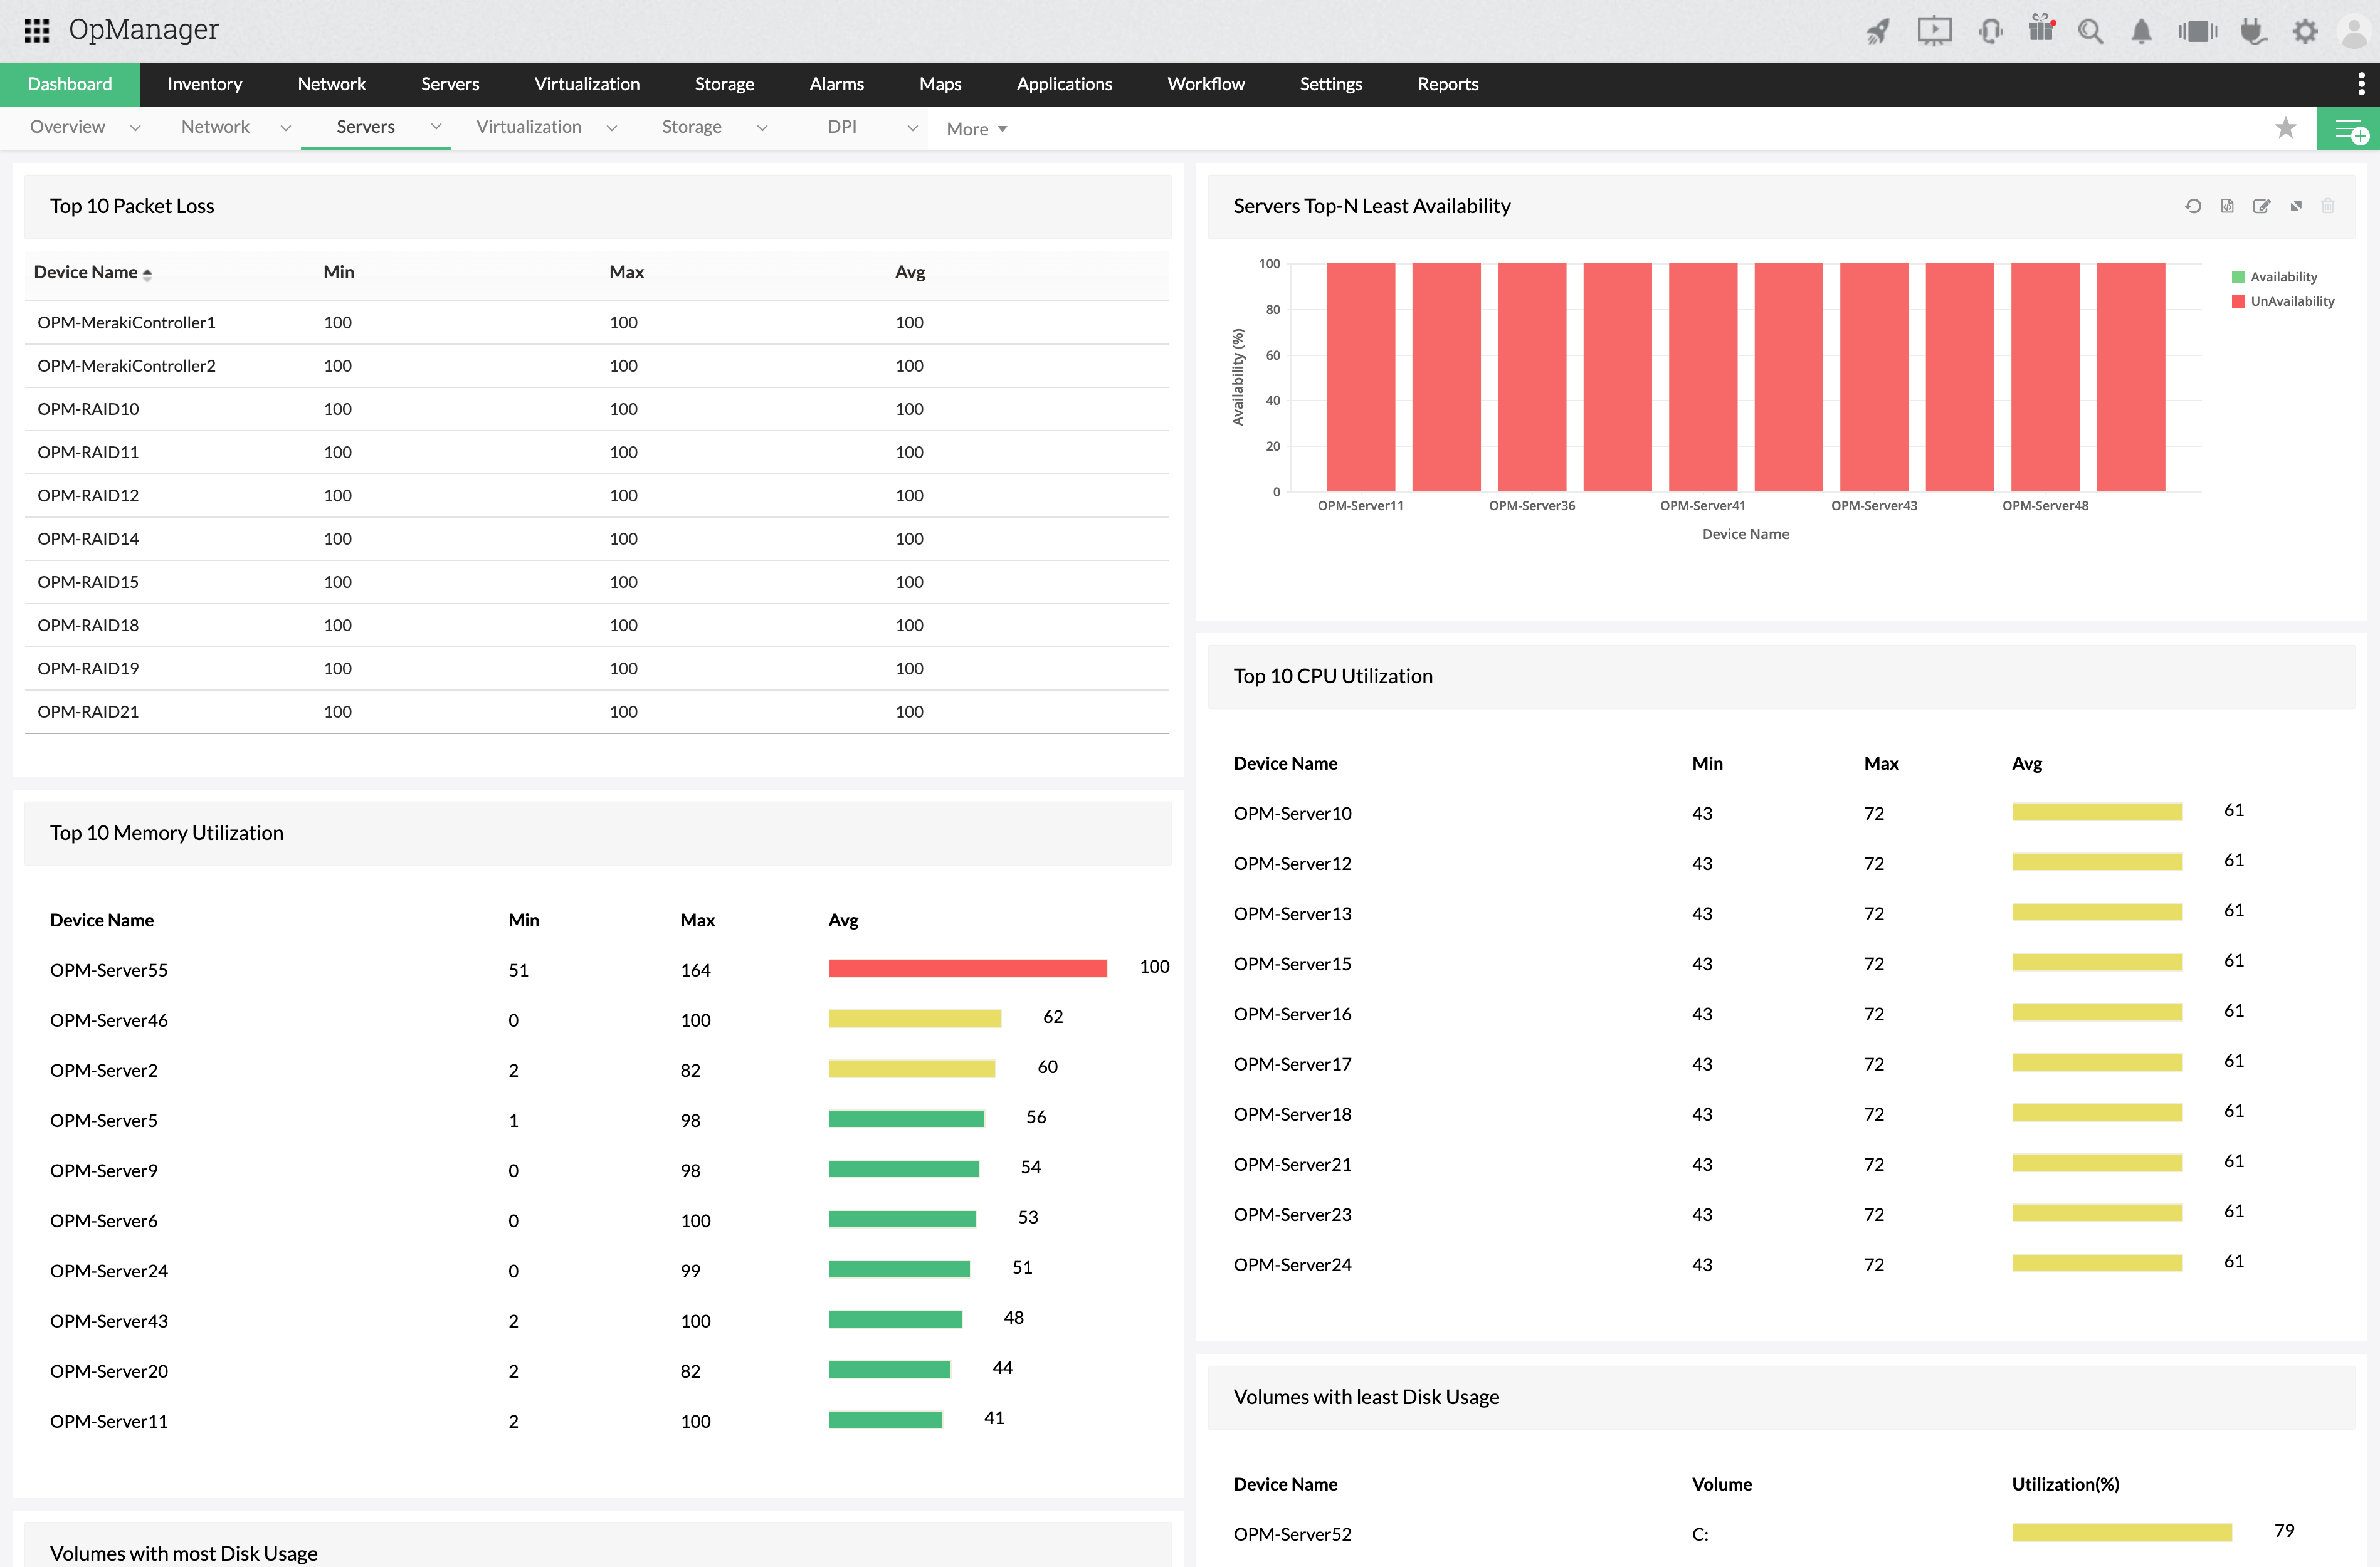
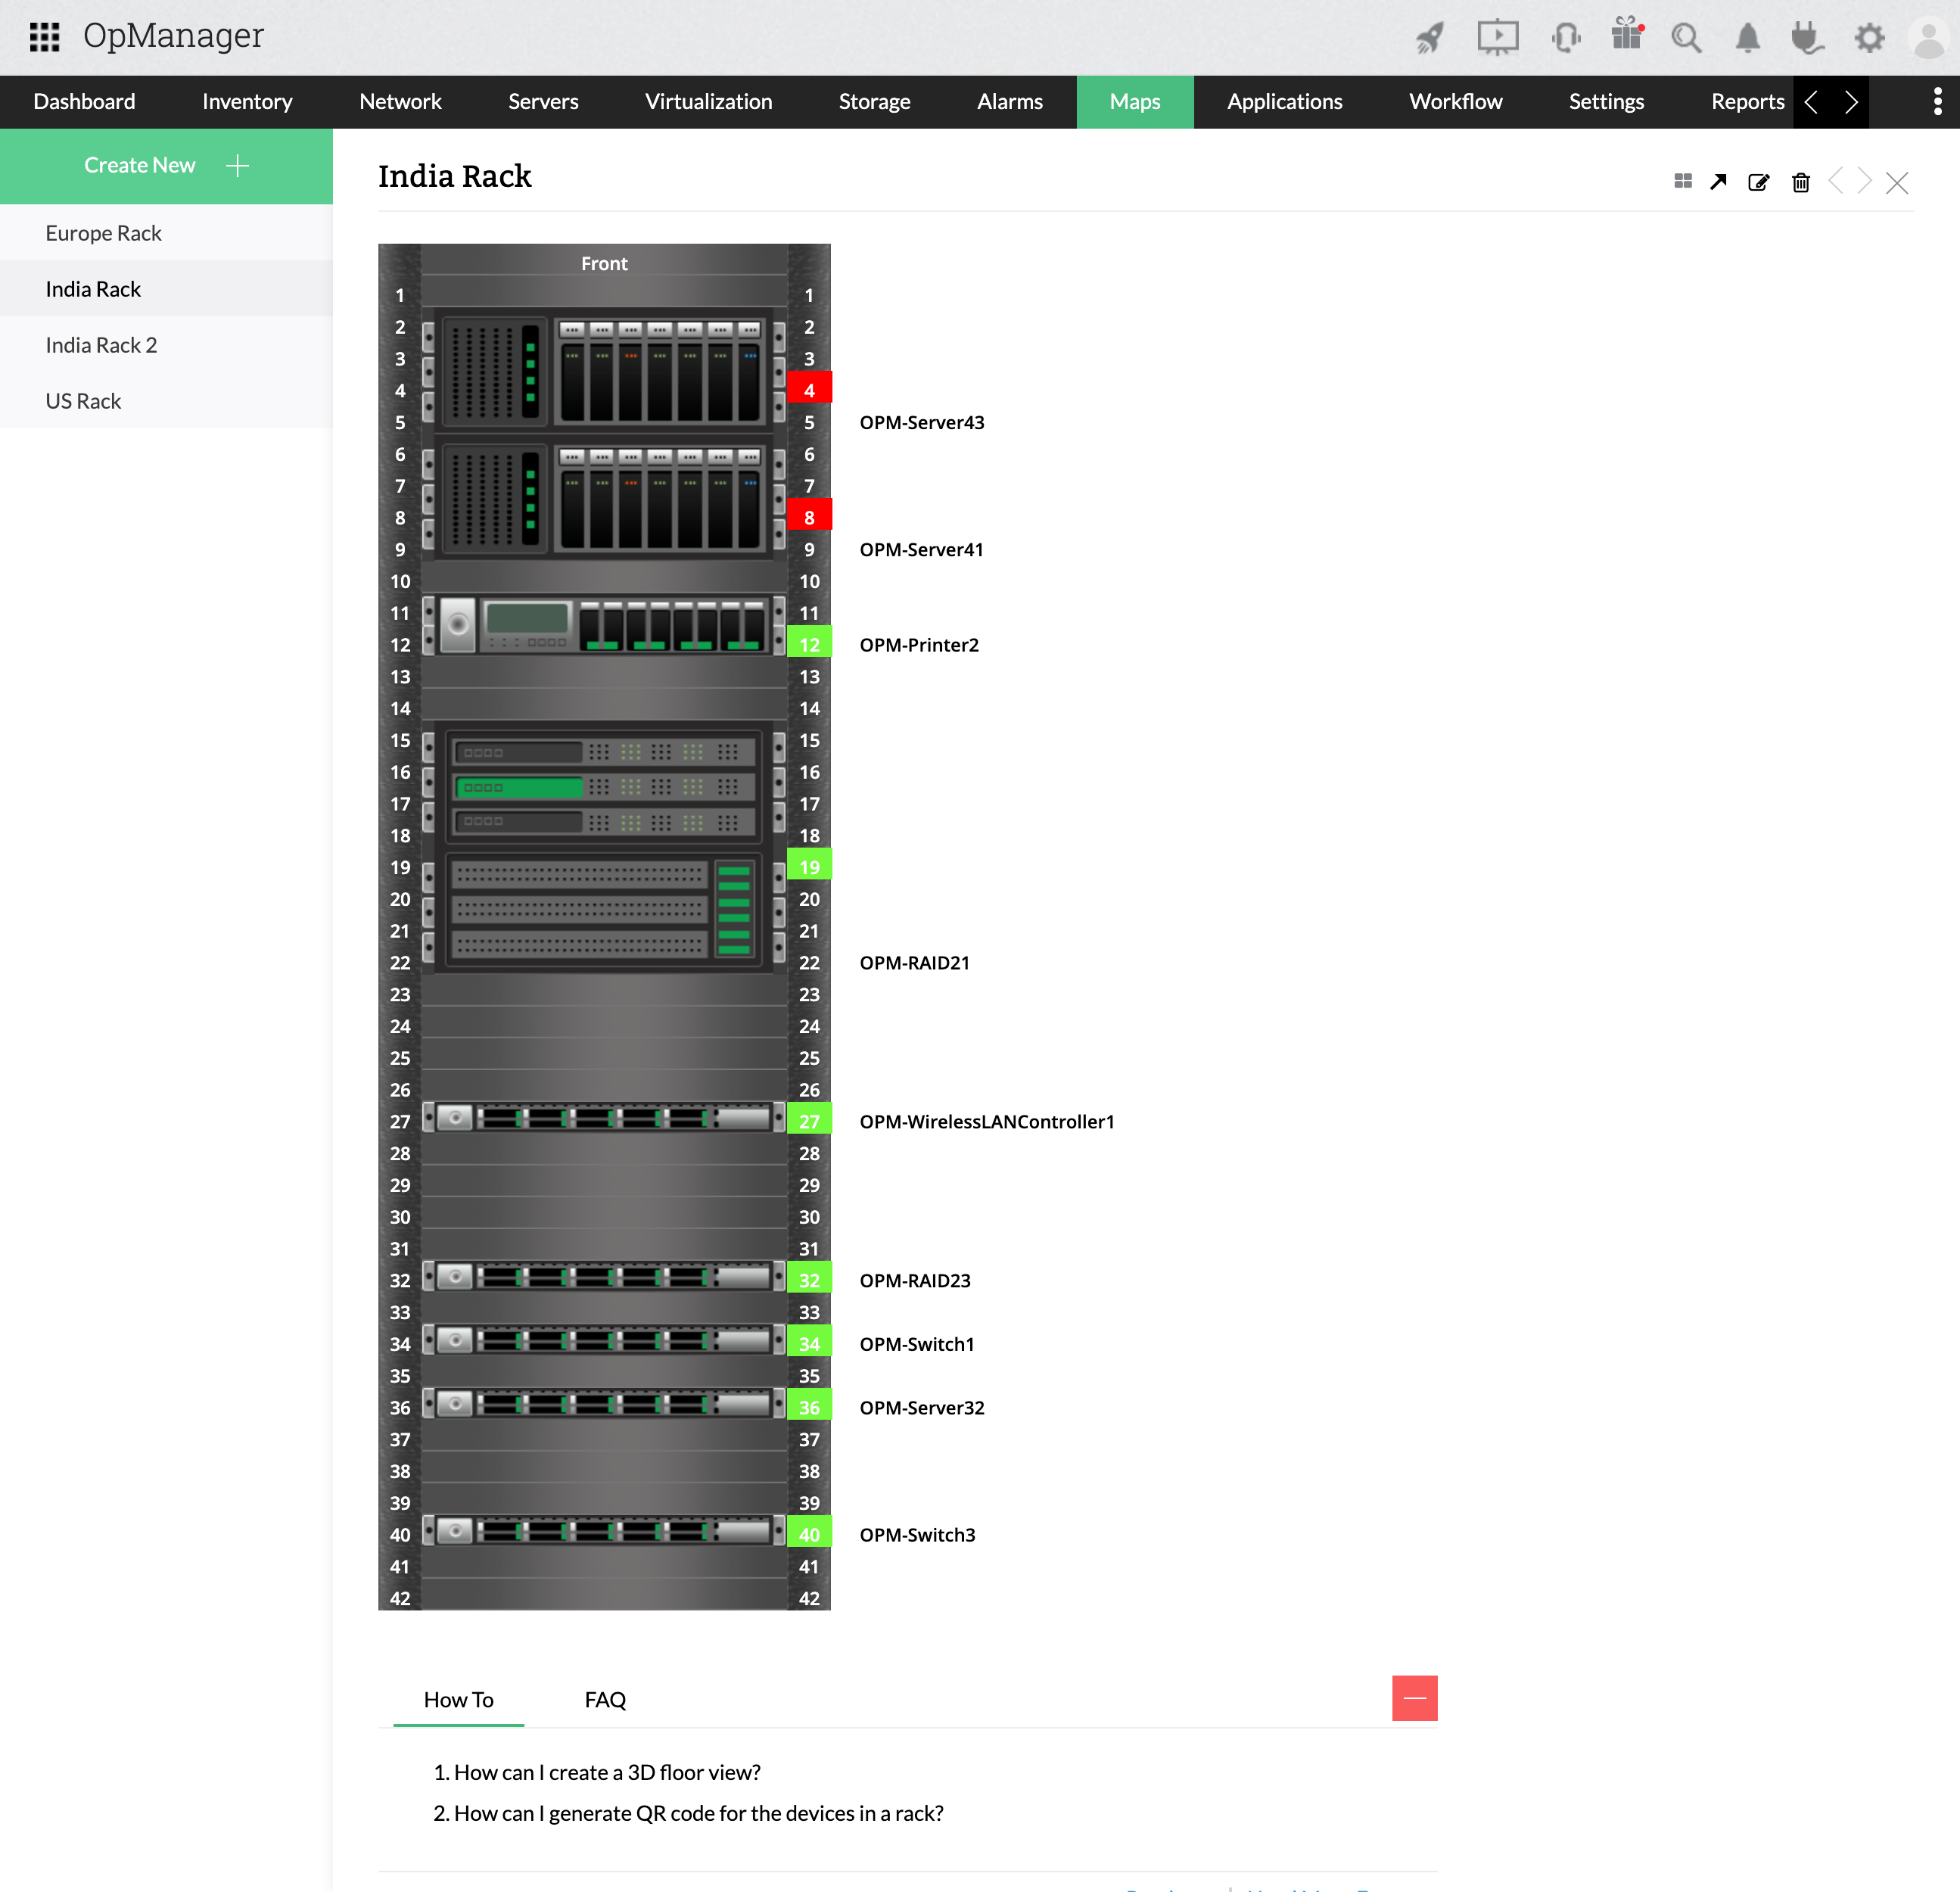
In-depth visibility into server infrastructure
Visualization techniques like Business Views, Maps, Layer2 Maps, and Rack/3D Floor Views provide a comprehensive network layout understanding within a single view. They highlight every server layer, enabling virtual server room replicas for at-a-glance status and availability. The customizable dashboard further displays the server environment with rearrangeable widgets.
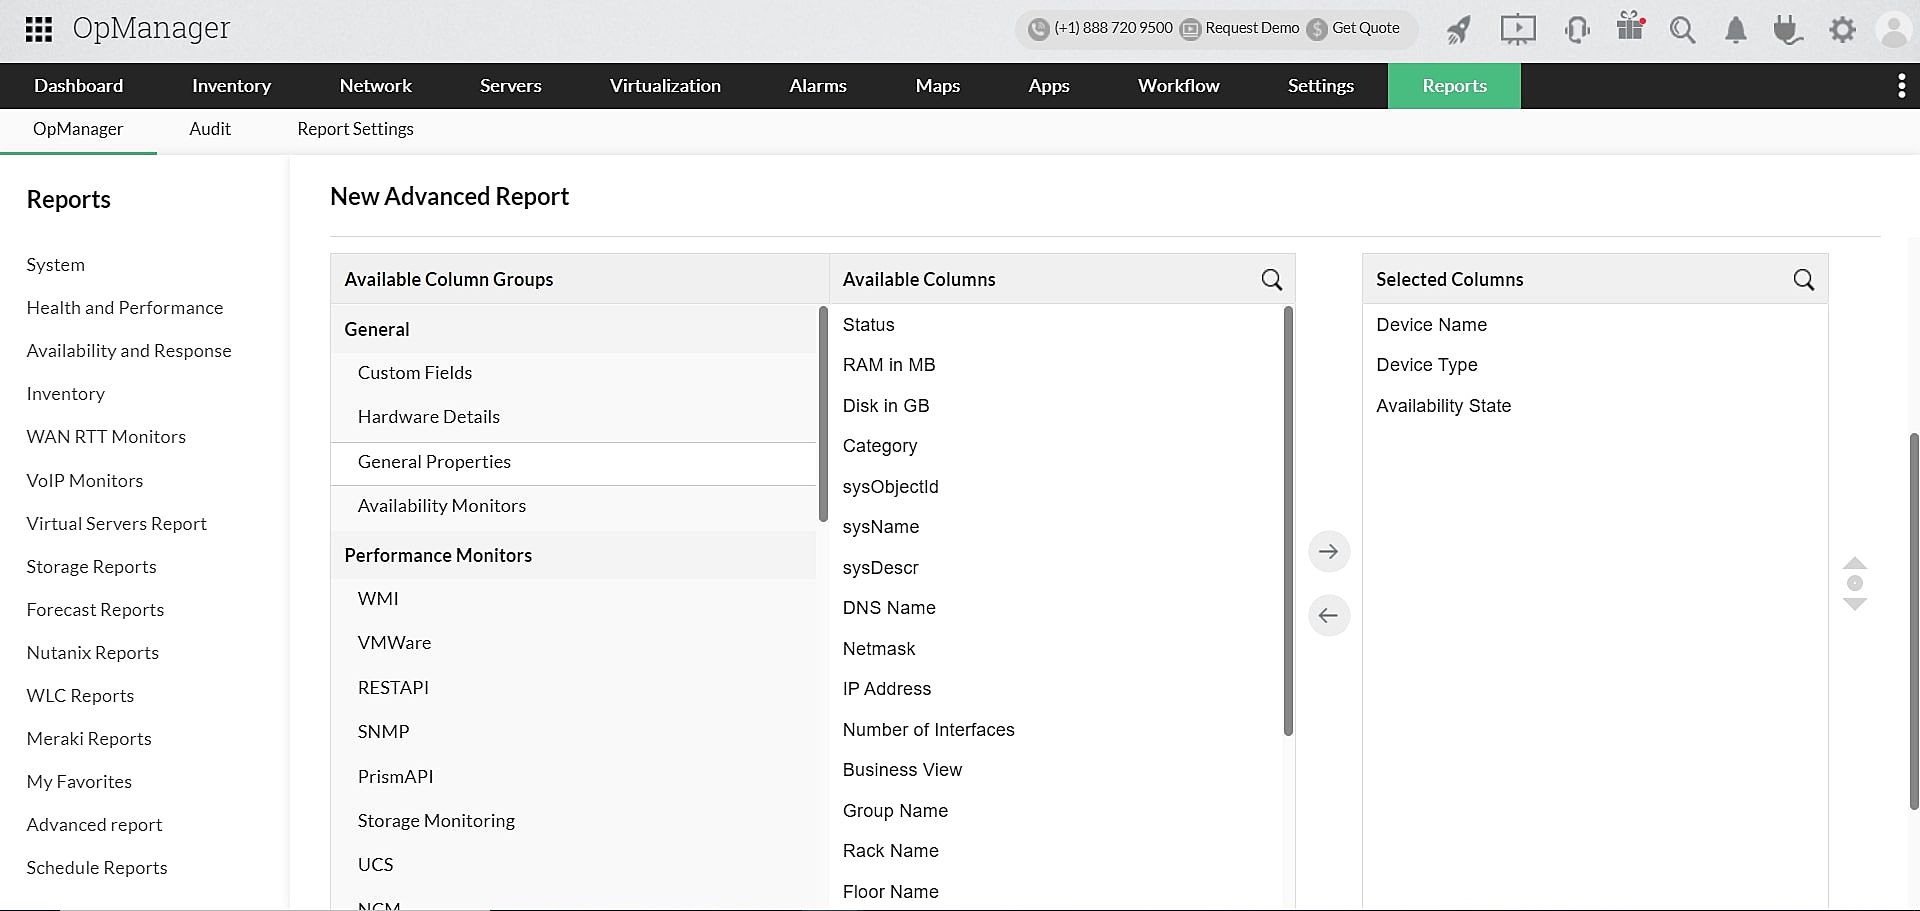
Granular server-related reports
Generate and schedule detailed reports for better data insights. Reports provide deep visibility into server performance, health, availability, response time, virtual servers, and more. Utilize advanced report features to drill down into specific metrics or correlate metric groups.