1 Million and Counting

Saint Gobain
NASA
Time Warner Cable
Loreal Paris
Siemens
DHL

Connect VM, host, and storage performance with OpManager

Virtual environments are dynamic: VMs move, workloads shift, and resources get overcommitted leading to hidden issues like latency and contention. The challenge is that symptoms rarely reveal the root cause; a slow VM may appear as high CPU usage but stem from resource contention or storage bottlenecks. Most tools lack context, forcing teams to switch between layers and delaying resolution. ManageEngine OpManager connects VM, host, and storage metrics in a single view, helping teams quickly identify root causes and resolve issues faster without manual correlation.

Prevent VM slowdowns in VMware & Hyper-V by watching the host layer

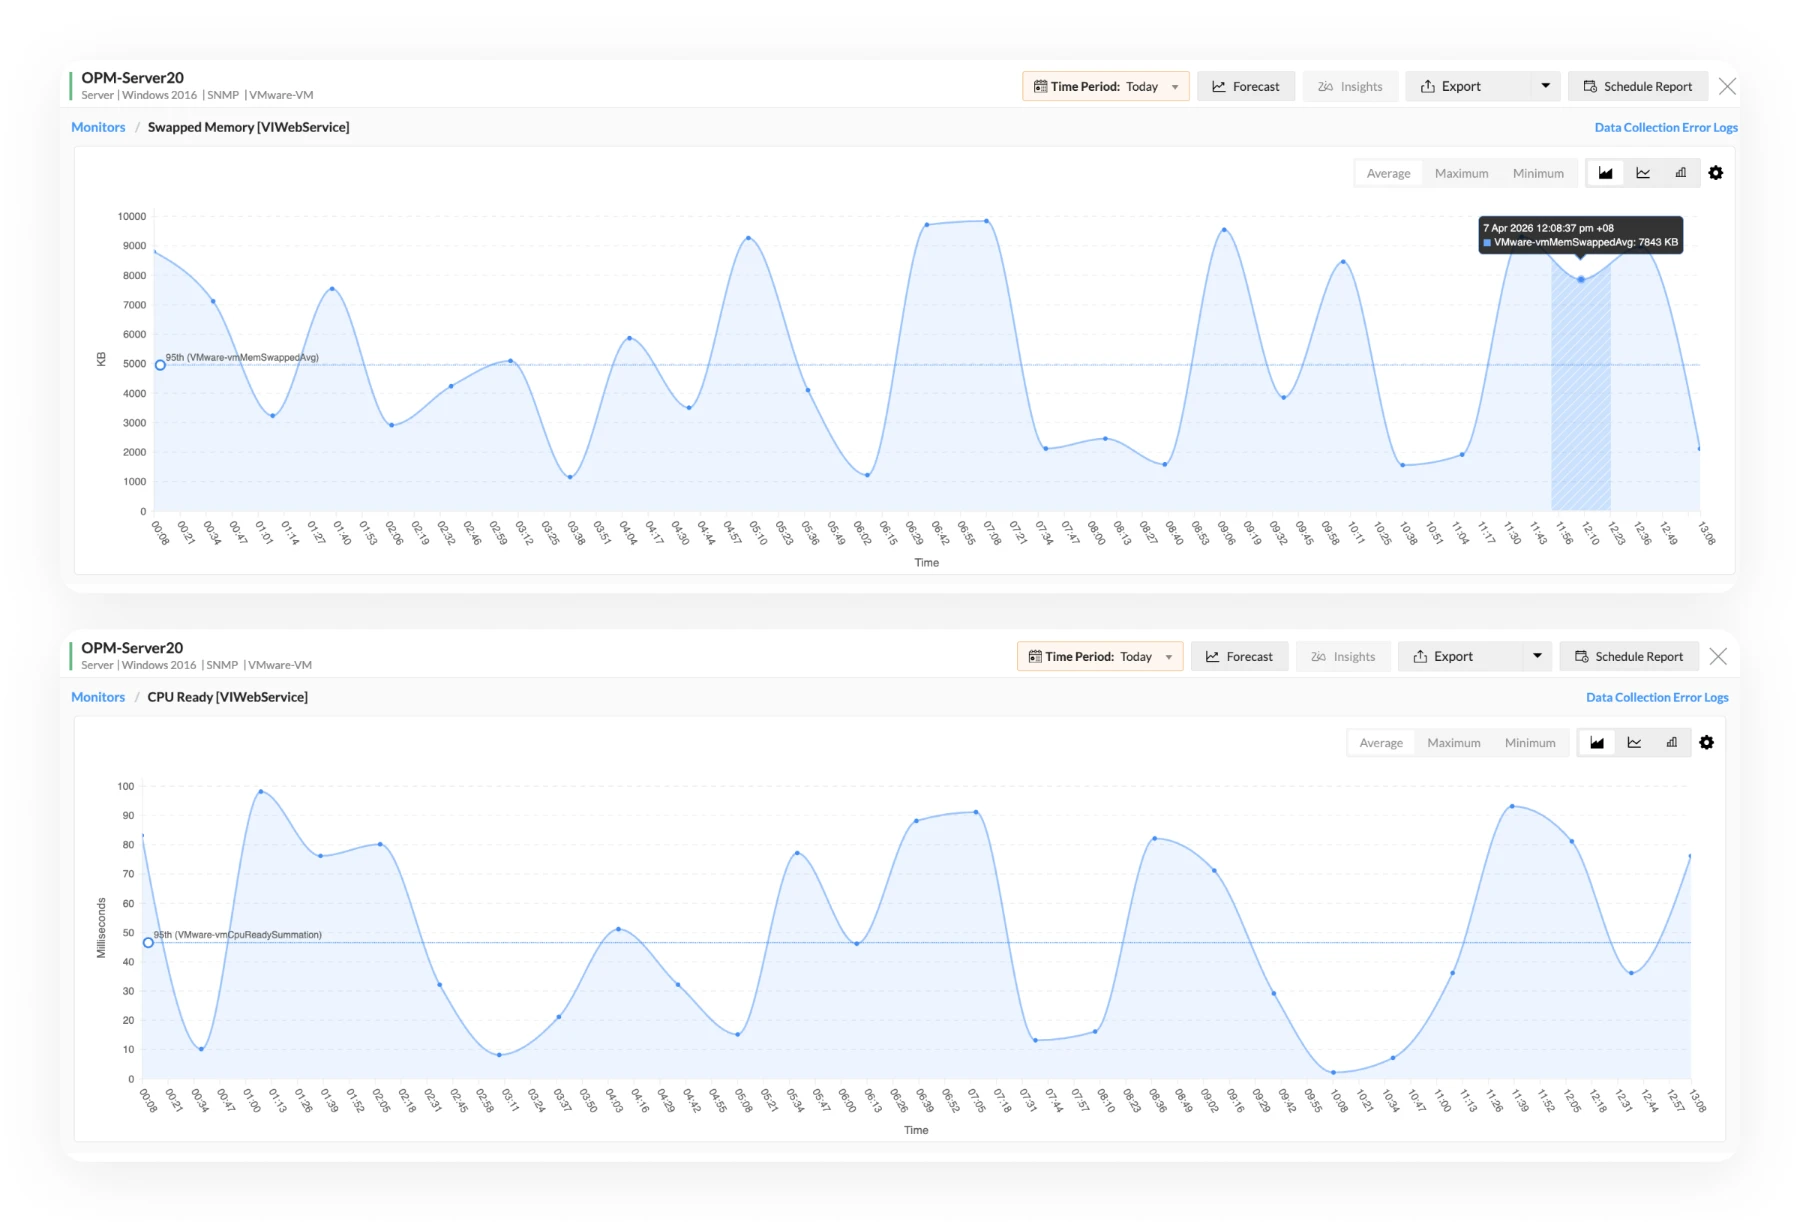
  • Identify CPU scheduling delays that traditional monitoring misses: A VM may have CPU assigned, but still be waiting to run. OpManager helps you catch that kind of contention early through metrics like CPU ready time across VMware and Hyper-V environments.
  • Track memory pressure beyond basic utilization: See when hosts are reclaiming memory through ballooning, swapping, or compression, so hidden pressure is easier to spot.
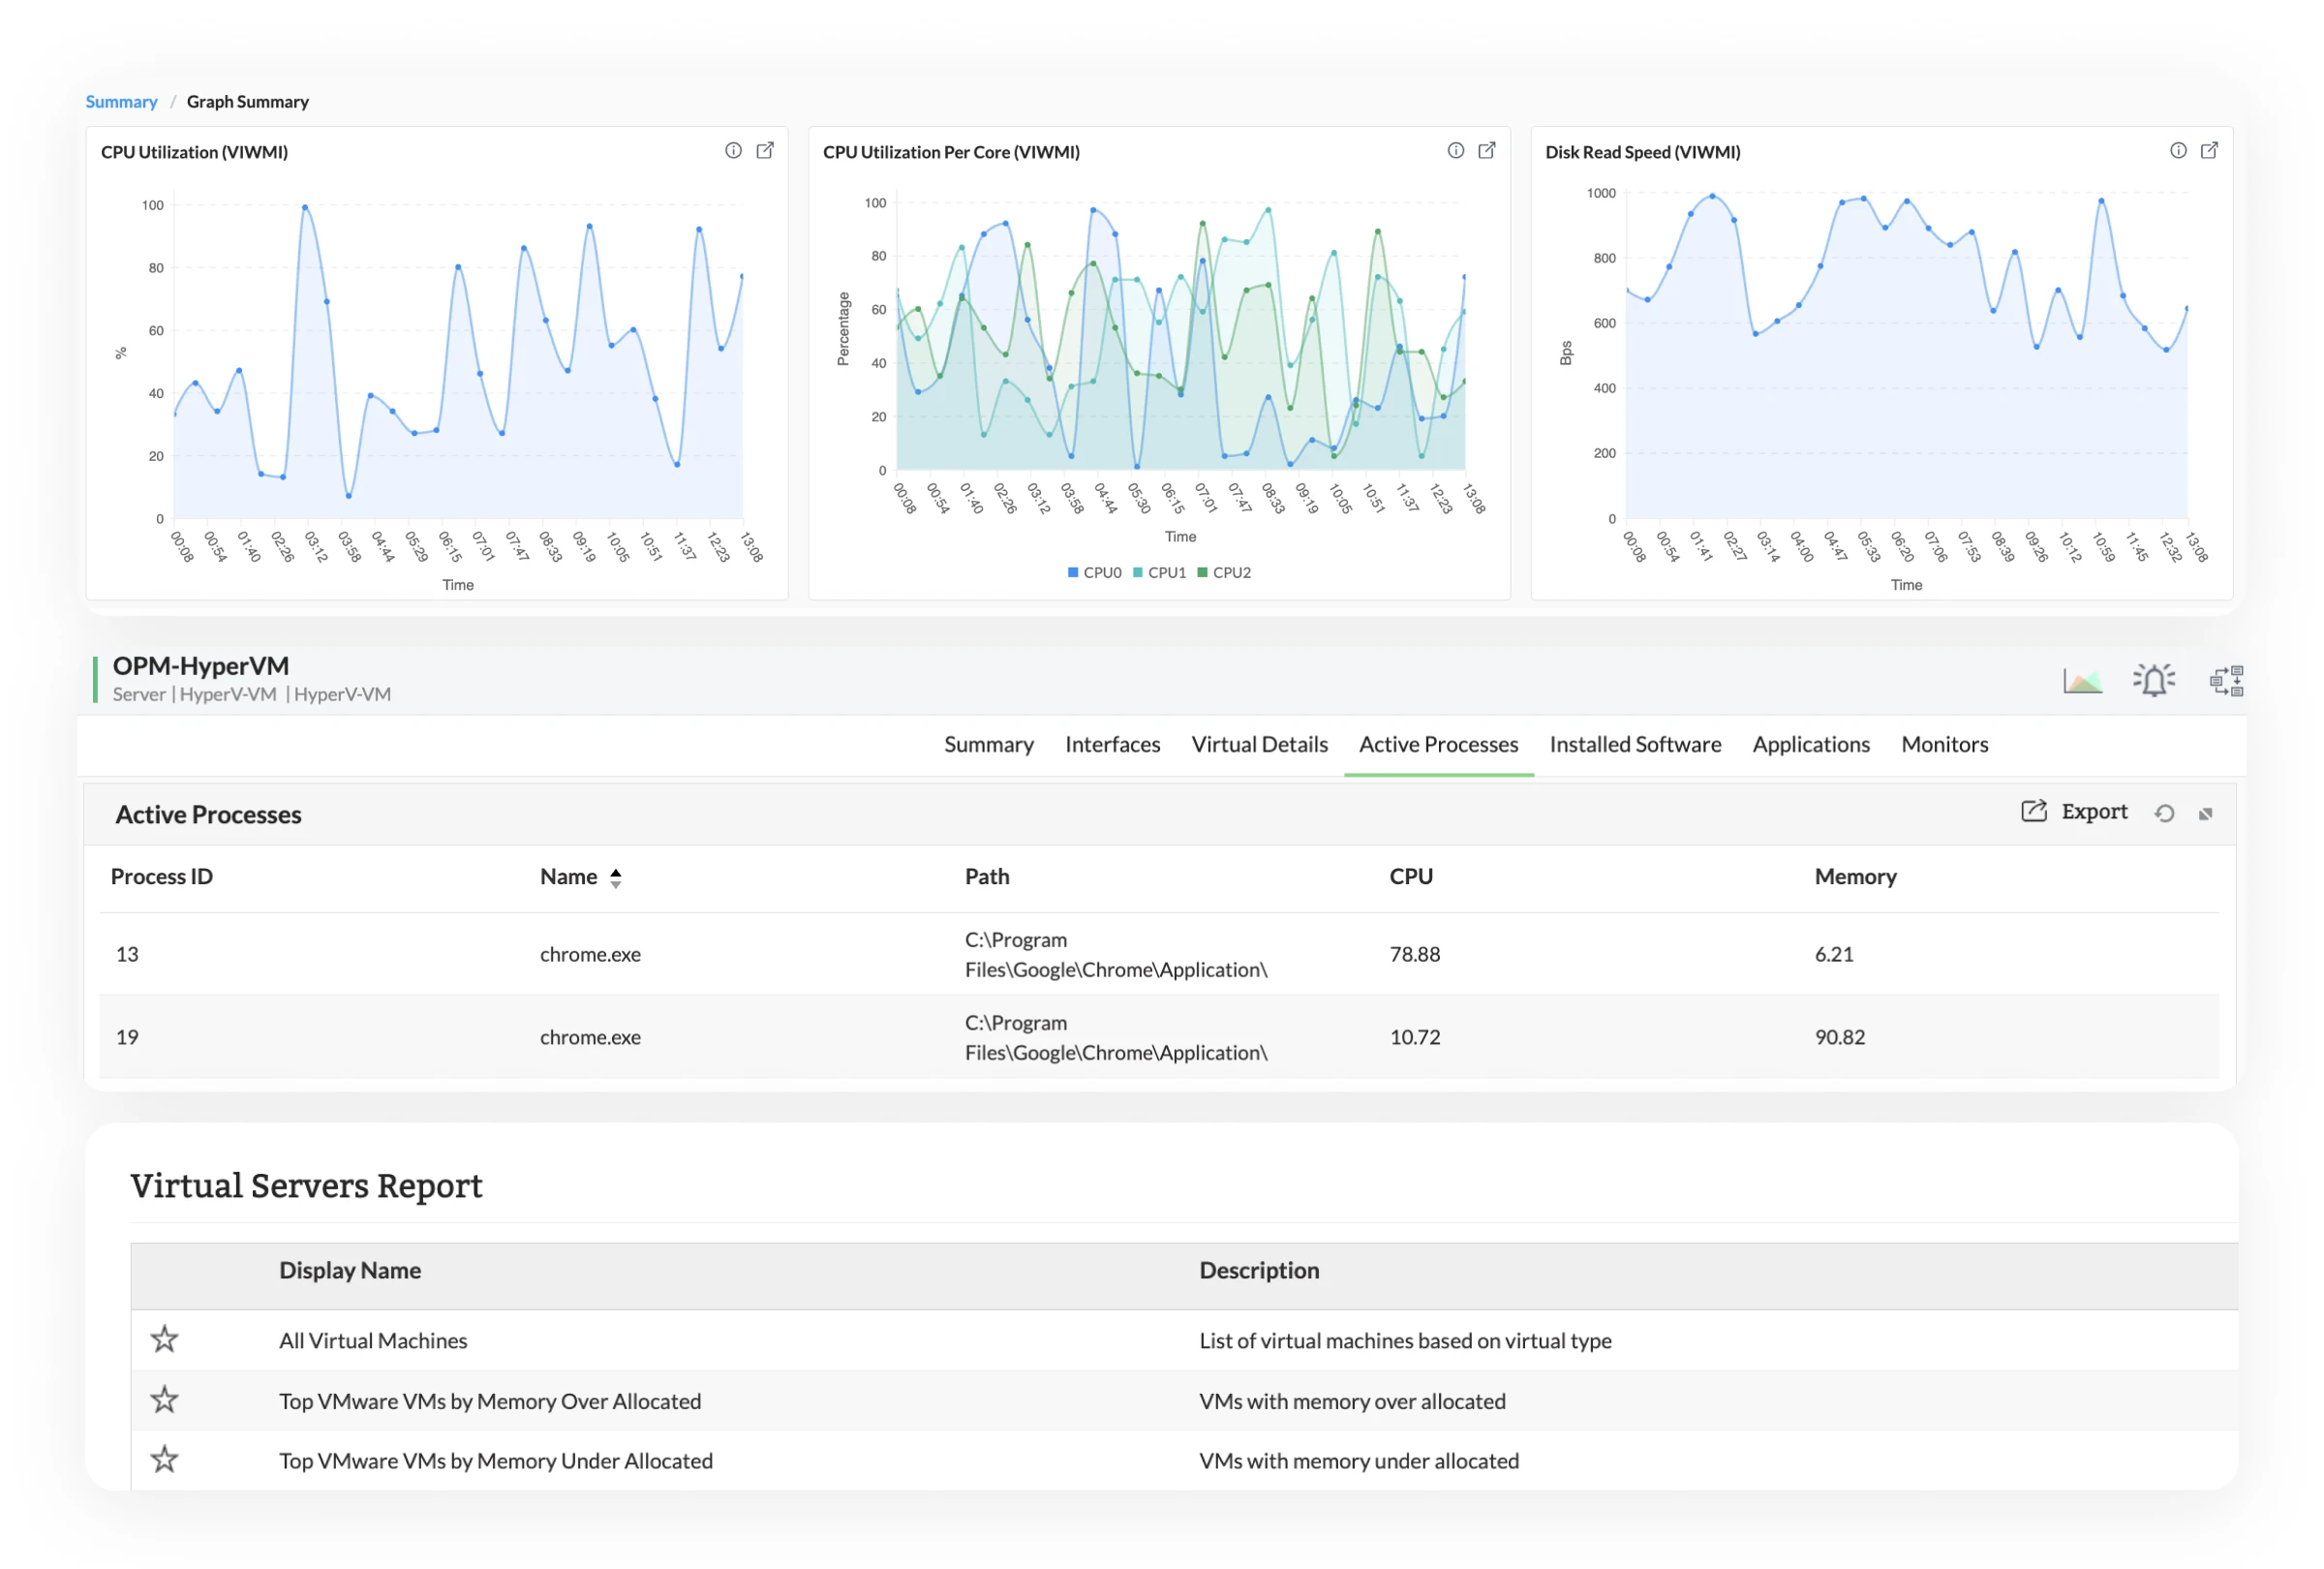
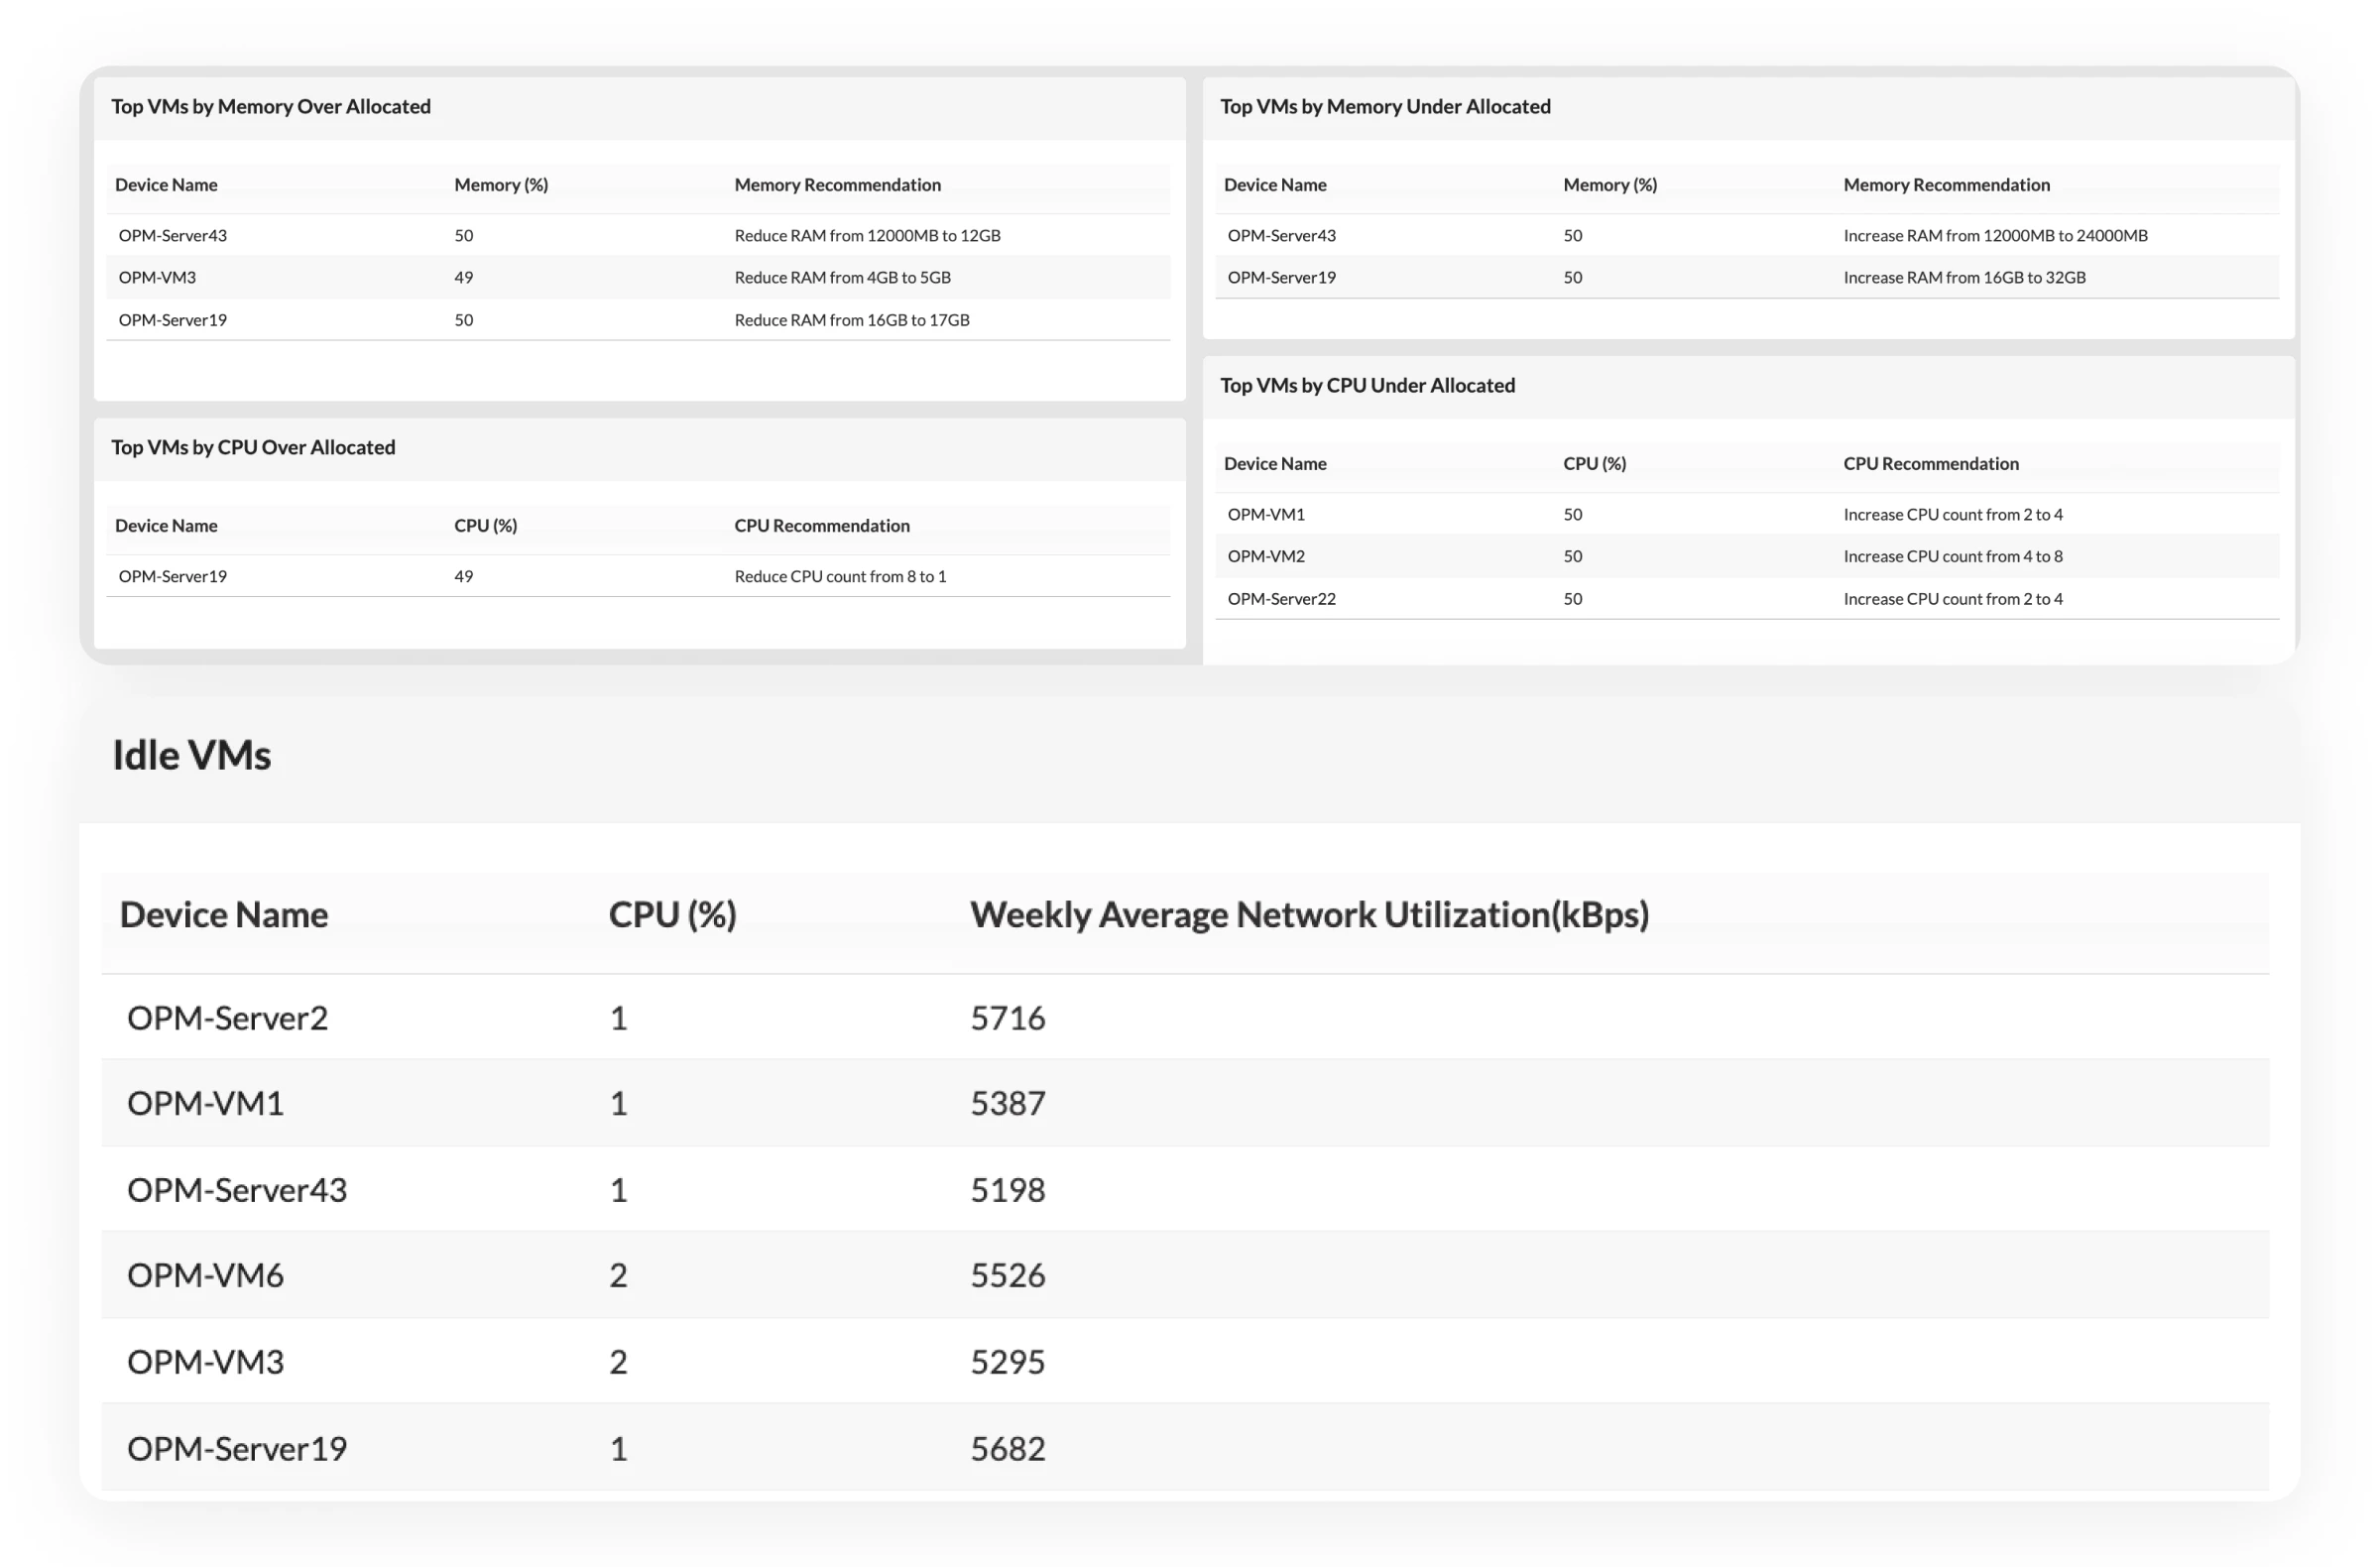
  • Balance workloads using real utilization insights: Find overloaded hosts early and redistribute workloads before performance issues spread across multiple VMs in your VMware or Hyper-V setup.
Hypervisor and Host Monitoring
VM Performance Analytics

Gain visibility into every VM across VMware, Microsoft Hyper-V & Nutanix

  • Pinpoint noisy neighbors impacting shared resources: Identify VMs that are consuming disproportionate CPU, memory, or I/O and creating contention for others on the same host.
  • View virtual disk and NIC details in context: See the attached virtual resources that support each VM, so storage and network-related issues are easier to investigate across VMware, Hyper-V, and Nutanix environments.
  • Identify active processes driving CPU and memory usage: Find out which processes inside the virtual server are consuming the most resources, helping you separate application-level issues from infrastructure problems.
  • Use virtual server reports to spot trends over time: Review historical behavior and usage patterns to support troubleshooting, rightsizing, and capacity planning across your virtual infrastructure.

See when storage is the real performance problem

  • Detect latency spikes that cascade across VMs: A single datastore issue can impact dozens of VMs: identify and address it before it spreads.
  • Correlate IOPS and throughput with VM performance: Understand whether storage is the bottleneck behind application slowdowns, not just a secondary symptom.
  • Turn datastore growth trends into proactive capacity decisions with Zia: See how storage usage is evolving, understand where risk is building, and act on recommendations before capacity becomes a performance issue.
Datastore and Storage Visibility
VM Sprawl Detection

Control VM sprawl with proactive detection and idle resource management

  • Visualize sprawl from a dedicated dashboard: Get a clear view of idle, oversized, and underutilized VMs with VM sprawl management software so cleanup opportunities are easy to identify.
  • Track VM growth across clusters and environments: See where your environment is expanding and how that growth is affecting resource consumption.
  • Reclaim unused resources with more confidence: Make cleanup and rightsizing decisions based on actual usage, not assumptions or guesswork.

Automate repetitive fixes and reduce manual effort

  • Automate responses to recurring infrastructure issues:Trigger predefined actions like VM restarts or resource adjustments to resolve common problems without manual intervention.
  • Standardize incident handling across environments: Use repeatable workflows to make responses more consistent across teams and platforms.
  • Reduce operational overhead across teams: Spend less time on repetitive troubleshooting and more time improving performance and capacity.
Automation and Workflow Actions
Unified Monitoring Approach

Connect virtualization, network, and application performance

  • Track Rx and Tx traffic across virtual interfaces: Monitor traffic and utilization across virtual NICs to see when network activity is contributing to VM performance issues.
  • Visualize relationships with organization maps:Understand how virtual resources are structured and connected, which makes navigation and troubleshooting easier in larger environments.
  • Correlate virtualization with network and application performance: Give infrastructure, network, and operations teams a shared view of what is happening, so issues are easier to resolve together.

See, understand, and resolve VM issues faster with OpManager

1

Discover new VMs and hosts without manual effort

Your environment is dynamic, your monitoring should be too.

  • Auto-discover VMs, hosts, and clusters as they come online: As new VMs are provisioned or workloads shift across clusters, OpManager automatically brings them under monitoring—no agents, no manual mapping.
  • Track VM lifecycle changes without losing visibility: vMotion, live migration, provisioning, decommissioning—every change is reflected in real time, so your monitoring never falls out of sync.

Watch how to discover vCenter servers automatically using OpManager →

2

Monitor performance across every layer that affects your VMs

A VM slowdown rarely starts where you first notice it.

  • Track performance across VMs, hosts, datastores, and virtual interfaces: See the layers that influence VM behavior in one connected view, so it is easier to tell whether the issue is isolated or part of a broader infrastructure problem.
  • Capture the metrics that explain real performance problems: Monitor CPU ready time, memory ballooning, swap usage, datastore latency, and interface utilization to catch contention and overcommitment before they turn into bigger issues.

Boost performance with real-time visibility →

3

Find the root cause across connected dependencies

Because every VM depends on host, storage, and network health.

  • Map VM performance to host, datastore, and network dependencies: Understand how pressure in one layer affects performance in another, so the impact is easier to see and act on.
  • Move from symptom to root cause in one view: Instead of piecing the story together manually, OpManager connects the dots for you—making it easier to understand where the issue started and what it is affecting.

Master faster root cause detection →

4

Get alerts with the context to act faster

Alerts should help you respond early, not create more noise.

  • Catch unusual performance behavior with auto-adaptive thresholds: Instead of relying only on static limits, OpManager detects changes like rising CPU ready time, growing latency, or unusual resource patterns based on normal behavior—so your team can spot issues earlier.
  • Send context-rich alerts through the channels your team already uses: Deliver actionable alerts via email, SMS, and more, with enough context to quickly understand whether the issue starts at the VM, host, or storage layer.

Learn how to get alerts that actually matter →

Unify monitoring across VMware, Hyper-V,Nutanix, HCI and more

Monitor mixed virtual environments from one place

Bring VMware, Hyper-V, Nutanix, Citrix XenServer, Proxmox, and HCI platforms like VxRail into a single monitoring view.

Standardize monitoring across teams and platforms

Give your teams one consistent way to track performance, investigate issues, and manage virtual infrastructure across vendors.

Reduce tool sprawl and operational complexity

Replace fragmented monitoring workflows with one platform that simplifies visibility and day-to-day troubleshooting.

Troubleshoot faster across multi-vendor infrastructure

Get the context you need to identify issues quickly, without switching between separate tools for each platform.

Scale confidently as your environment evolves

Support new platforms, changing architectures, and growing virtual estates without rebuilding your monitoring approach.

Supports leading virtualization and HCI platforms you already use

Why OpManager: From reactive fixes to proactive control

What you’re dealing with todayWhy OpManager makes the difference
Too many unused VMs driving up costsIdentify idle and over-provisioned VMs with usage insights, and reclaim wasted resources confidently
Slow, manual troubleshooting across toolsPinpoint root cause across VM, host, and storage layers from a single, connected view
Performance issues that appear without warningDetect idle, oversized, and unused VMs with dedicated sprawl dashboards and usage trends.
Fragmented tools and siloed visibilityMonitor virtualization, network, and storage together without switching between platforms

Enterprise use-cases for virtualization monitoring

Fix VM slowdowns without guesswork

The scenario

A critical VM starts slowing down during peak usage.

The impact

Teams jump between tools trying to figure out whether it’s CPU contention, memory pressure, or storage latency.

How OpManager helps

You can instantly trace the issue across VM, host, and datastore layers and pinpoint the exact cause reducing troubleshooting time from hours to minutes.

FAQs on virtualization monitoring

What is virtualization monitoring?


Virtualization monitoring is the process of tracking the performance, health, and resource usage of virtual machines (VMs), hypervisors, hosts, and storage systems. It helps IT teams detect performance issues, prevent downtime, and optimize resource utilization across virtual environments.

Why is virtualization monitoring important?


Virtualization monitoring is important because performance issues in virtual environments are often caused by underlying resource contention, such as CPU scheduling delays, memory pressure, or storage latency. Without proper visibility, these issues are difficult to diagnose and can lead to downtime, poor application performance, and increased infrastructure costs.

What metrics are important in VM performance monitoring?


Key metrics include CPU ready time, memory ballooning, swap usage, disk latency, IOPS, and network throughput. These metrics help identify resource contention, over-provisioning, and bottlenecks affecting VM performance.

How does OpManager monitor virtual environments?


OpManager monitors virtual environments by automatically discovering VMs, hypervisors, hosts, and datastores, and collecting performance metrics across each layer. It correlates this data to help identify the root cause of performance issues and provides actionable insights for faster troubleshooting.

Does OpManager support VMware and Hyper-V monitoring?


Yes, OpManager supports both VMware and Hyper-V environments. It provides visibility into ESXi hosts, clusters, VMs, and datastores, as well as Hyper-V hosts and virtual machines, enabling unified monitoring from a single platform.

How can virtualization monitoring reduce VM sprawl?


Virtualization monitoring helps reduce VM sprawl by identifying idle, underutilized, or over-provisioned VMs. With usage insights, IT teams can reclaim unused resources, optimize allocations, and control infrastructure costs more effectively.

What is CPU ready time in virtualization?


CPU ready time is the amount of time a virtual machine waits for CPU resources from the hypervisor. High CPU ready time indicates resource contention and can lead to performance degradation even if CPU usage appears normal.

Can virtualization monitoring help with capacity planning?


Yes, virtualization monitoring provides historical performance data and usage trends, which help IT teams forecast resource requirements, plan capacity upgrades, and prevent performance issues caused by resource shortages.

What if you could instantly fix VM performance issues?

Request a demo to see how OpManager helps you monitor virtual environments and resolve issues faster.

Evaluate OpManager:
Get a personalized product demo Configure a custom price quote
Trusted by over 25,000 customers globally

Loved by customers all over the world


“Easy Implementation, Excellent support & Lower Cost Tool - Team Lead, IT Services Industry”

Reviewer Role: Infrastructure and Operations

Company size: 500M - 1B USD

We have been using OpManager since 2011 and our overall experience has been excellent. The tool plays a vital role in providing the value to our organization and to the customers we are supporting.

“OpManager - 10 steps ahead of the competition - Network Services Manager, Government Organization”

Reviewer Role: Infrastructure and Operations

Company size: 5,000 - 50,000 Employees

I have a long standing relationship with ManageEngine. OpManager has always been the most comprehensive and easy to use product on the market.

“Great Monitoring tool - CIO in Finance Industry”

Reviewer Role: CIO

Company size: 1B - 3B USD

ManageEngine provides a suite of tools that have made improvements to the availability of our internal applications. From monitoring, management and alerting, we have been able to achieve peak performance within our data center.

Capterra
Getapp
Software Advice
G2
Altaleb Alshenqiti

“OpManager helps me monitor all aspects of the data-center and equipment like servers, switches and routers. It is fast, intuitive and centralized.”

Altaleb Alshenqiti

NGHA

Donald Stewart

“Donald Stewart, IT Manager of Crest Industries is happy with ManageEngine OpManager for its end-to-end network monitoring.”

Donald Stewart

IT Manager, Crest Industries