Advanced Analytics in PAM360
PAM360 seamlessly integrates with ManageEngine's native cutting-edge data analytics tools, enabling you to efficiently monitor and analyze account activity across your privileged resources. This document outlines the available integrations, their benefits, and the process for enabling and utilizing the Advanced Analytics module.
This help document covers the following topics in detail:
- Benefits of the Advanced Analytics Module
- How does the Integration Work?
- How to Activate Advanced Analytics in PAM360?
- Data Analytics Tools Integrated with PAM360
- ManageEngine Analytics Plus
- ManageEngine Log360 UEBA
1. Benefits of the Advanced Analytics Module
- Detect unusual user behavior and identify potential security threats.
- Continuously monitor historical audit logs for suspicious activities.
- Utilize Zia, the AI-powered analytics assistant, to pinpoint anomalies.
- Consolidate data from multiple sources and PAM360 modules for comprehensive insights.
- Receive real-time notifications when predefined thresholds are exceeded.
- Securely email, export, publish, and share key findings.
The scope and benefits of integration vary based on the chosen analytics tool. However, the fundamental objective remains the same — efficiently managing and analyzing shared sensitive data from PAM360.
2. How does the Integration Work?
Upon integrating PAM360 with an analytics tool, all resource and user audit logs are consolidated and transferred to the selected analytics platform. The data is then interpreted, visualized through dashboards, and made accessible under the Advanced Analytics tab in PAM360.
3. How to Activate Advanced Analytics in PAM360?
To enable Advanced Analytics in PAM360, you must have an active license for one of the supported analytics applications. If you already have a license, click on the respective following product name for integration setup instructions. For further assistance, contact pam360-support@manageengine.com.
4. Data Analytics Tools Integrated with PAM360
PAM360 integrates with the following ManageEngine products. Click on each link for step-by-step integration guidance:
Once integration is complete, follow the required section below to view your dashboard:
- Login to PAM360 and navigate to the Advanced Analytics tab.
- If both Analytics Plus and Log360 UEBA are integrated, dashboards from each will be displayed separately, mirroring their respective native interfaces.
5. ManageEngine Analytics Plus
The Dashboard menu on the left panel categorizes various dashboards based on the data imported from PAM360 into Analytics Plus. Click on each dashboard type to explore the corresponding insights displayed on the right.
The data showcased in the dashboards depends on the following factors:
- The modules imported from PAM360 into Analytics Plus
- The selected time frame for data import
- The scheduled data import frequency set in Analytics Plus during integration
To access the Analytics Plus portal directly, click the Launch Analytics Plus link.
5.1 User Activity Dashboard
The User Activity dashboard provides a comprehensive overview of user activities within your PAM360 environment. Utilize the User Account, Resource Name, and Time Period filters to refine the dashboard view. Key insights include:
- Number of users accessing a specific resource or account within a chosen period
- Identification of the most active users
- Count of newly added users within the selected time frame
- User with the highest level of access
Analytics Plus segments user activities into multiple categories and represents them visually through graphs for better understanding. Scroll down to explore all available graphs.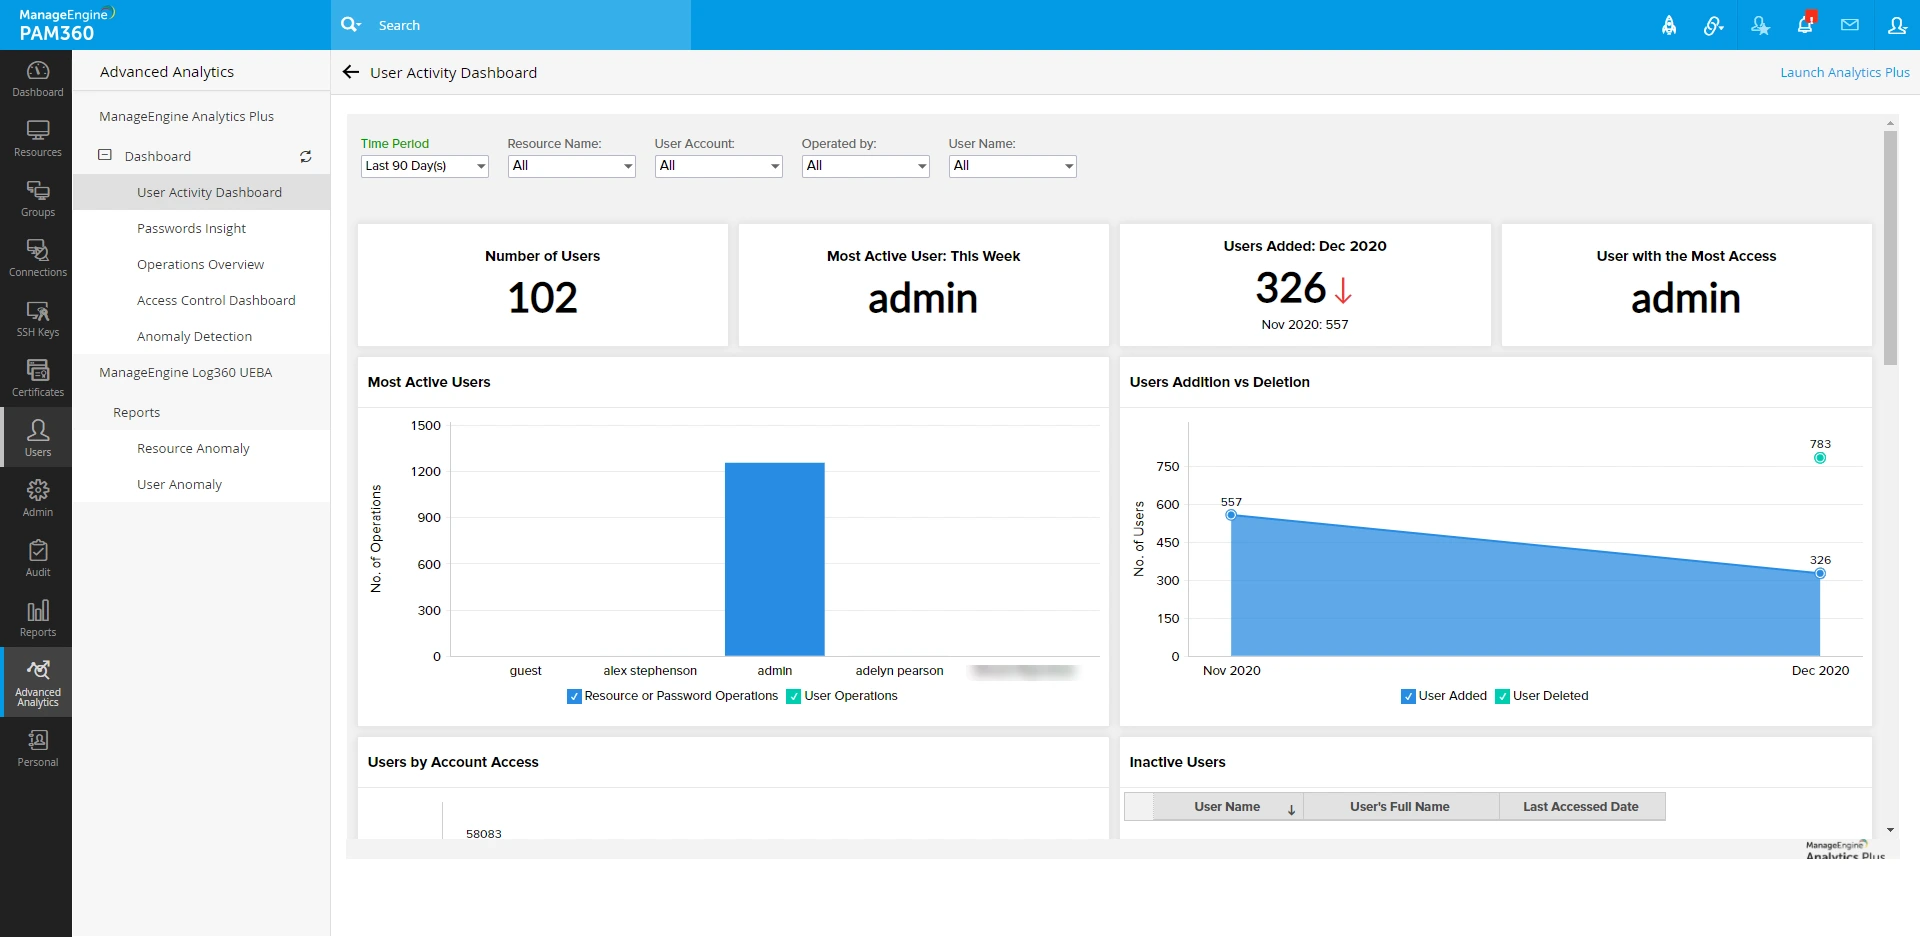
5.2 Passwords Insight
The Passwords Insight dashboard provides detailed data on the passwords stored and managed in PAM360. Use the Resource Name and Account Name filters to customize the view. The dashboard highlights:
- Number of expired passwords
- Count of passwords expiring within the current week
- Resource with the highest number of expired passwords
- Password synchronization percentage
- Most commonly used password policy
- Number of password policy violations
Like other dashboards, Analytics Plus organizes password-related insights into distinct sections, displaying them graphically for easy interpretation. Scroll down to access all visual representation.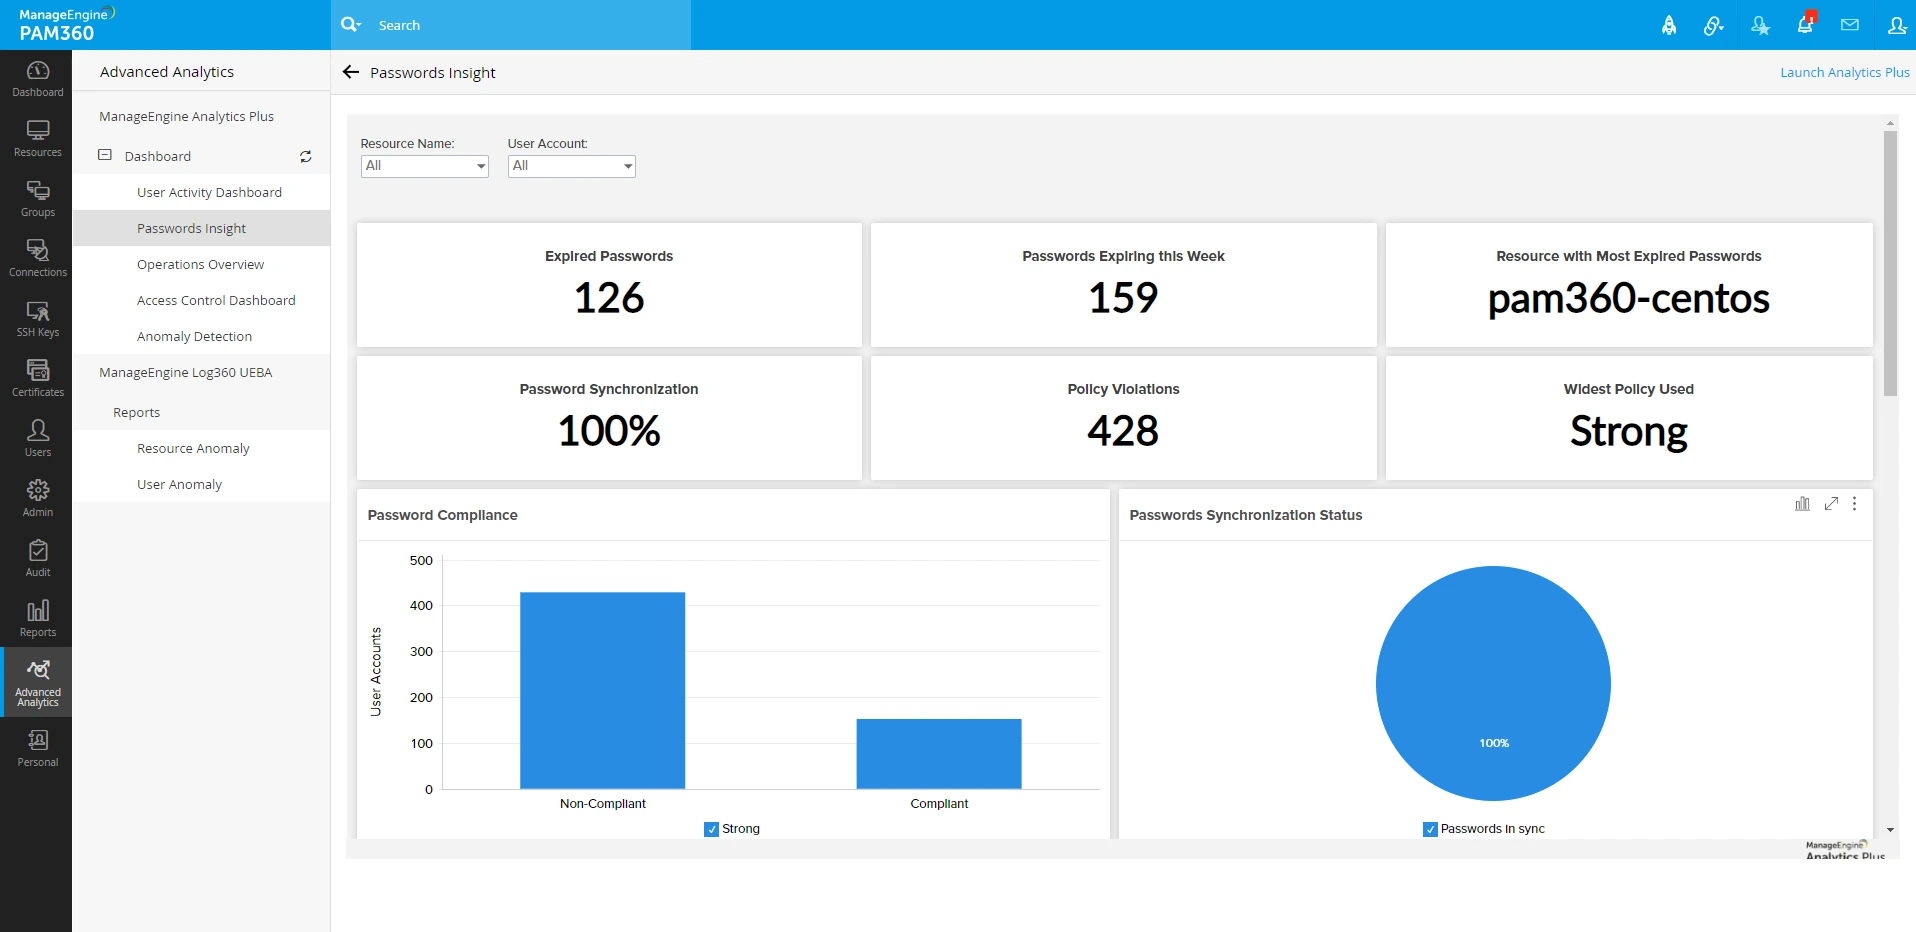
5.3 Operations Overview
The Operations Overview dashboard delivers a consolidated view of resource and password-related operations executed within the selected time period. Utilize the Resource Name, Account Name, and Time Period filters to refine the dashboard. Key insights include:
- Total number of resources and accounts
- Identification of the most active users and resources
- Password access percentage
As with other dashboards, Analytics Plus presents operational details in various sections, illustrated through graphs for easy analysis. Scroll down to explore all graphical insights.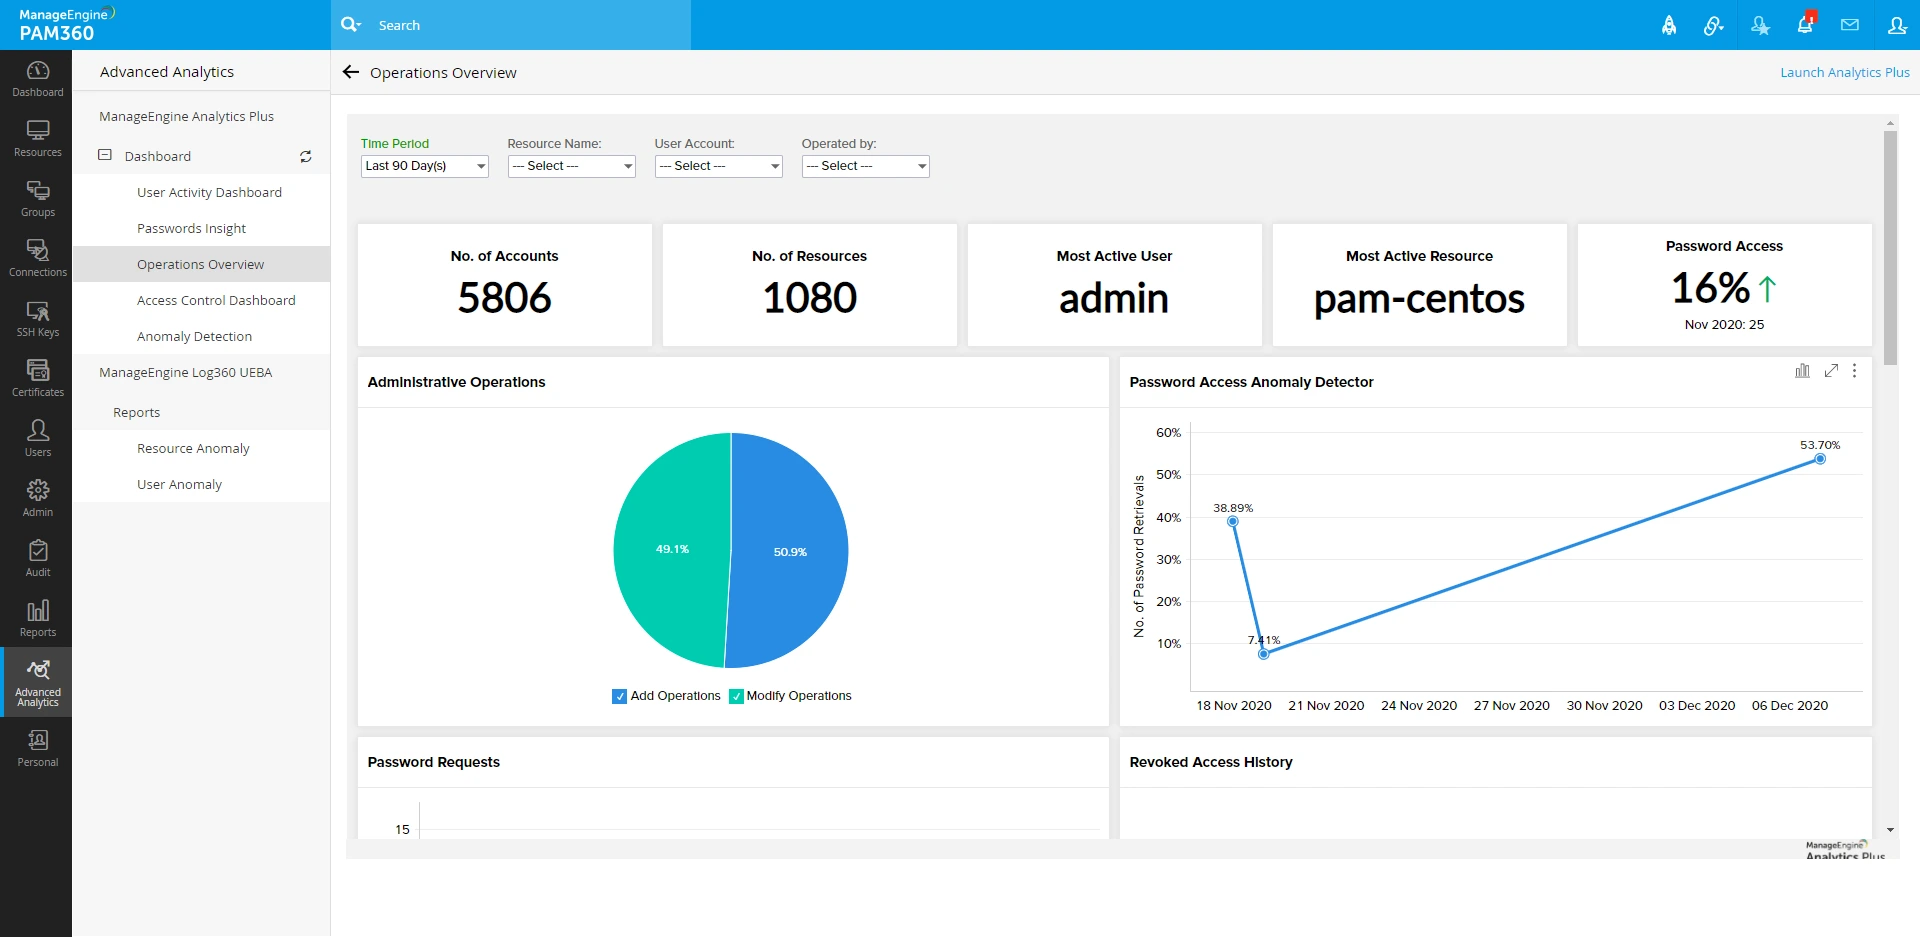
5.4 Access Control Dashboard
The Access Control dashboard provides visibility into resource and password-related access operations performed within the chosen time frame. Use the Resource Name, Account Name, and Time Period filters to customize the view. Key insights include:
- User with access to the highest number of accounts
- Most widely shared account
- Total password requests
- Number of password requests revoked within the selected period
Analytics Plus segregates access control details into multiple sections, displaying them graphically for ease of analysis. Scroll down to review all available visual representations.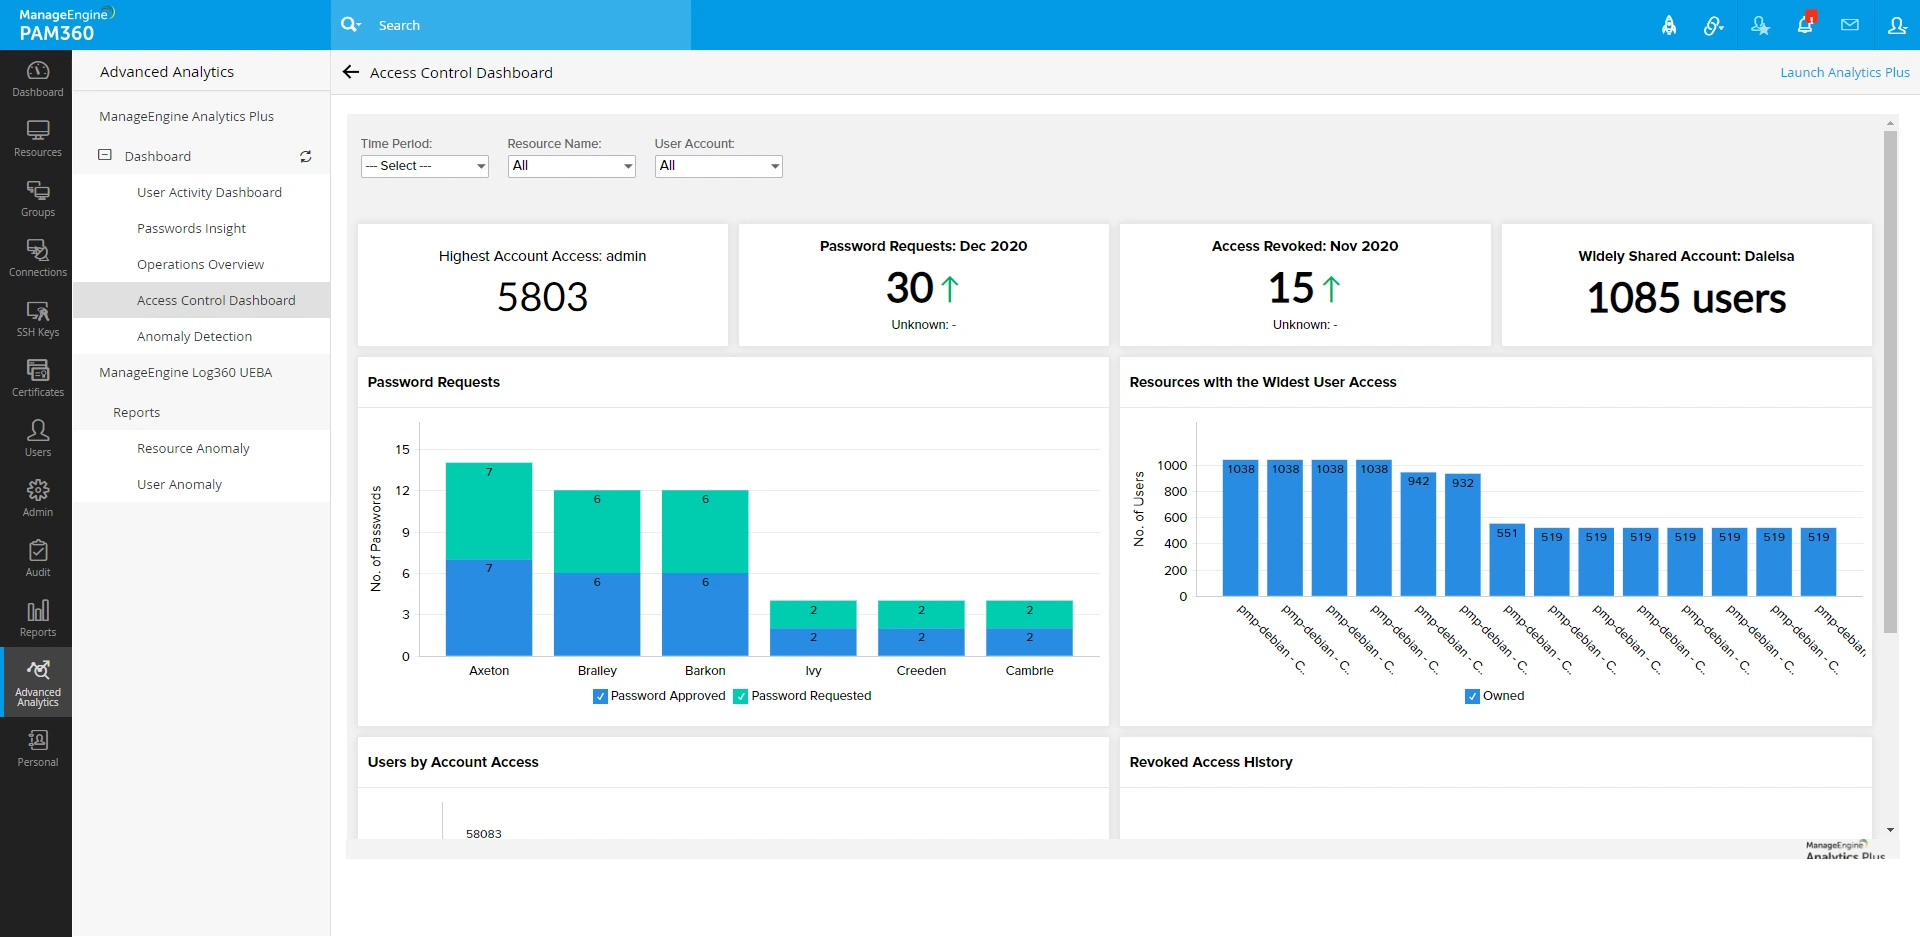
5.5 Anomaly Detection
The Anomaly Detection Dashboard helps identify any unusual activities within the selected time period. Utilize the Resource Name, Account Name, and Time Period filters to refine the dashboard. Key insights include:
- Number of operations conducted outside business hours
- Most frequently performed non-business hour operation
- Count of user sessions during non-business hours
- Widely accessed account during non-business hours
- User with the highest number of authentication failures
- User responsible for the most unauthorized access attempts
Analytics Plus categorizes anomaly-related data into multiple sections, representing them through graphs for effortless interpretation. Scroll down to review all graphical insights.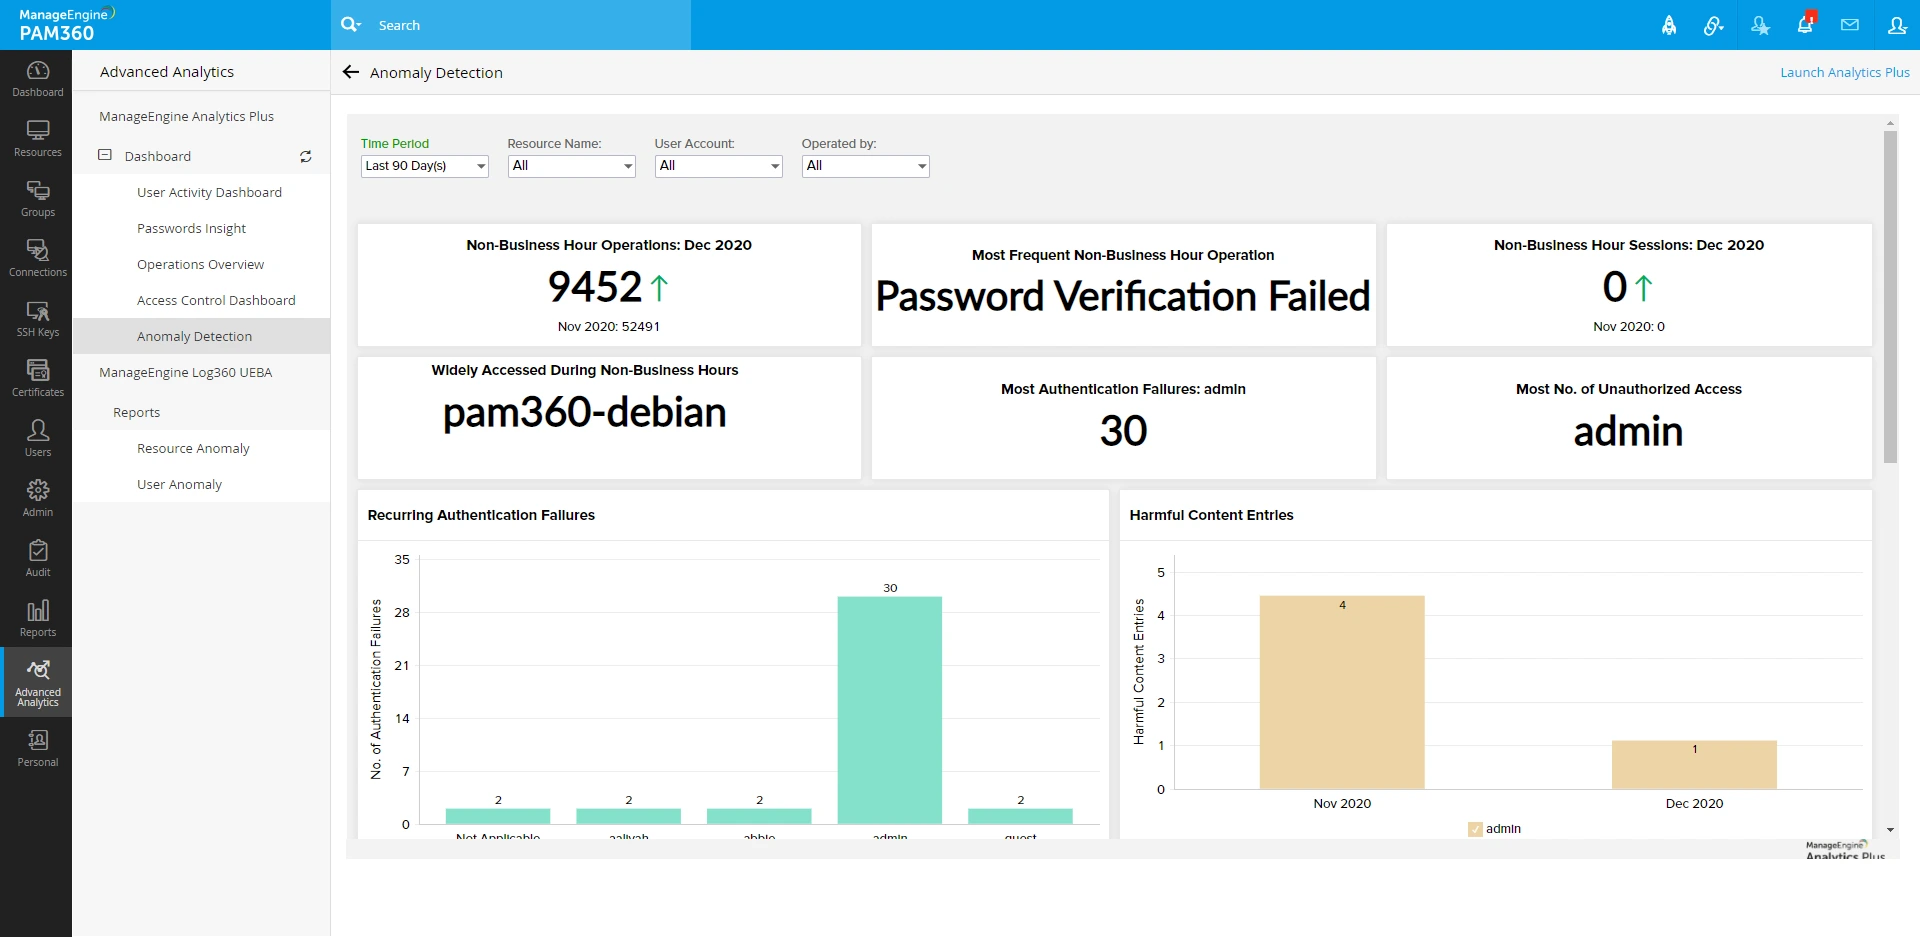
6. ManageEngine Log360 UEBA
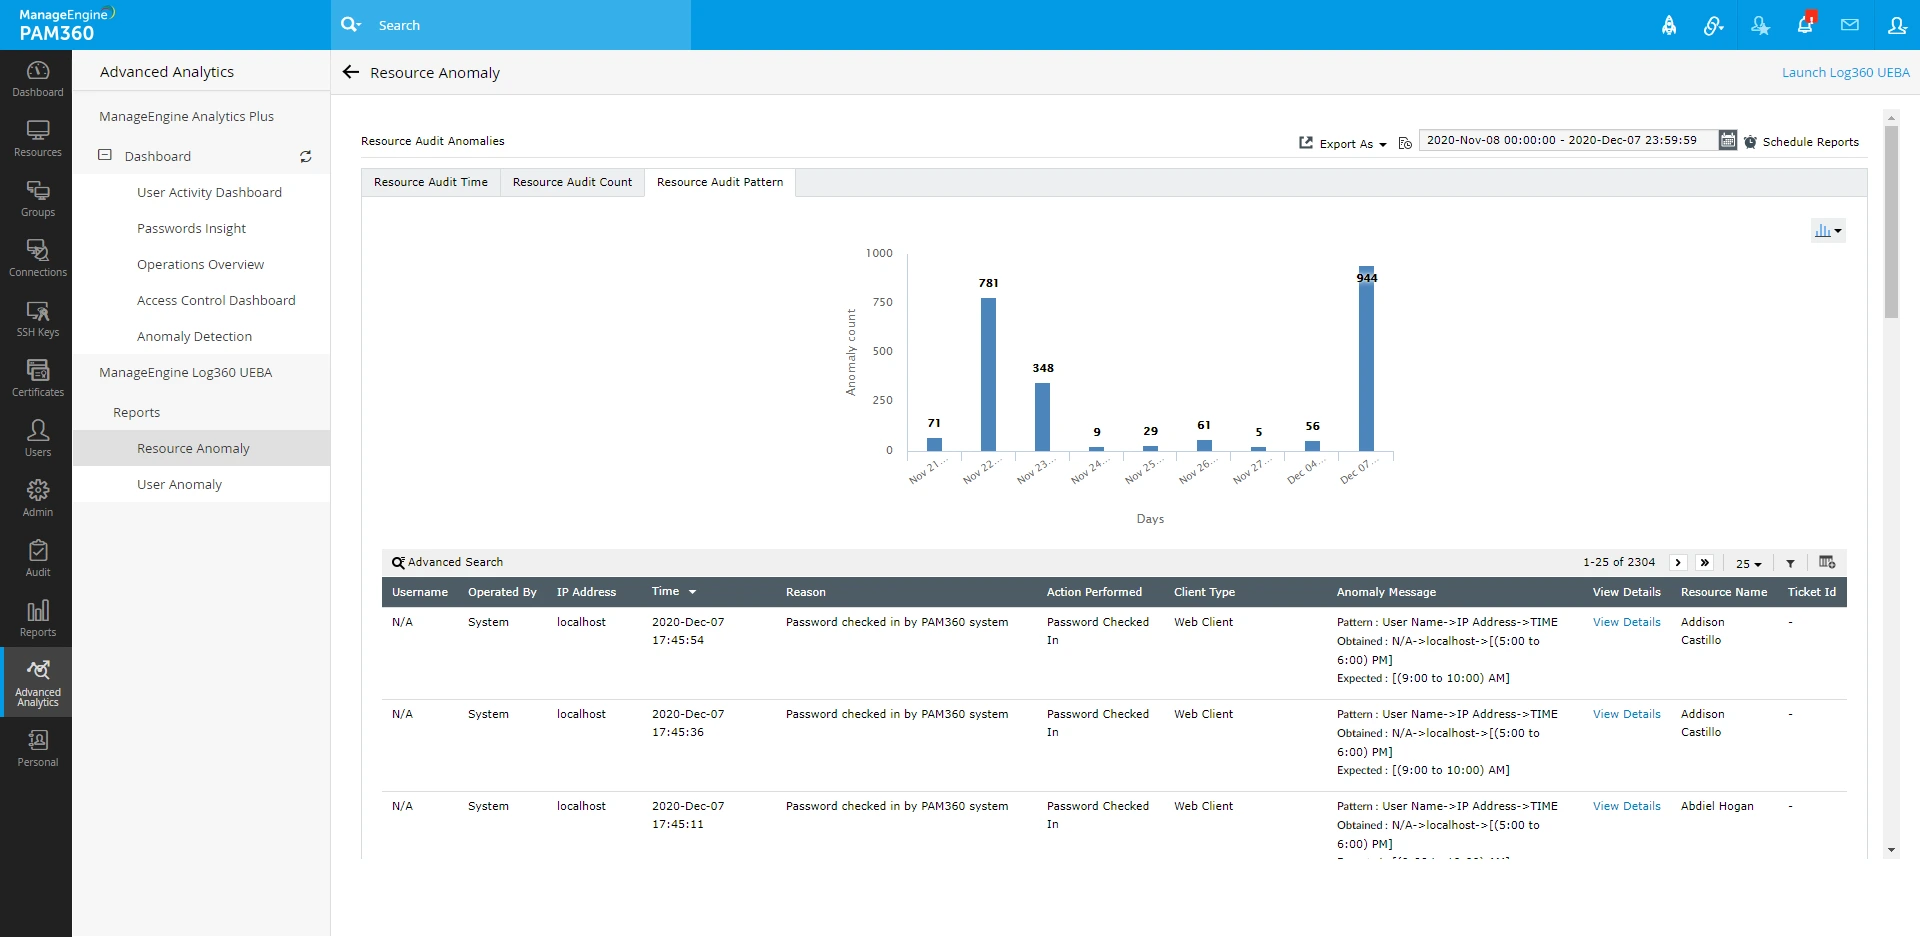
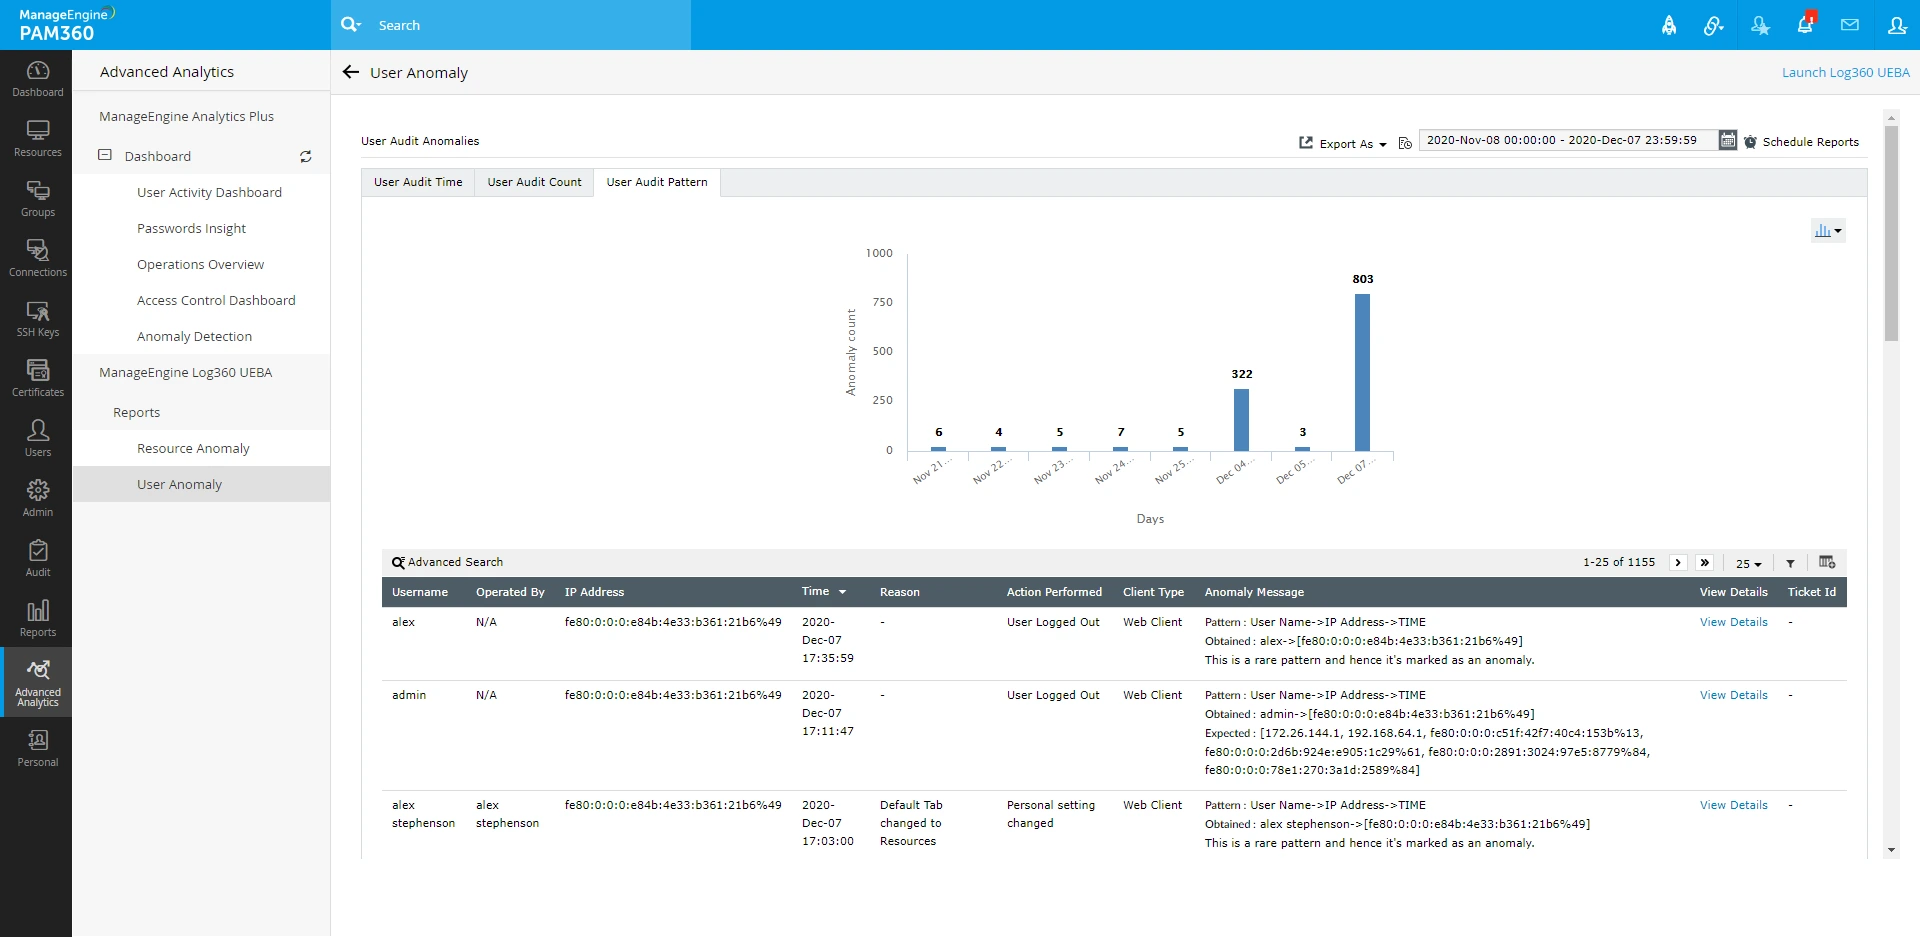
To access analytics data aggregated by ManageEngine Log360 UEBA, select either Resource Anomaly or User Anomaly. Based on your choice, the corresponding resource and user audit reports will be displayed on the dashboard.
Log360 UEBA classifies resource and user audit trails from PAM360 and represents them in three ways:
- Audit Time: The timestamp of detected user activity
- Audit Count: The frequency of a specific user activity
- Audit Pattern: Behavioral trends derived from Audit Time and Audit Count
Using a score-based risk assessment, Log360 UEBA flags any deviations from normal behavior as anomalies in its Anomaly Reports. These reports can be visualized through bar graphs and pie charts. To export the displayed report, click Export As in the top-right corner and choose from four formats: CSV, PDF, XLS, or HTML.
To schedule report generation, click Schedule Reports. Note that scheduling in the Log360 UEBA dashboard and the Reports tab of PAM360 operates independently.