Apache ZooKeeper monitoring: Why visibility into coordination systems matters
Apache ZooKeeper is a server that operates silently in the background; coordinating services, electing leaders, and maintaining distributed consistency across clusters. From HBase and Kafka to Solr and Hadoop, ZooKeeper sits at the heart of modern distributed systems. That's exactly why you cannot afford to run it blind. Therefore, it is crucial to learn how to monitor ZooKeeper efficiently; with a monitoring solution that can visualize the performance of your Zookeeper ensembles in real time.
Why is monitoring ZooKeeper tricky (but essential)?
ZooKeeper isn’t your average database or server. It is a coordination service that is responsible for keeping distributed systems in sync, handling leader elections, configuration updates, and maintaining quorum.
However, the problem with ZooKeeper is that it won't reveal when things begin to go wrong. Latency might creep up. Sessions may silently expire. A follower node might fall behind. You will not notice it until your app starts misbehaving.
That is where ManageEngine Applications Manager steps in.
Real-time health tracking of ZooKeeper nodes
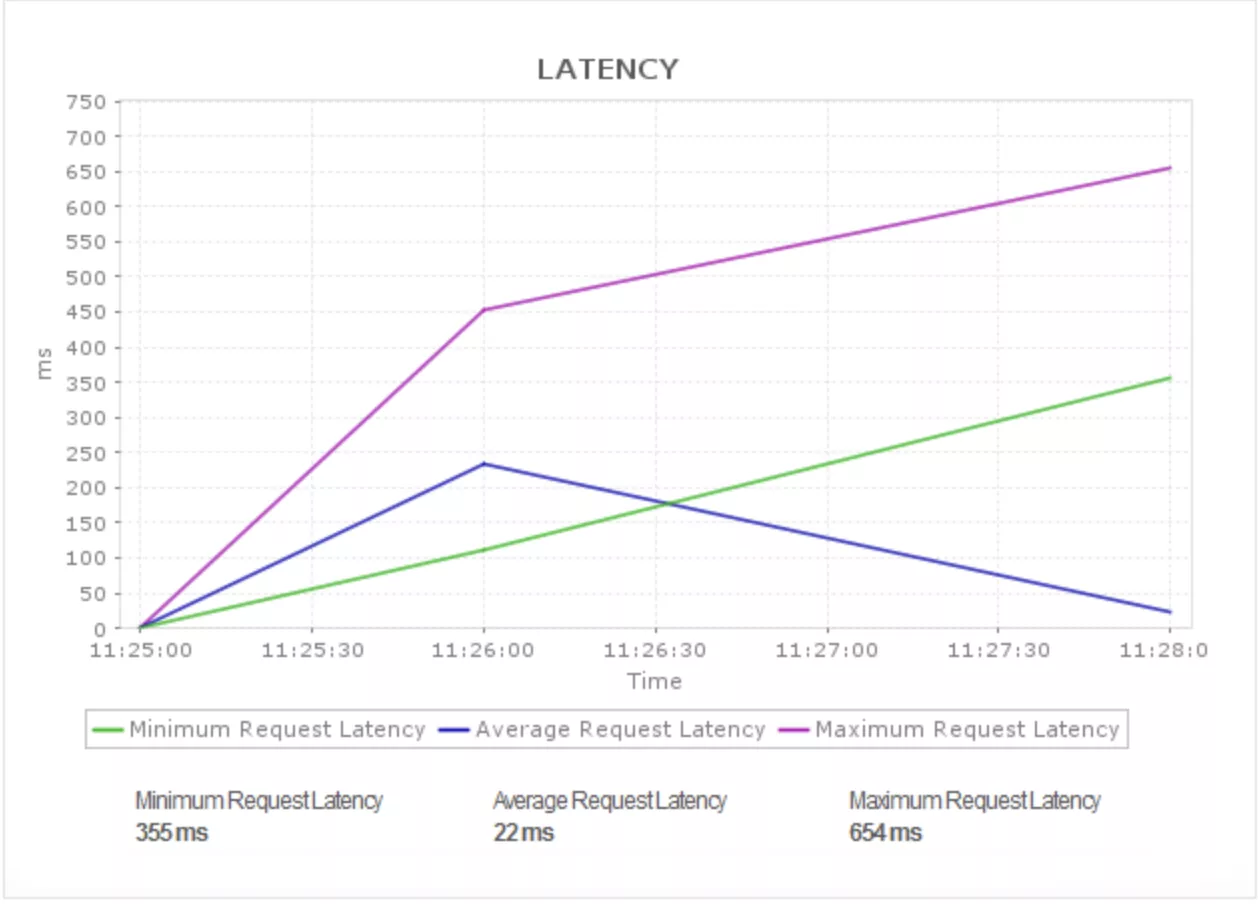
Applications Manager integrates seamlessly with ZooKeeper ensembles to collect detailed, real-time performance metrics from each node. It provides visibility into connection counts per server to help assess load distribution, tracks outstanding requests to identify processing delays, and captures latency breakdowns. This allows you to detect early signs of performance degradation efficiently and fix anomalies before they cause downtime.

Leadership status and quorum health are also readily available, allowing IT teams to quickly identify nodes that are lagging or dropping requests, all without relying on command-line tools or log analysis.
Actionable session and watch metrics
Since ZooKeeper operates on sessions and watches, issues in these areas often signal deeper infrastructure or application-level problems. Applications Manager tracks session timeouts, expiration trends, and fluctuations in the number of watches or ephemeral nodes. Monitoring these patterns can reveal poorly behaving clients or resource constraints before they begin to affect the broader system. This data supports early diagnosis and enables preventative action before the impact is felt downstream.
Quorum and leadership visibility
Maintaining quorum is critical for ZooKeeper’s ability to coordinate distributed systems. Any disruption to quorum can lead to a complete halt in service orchestration. Applications Manager offers clear insights into the current cluster state, including leadership status, follower node connectivity, and election activity. It also highlights any issues in follower synchronization, helping teams understand and resolve coordination problems more efficiently.

Proactive and configurable alerting
ZooKeeper does not always exhibit obvious symptoms when performance issues arise. Applications Manager provides visibility into performance anomalies with adaptive thresholds and smart alerts for key metrics like connection counts, request latency, leader election frequency, and backlog growth. You can configure alarms to alert you via email, SMS, Slack as well as raise incidents in ServiceDesk Plus/ServiceNow, and respond quickly before performance issues escalate into outages.
Historical performance analysis
In addition to real-time monitoring, Applications Manager offers historical analysis that supports long-term troubleshooting and capacity planning. You can review latency trends, connection loads during peak traffic periods, and changes in ephemeral node creation over time. Applications Manager leverages ML driven tech to analyze periodic trends to generate futuristic performance reports. These insights are valuable while investigating recurring issues, implementing root cause analysis, or planning for infrastructure scaling.
Unified monitoring across the ecosystem
ZooKeeper operates with a broader distributed architecture, supporting platforms like Kafka, Hadoop, Solr, and others. Applications Manager offers extensive visibility across the entire stack, promoting cross-service correlation and centralized monitoring. From infrastructure components to application layers, users benefit from unified dashboards, streamlined alerting, and integrated reporting—all within a single platform. This holistic view helps reduce tool sprawl and simplifies operations management.
Summing up
ZooKeeper might be the quiet hero of your distributed system—but that silence can be dangerous without visibility. Whether it is a slow node, a jittery leader election, or watching floods from a buggy client, the earlier you catch it, the better.
With Applications Manager, you get proactive, deep-dive monitoring for ZooKeeper along with the rest of your infrastructure without any scripting, third party agents, or complex configs.